All Scenarios
1517
Passed Scenarios
1256
Failed Scenarios
44
Skipped Scenarios
217
Execution Time: 413m 21s 163ms
I want to be sure to use a sane environment
As the admin user
I want to create the organisation, the first users and set the HTTP proxy
- Make syntax in httputil_test compatible with Python 3.6
- Fix KeyError in postgres module with PostgreSQL 17 (bsc#1254325)
- Added:
* fix-tornado-s-httputil_test-syntax-for-python-3.6.patch
* backport-add-maintain-m-privilege-to-postgres-module.patch
* Wed Jan 14 2026 Marek Czernek
- Use internal deb classes instead of external aptsource lib
- Speed up wheel key.finger call (bsc#1240532)
- Add security patches (bsc#1254903,bsc#1254905,bsc#1254904)
- Simplify and speed up utils.find_json function (bsc#1246130)
- Added:
* use-internal-salt.utils.pkg.deb-classes-instead-of-a.patch
* speedup-wheel-key.finger-call-bsc-1240532-713.patch
As root user
I want to add pillar data to disable that feature
As admin
I want to navigate through "Home" submenus changing some settings
As root user
I want to list available channels and enable them
Channel opensuse_tumbleweed-uyuni-client-x86_64 added
Channel opensuse_tumbleweed-uyuni-client-devel-x86_64 added
Channel opensuse_tumbleweed-uyuni-client-devel-x86_64 added
Channel uyuni-proxy-devel-tumbleweed-x86_64 added
Channel opensuse_tumbleweed-x86_64 finished reposync
Channel opensuse_tumbleweed-uyuni-client-devel-x86_64 finished reposync
Channel uyuni-proxy-devel-tumbleweed-x86_64 finished reposync
All channels for uyuni-proxy have been fully synced
Channel sles15-sp7-devel-uyuni-client-x86_64 finished reposync
1 minutes out of 102 waiting for 'sles15-sp7' channels to finish reposync
Channel sle-product-sles15-sp7-pool-x86_64 finished reposync
Channel sle-product-sles15-sp7-updates-x86_64 finished reposync
Channel sle15-sp7-installer-updates-x86_64 finished reposync
2 minutes out of 102 waiting for 'sles15-sp7' channels to finish reposync
3 minutes out of 102 waiting for 'sles15-sp7' channels to finish reposync
4 minutes out of 102 waiting for 'sles15-sp7' channels to finish reposync
5 minutes out of 102 waiting for 'sles15-sp7' channels to finish reposync
6 minutes out of 102 waiting for 'sles15-sp7' channels to finish reposync
7 minutes out of 102 waiting for 'sles15-sp7' channels to finish reposync
8 minutes out of 102 waiting for 'sles15-sp7' channels to finish reposync
9 minutes out of 102 waiting for 'sles15-sp7' channels to finish reposync
10 minutes out of 102 waiting for 'sles15-sp7' channels to finish reposync
Channel sle-module-basesystem15-sp7-updates-x86_64 finished reposync
11 minutes out of 102 waiting for 'sles15-sp7' channels to finish reposync
12 minutes out of 102 waiting for 'sles15-sp7' channels to finish reposync
13 minutes out of 102 waiting for 'sles15-sp7' channels to finish reposync
14 minutes out of 102 waiting for 'sles15-sp7' channels to finish reposync
Channel sle-module-basesystem15-sp7-pool-x86_64 finished reposync
15 minutes out of 102 waiting for 'sles15-sp7' channels to finish reposync
Channel sle-module-server-applications15-sp7-updates-x86_64 finished reposync
Channel sle-module-python3-15-sp7-updates-x86_64 finished reposync
Channel sle-module-server-applications15-sp7-pool-x86_64 finished reposync
Channel sle-module-python3-15-sp7-pool-x86_64 finished reposync
16 minutes out of 102 waiting for 'sles15-sp7' channels to finish reposync
Channel sle-module-systems-management-15-sp7-pool-x86_64 finished reposync
Channel sle-module-systems-management-15-sp7-updates-x86_64 finished reposync
17 minutes out of 102 waiting for 'sles15-sp7' channels to finish reposync
Channel sle-module-desktop-applications15-sp7-updates-x86_64 finished reposync
18 minutes out of 102 waiting for 'sles15-sp7' channels to finish reposync
19 minutes out of 102 waiting for 'sles15-sp7' channels to finish reposync
20 minutes out of 102 waiting for 'sles15-sp7' channels to finish reposync
21 minutes out of 102 waiting for 'sles15-sp7' channels to finish reposync
22 minutes out of 102 waiting for 'sles15-sp7' channels to finish reposync
23 minutes out of 102 waiting for 'sles15-sp7' channels to finish reposync
24 minutes out of 102 waiting for 'sles15-sp7' channels to finish reposync
Channel sle-module-desktop-applications15-sp7-pool-x86_64 finished reposync
25 minutes out of 102 waiting for 'sles15-sp7' channels to finish reposync
26 minutes out of 102 waiting for 'sles15-sp7' channels to finish reposync
27 minutes out of 102 waiting for 'sles15-sp7' channels to finish reposync
28 minutes out of 102 waiting for 'sles15-sp7' channels to finish reposync
29 minutes out of 102 waiting for 'sles15-sp7' channels to finish reposync
30 minutes out of 102 waiting for 'sles15-sp7' channels to finish reposync
31 minutes out of 102 waiting for 'sles15-sp7' channels to finish reposync
32 minutes out of 102 waiting for 'sles15-sp7' channels to finish reposync
33 minutes out of 102 waiting for 'sles15-sp7' channels to finish reposync
Channel sle-module-devtools15-sp7-updates-x86_64 finished reposync
34 minutes out of 102 waiting for 'sles15-sp7' channels to finish reposync
Channel sle-module-devtools15-sp7-pool-x86_64 finished reposync
All channels for sles15-sp7 have been fully synced
As an authorized user
I want to create fake channels for each distribution
As an authorized user
I want to create a fake repository per fake child channel
As an authorized user
I want to create custom channels for each distribution
As admin
I want to synchronize the fake channels
As admin
I want to synchronize the dev channels
As the testing user
I want to use activation keys
As admin
I want to update activation keys to use synchronized base products
As the system administrator
I create all bootstrap repos with --with-custom-channels option
channel: openSUSE-Tumbleweed-x86_64-uyuni
parent_channel:
Creating the bootstrap repository on the server:
mgr-create-bootstrap-repo --create openSUSE-Tumbleweed-x86_64-uyuni --with-custom-channels
channel: openSUSE-Tumbleweed-x86_64-uyuni
parent_channel:
Creating the bootstrap repository on the server:
mgr-create-bootstrap-repo --create openSUSE-Tumbleweed-x86_64-uyuni --with-custom-channels
channel: SLE-15-SP7-x86_64
parent_channel: sle-product-sles15-sp7-pool-x86_64
Creating the bootstrap repository on the server:
mgr-create-bootstrap-repo --create SLE-15-SP7-x86_64 --with-parent-channel sle-product-sles15-sp7-pool-x86_64 --with-custom-channels
As the system administrator
I want to register the containerized proxy on the server
As the system administrator
I make sure the network setup is as expected
* Mon Jan 19 2026 Marek Czernek
- Make syntax in httputil_test compatible with Python 3.6
- Fix KeyError in postgres module with PostgreSQL 17 (bsc#1254325)
- Added:
* fix-tornado-s-httputil_test-syntax-for-python-3.6.patch
* backport-add-maintain-m-privilege-to-postgres-module.patch
* Wed Jan 14 2026 Marek Czernek
- Use internal deb classes instead of external aptsource lib
* Drop dependency on saltbundlepy-apt
- Speed up wheel key.finger call (bsc#1240532)
- Add security patches (bsc#1254903,bsc#1254905,bsc#1254904)
- Simplify and speed up utils.find_json function (bsc#1246130)
- Added:
* use-internal-salt.utils.pkg.deb-classes-instead-of-a.patch
* speedup-wheel-key.finger-call-bsc-1240532-713.patch
- Make syntax in httputil_test compatible with Python 3.6
- Fix KeyError in postgres module with PostgreSQL 17 (bsc#1254325)
- Added:
* fix-tornado-s-httputil_test-syntax-for-python-3.6.patch
* backport-add-maintain-m-privilege-to-postgres-module.patch
* Wed Jan 14 2026 Marek Czernek
- Use internal deb classes instead of external aptsource lib
* Drop dependency on saltbundlepy-apt
- Speed up wheel key.finger call (bsc#1240532)
- Add security patches (bsc#1254903,bsc#1254905,bsc#1254904)
- Simplify and speed up utils.find_json function (bsc#1246130)
- Added:
* use-internal-salt.utils.pkg.deb-classes-instead-of-a.patch
- Make syntax in httputil_test compatible with Python 3.6
- Fix KeyError in postgres module with PostgreSQL 17 (bsc#1254325)
- Added:
* fix-tornado-s-httputil_test-syntax-for-python-3.6.patch
* backport-add-maintain-m-privilege-to-postgres-module.patch
* Wed Jan 14 2026 marek.czernek@suse.com
- Use internal deb classes instead of external aptsource lib
* Drop dependency on saltbundlepy-apt
- Speed up wheel key.finger call (bsc#1240532)
- Add security patches (bsc#1254903,bsc#1254905,bsc#1254904)
- Simplify and speed up utils.find_json function (bsc#1246130)
- Added:
* use-internal-salt.utils.pkg.deb-classes-instead-of-a.patch
As root user
I want to list available products from command line
'[ ] openSUSE Leap 15.6 x86_64' not found in output 'Available Products:
(R) - recommended extension
Status:
- [I] - product is installed
- [ ] - product is not installed, but is available
- [U] - product is unavailable
[ ] RHEL and Liberty 8 Base
[ ] RHEL and Liberty 9 Base
[ ] RHEL7 Base x86_64
[ ] SUSE Linux Enterprise Desktop 15 SP4 x86_64
[ ] SUSE Linux Enterprise Micro 5.2 x86_64
[ ] SUSE Linux Enterprise Micro 5.3 x86_64
[ ] SUSE Linux Enterprise Server 15 SP4 x86_64
[ ] SUSE Linux Enterprise Server 15 SP5 x86_64
[ ] SUSE Linux Enterprise Server 15 SP6 x86_64
[I] SUSE Linux Enterprise Server 15 SP7 x86_64
[I] (R) Basesystem Module 15 SP7 x86_64
[ ] Containers Module 15 SP7 x86_64
[I] Desktop Applications Module 15 SP7 x86_64
[I] Development Tools Module 15 SP7 x86_64
[ ] Public Cloud Module 15 SP7 x86_64
[I] (R) Python 3 Module 15 SP7 x86_64
[I] (R) Server Applications Module 15 SP7 x86_64
[I] (R) Systems Management Module 15 SP7 x86_64
[ ] Web and Scripting Module 15 SP7 x86_64
[ ] SUSE Linux Enterprise Live Patching 15 SP7 x86_64
' (ScriptError)
./features/step_definitions/command_steps.rb:191:in `/^I should get "([^"]*)"$/'
features/secondary/srv_mgr_sync_list_products.feature:17:in `I should get "[ ] openSUSE Leap 15.6 x86_64"'
or a clone created from it
or a clone created from it
| clone-fake-rpm-suse-channel |
|---|
| clone-fake-rpm-suse-channel |
|---|
| clone-clone-fake-rpm-suse-channel |
- Removed "Package Install/Upgrade scheduled by srv_maintenance_windows" action
Run export and import with ISS v2
Run export and import with ISS v2
As an authorized user
I want to see the Salt Minions that need to be patched
Result list: [{"errata_advisories"=>["milkyway-dummy-2345"], "system_id"=>1000010004, "channel_labels"=>["fake-rpm-suse-channel"], "patch_status"=>"AFFECTED_FULL_PATCH_APPLICABLE"}, {"errata_advisories"=>["milkyway-dummy-2345"], "system_id"=>1000010001, "channel_labels"=>["fake-base-channel-rh-like"], "patch_status"=>"AFFECTED_FULL_PATCH_APPLICABLE"}, {"errata_advisories"=>[], "system_id"=>1000010003, "channel_labels"=>[], "patch_status"=>"NOT_AFFECTED"}, {"errata_advisories"=>[], "system_id"=>1000010005, "channel_labels"=>[], "patch_status"=>"UNKNOWN"}, {"errata_advisories"=>[], "system_id"=>1000010002, "channel_labels"=>[], "patch_status"=>"UNKNOWN"}, {"errata_advisories"=>[], "system_id"=>1000010000, "channel_labels"=>[], "patch_status"=>"UNKNOWN"}]
result: {"errata_advisories"=>["milkyway-dummy-2345"], "system_id"=>1000010004, "channel_labels"=>["fake-rpm-suse-channel"], "patch_status"=>"AFFECTED_FULL_PATCH_APPLICABLE"}
As an authorized user
I want to run an OpenSCAP scan on it
As an authorized user
I want to run a remote command on it
As an authorized user
I want to run a remote command on it
Text 'Permission denied, no authentication information' and 'Permission denied (publickey,password,keyboard-interactive)' not found (ScriptError)
./features/step_definitions/navigation_steps.rb:707:in `block (2 levels) in (top (required))'
./features/step_definitions/navigation_steps.rb:706:in `/^I should see "([^"]*)" or "([^"]*)" in the ([^ ]+) textarea$/'
features/secondary/min_bootstrap_ssh_key.feature:44:in `I should see "Permission denied, no authentication information" or "Permission denied (publickey,password,keyboard-interactive)" in the stderr textarea'
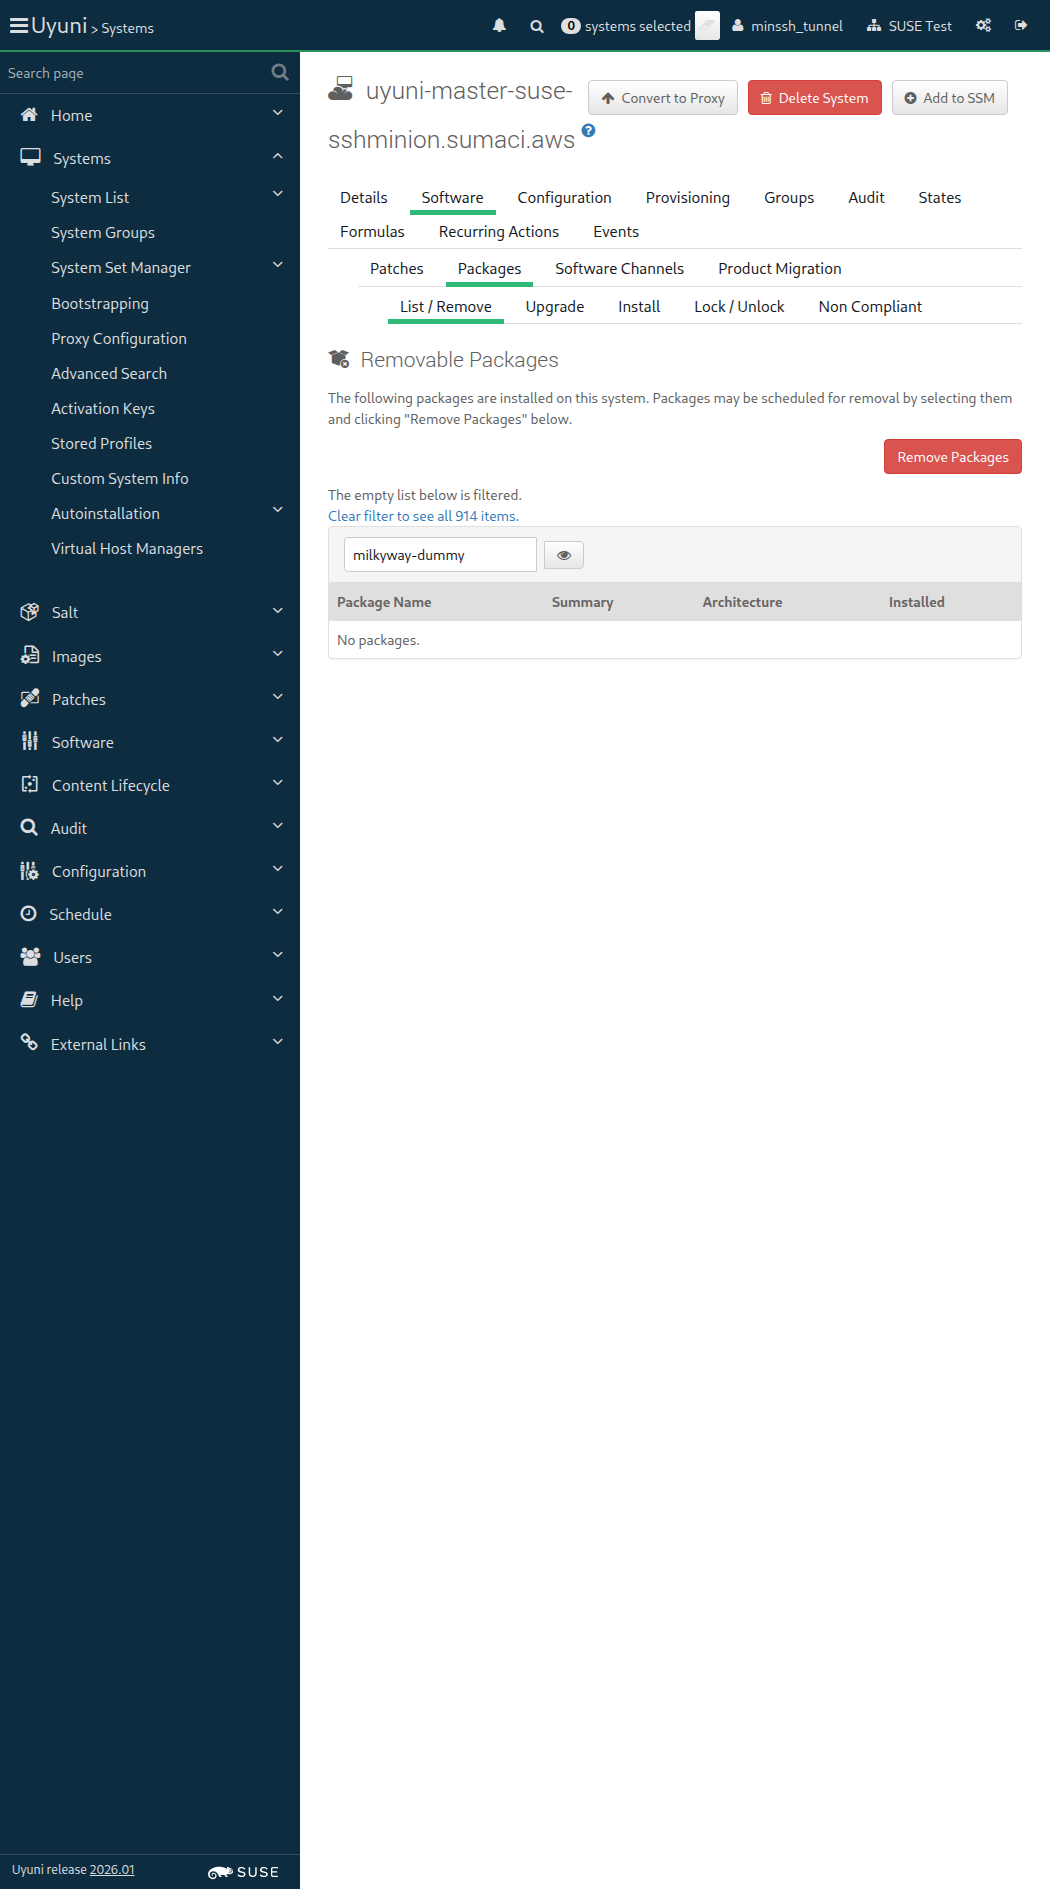
2) subscribe minion to a base channels
3) install and remove a package
Text 'milkyway-dummy' not found (ScriptError)
./features/step_definitions/navigation_steps.rb:40:in `/^I wait until I see "([^"]*)" text$/'
features/secondary/minssh_tunnel.feature:66:in `I wait until I see "milkyway-dummy" text'
18:48:14:000 - 18:52:27:000 | Current URL: https://uyuni-master-server.sumaci.aws/rhn/systems/details/packages/PackageList.do?sid=1000010012
As an authorized user
I want to avoid re-registration with invalid input parameters
Reactivation Key: re-1-e01d5019eeb9422c9101c70e3d75ea0b
As an authorized user
I want to verify all the minion key management features in the UI
Scenario:Pre-requisite: ensure the errata cache is computed before patching Salt minion
18s 511ms
11
Scenario:Pre-requisite: ensure the errata cache is computed before software states tests
8s 486ms
11
Scenario:Check if onboarding for the minion with the new module.run syntax was successful
8s 532ms
3
Expected protocol: https host: uyuni-master-proxy.sumaci.aws port: 443
Expected protocol: ftp host: mirror.sumaci.aws port: 445
Expected protocol: https host: uyuni-master-proxy.sumaci.aws port: 443
- Package Install/Upgrade
- Package Removal
- System reboot
- Package Install/Upgrade
- Run an arbitrary script
- Removed "Package Install/Upgrade" action
- Removed "Package Removal" action
- Removed "System reboot" action
- Removed "Package Install/Upgrade" action
- Removed "Run an arbitrary script" action
- Run an arbitrary script
- Run an arbitrary script
- Run an arbitrary script
- Run an arbitrary script
Scenario:Pre-requisite: ensure the errata cache is computed before testing on SSH minion
56s 277ms
6
Scenario:Subscribe system to configuration channel for testing action chain on SSH minion
2s 577ms
8
- Package Install/Upgrade
- Run an arbitrary script
- Package Install/Upgrade
- Package Removal
- Removed "Package Install/Upgrade" action
- Removed "Run an arbitrary script" action
- Removed "Package Install/Upgrade" action
- Removed "Package Removal" action
- Run an arbitrary script
- Run an arbitrary script
- Run an arbitrary script
- Run an arbitrary script
As the system administrator
I want to PXE boot one host with Cobbler
As the system administrator
I PXE boot one of the terminals
As the system administrator
I perform a mass import of several virtual terminals and one real minion
- Removed "Remote Command on uyuni-master-suse-minion.sumaci.aws. scheduled by MalaysianUser" action
As an authorized user
I want to watch different logfiles
| inst.repo | http://ise.cobbler.test |
|---|---|
| self_update | http://ise.cobbler.test |
As an authorized user
I want enter a new password
As the testing user
I want to create and edit activation keys
entitlements: []
usage_limit: 10
universal_default: false
description: Key description
base_channel_label: none
child_channel_labels: []
app_streams: {}
packages: []
server_group_ids: []
contact_method: default
package_names: []
disabled: false
key: 1-testkey
As an authorized user
I want to download packages from the channels
As a authorized user
I want to be able to easily pick dates
As an authorized user
I want to avoid session and other attacks
I want to use general Salt functionality and system registration
As an authorized user
I want to see all the texts and links
As an authorized user
I want to manage channels
As an authorized user
I want to be able to search different keywords in the menu filter
| LABEL | NAME | SUMMARY | ARCH | PARENT |
|---|---|---|---|---|
| foobar | foobar | foobar | channel-x86_64 |
| LABEL | NAME | SUMMARY | ARCH | PARENT |
|---|---|---|---|---|
| foobar-child | foobar-child | child of foobar | channel-x86_64 | foobar |
As a authorized user
I want to see all the texts and links
Warning: Radio button 'Deny' is already checked
| clp_label-prod_label-fake-base-channel-suse-like |
|---|
| clp_label-prod_label-sle-product-sles15-sp7-updates-x86_64 |
| clp_label-qa_label-fake-base-channel-suse-like |
| clp_label-qa_label-sle-product-sles15-sp7-updates-x86_64 |
| clp_label-dev_label-fake-base-channel-suse-like |
| clp_label-dev_label-sle-product-sles15-sp7-updates-x86_64 |
| clp_label-prod_label-sle-product-sles15-sp7-pool-x86_64 |
|---|
| clp_label-qa_label-sle-product-sles15-sp7-pool-x86_64 |
| clp_label-dev_label-sle-product-sles15-sp7-pool-x86_64 |
| clp_label-prod_label-fake-base-channel-suse-like |
|---|
| clp_label-prod_label-opensuse_tumbleweed-x86_64 |
| clp_label-qa_label-fake-base-channel-suse-like |
| clp_label-qa_label-opensuse_tumbleweed-x86_64 |
| clp_label-dev_label-fake-base-channel-suse-like |
| clp_label-dev_label-opensuse_tumbleweed-x86_64 |
As admin user
I want to list available ssh connections and add or remove them
As an authorized user
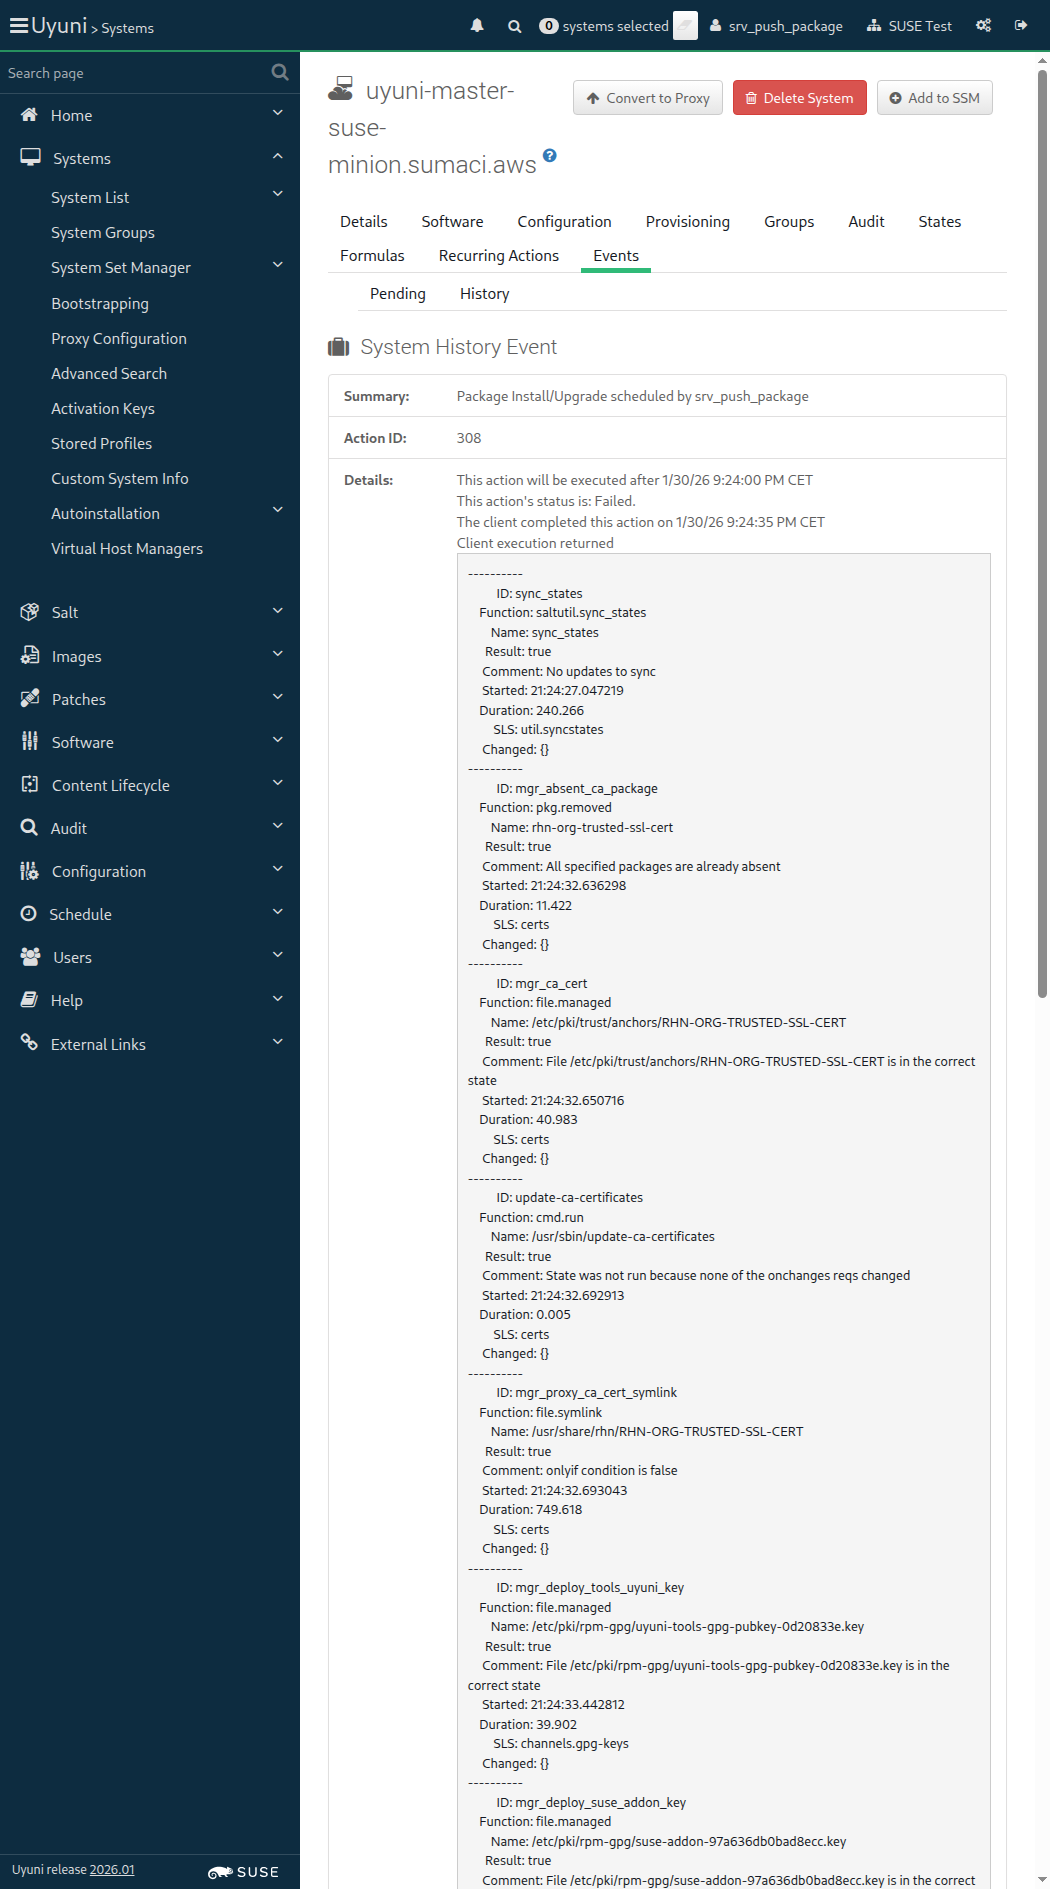
I want to push a package with unset vendor
unknown error - Event failed (SystemCallError)
./features/step_definitions/navigation_steps.rb:96:in `block (2 levels) in (top (required))'
./features/support/commonlib.rb:106:in `block in repeat_until_timeout'
./features/support/commonlib.rb:95:in `repeat_until_timeout'
./features/step_definitions/navigation_steps.rb:88:in `/^I wait at most (\d+) seconds until the event is completed, refreshing the page$/'
./features/step_definitions/common_steps.rb:157:in `/^I wait (\d+) seconds until the event is picked up and (\d+) seconds until the event "([^"]*)" is completed$/'
./features/step_definitions/common_steps.rb:174:in `/^I wait at most (\d+) seconds until event "([^"]*)" is completed$/'
./features/step_definitions/common_steps.rb:151:in `/^I wait until event "([^"]*)" is completed$/'
features/secondary/srv_push_package.feature:29:in `I wait until event "Package Install/Upgrade scheduled" is completed'
21:24:19:000 - 21:24:49:000 | Current URL: https://uyuni-master-server.sumaci.aws/rhn/systems/details/history/Event.do?sid=1000010023&aid=308
FAIL: mgrpush -u admin -p admin --server=uyuni-master-server.sumaci.aws --nosig -c fake-base-channel-suse-like /root/subscription-tools-1.0-0.noarch.rpm returned status code = 127.
Output:
(ScriptError)
./features/support/remote_node.rb:169:in `run_local'
./features/support/remote_node.rb:117:in `run'
./features/step_definitions/common_steps.rb:327:in `/^I push package "([^"]*)" into "([^"]*)" channel through "([^"]*)"$/'
features/secondary/srv_push_package.feature:33:in `I push package "/root/subscription-tools-1.0-0.noarch.rpm" into "fake-base-channel-suse-like" channel through "sle_minion"'
21:25:03:000 - 21:25:05:000 | Current URL: https://uyuni-master-server.sumaci.aws/rhn/systems/details/history/Event.do?sid=1000010023&aid=308

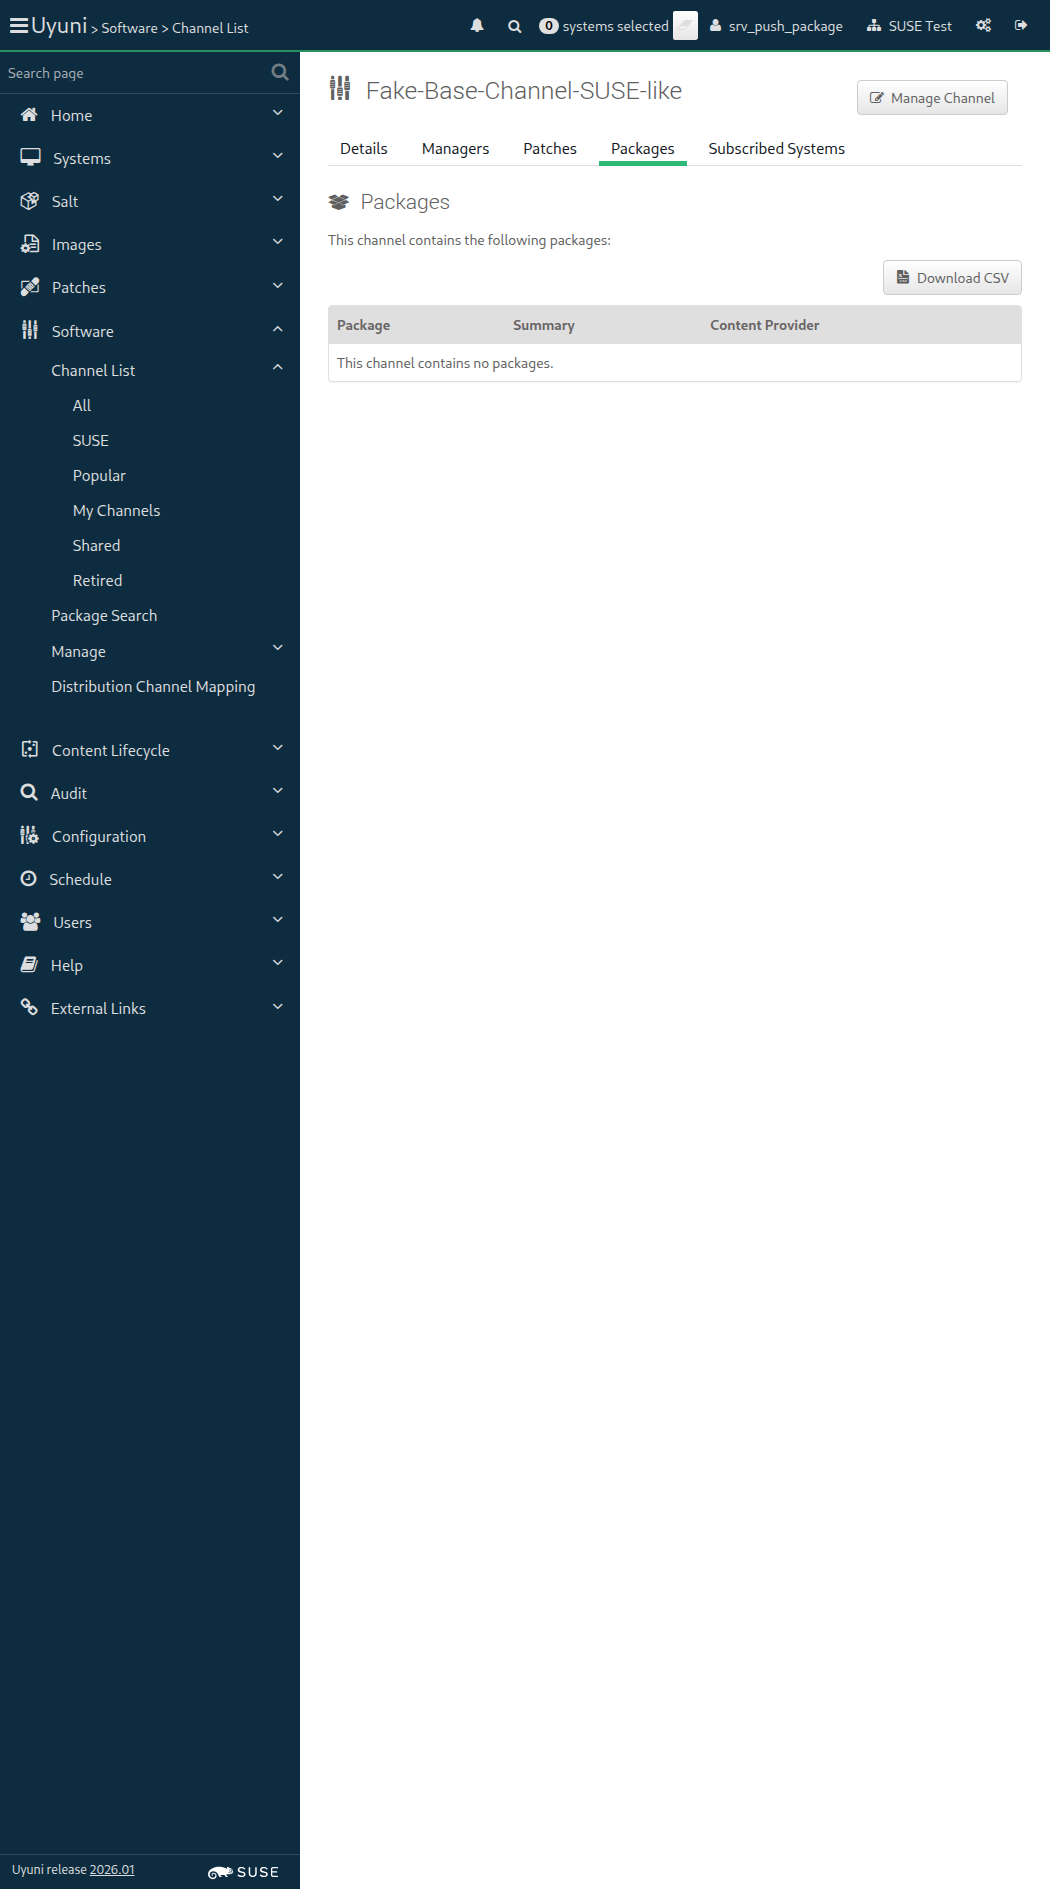
Unable to find link "subscription-tools-1.0-0.noarch" (Capybara::ElementNotFound)
./features/support/commonlib.rb:198:in `click_link_and_wait'
./features/step_definitions/navigation_steps.rb:339:in `/^I follow "([^"]*)"$/'
features/secondary/srv_push_package.feature:40:in `I follow "subscription-tools-1.0-0.noarch"'
21:25:19:000 - 21:25:30:000 | Current URL: https://uyuni-master-server.sumaci.aws/rhn/channels/ChannelPackages.do?cid=121
As an authorized user
I want to access and use the report database named "ReportDB"
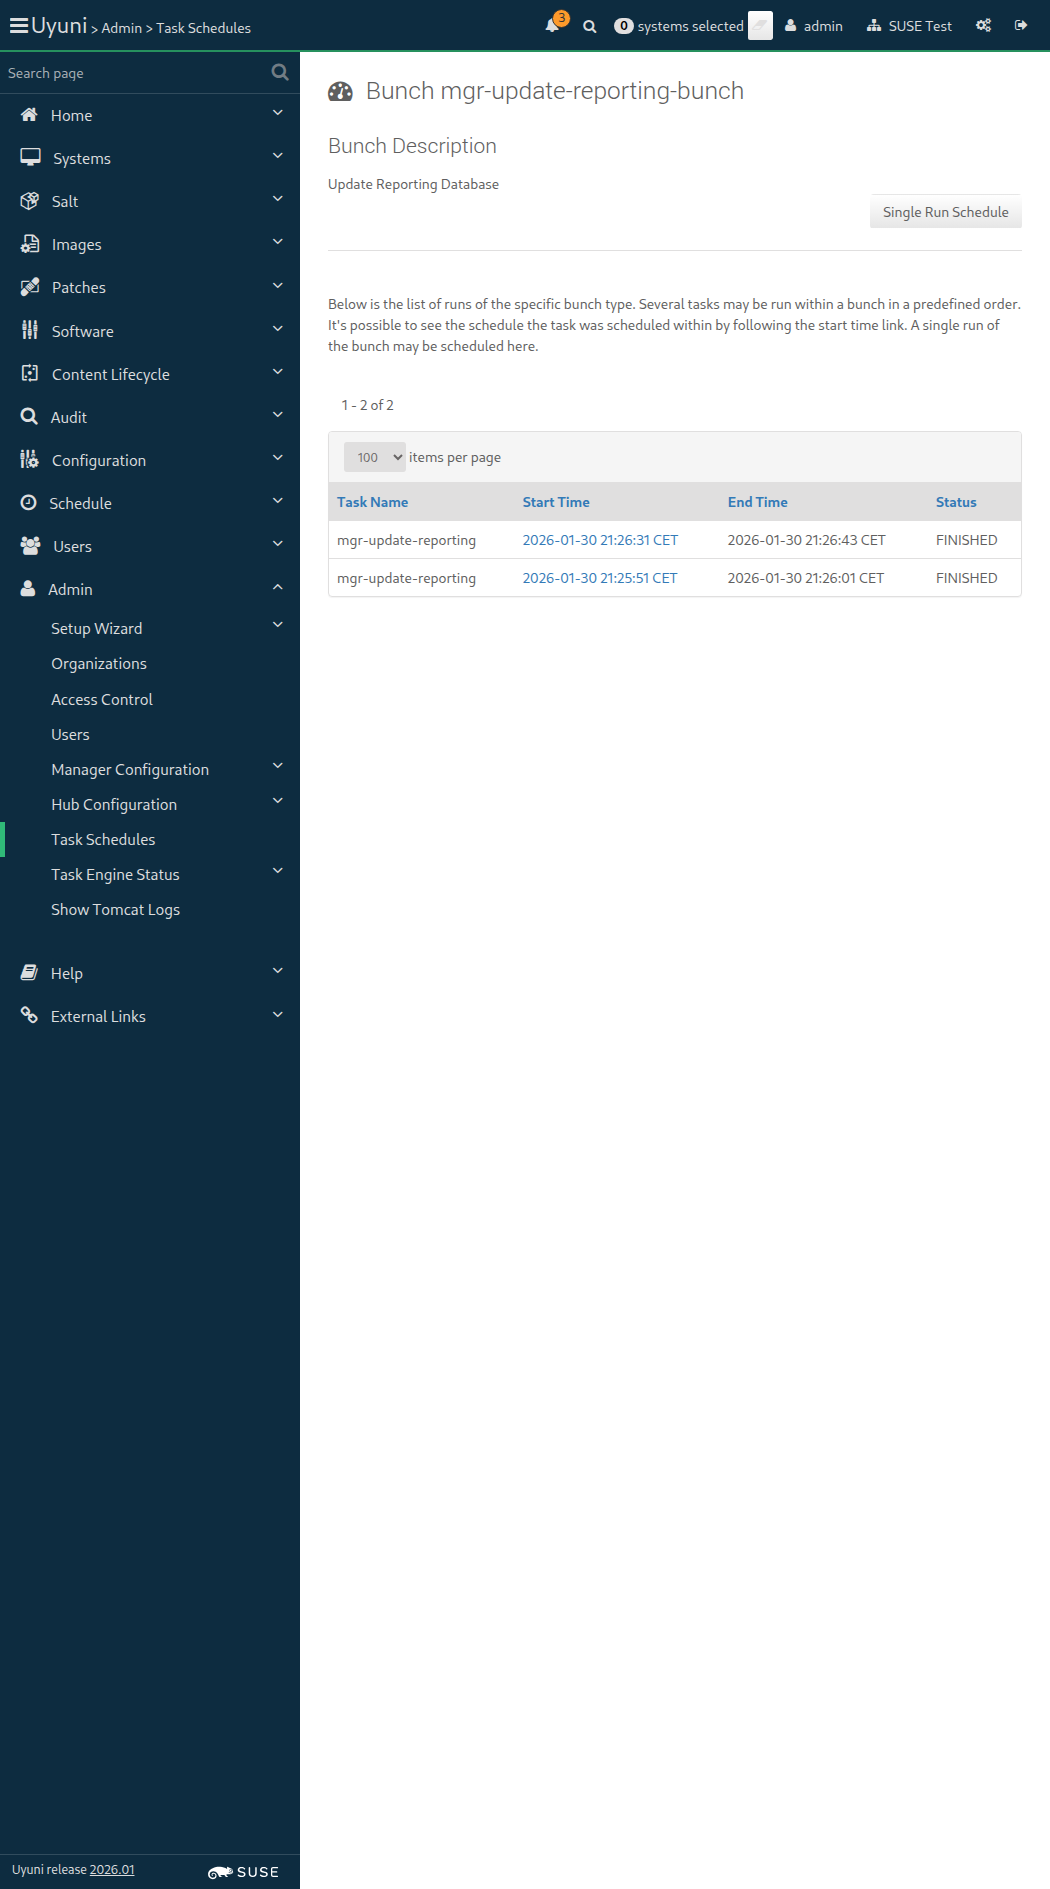
[{"last_boot"=>"2026-01-30T19:04:49Z", "name"=>"uyuni-master-suse-minion.sumaci.aws", "id"=>1000010023, "last_checkin"=>"2026-01-30T20:24:35Z"}]
Created read-only user on the ReportDB remains listed (ScriptError)
./features/step_definitions/command_steps.rb:1424:in `/^I shouldn't see the read-only user listed on the ReportDB user accounts$/'
features/secondary/srv_reportdb.feature:57:in `I shouldn't see the read-only user listed on the ReportDB user accounts'
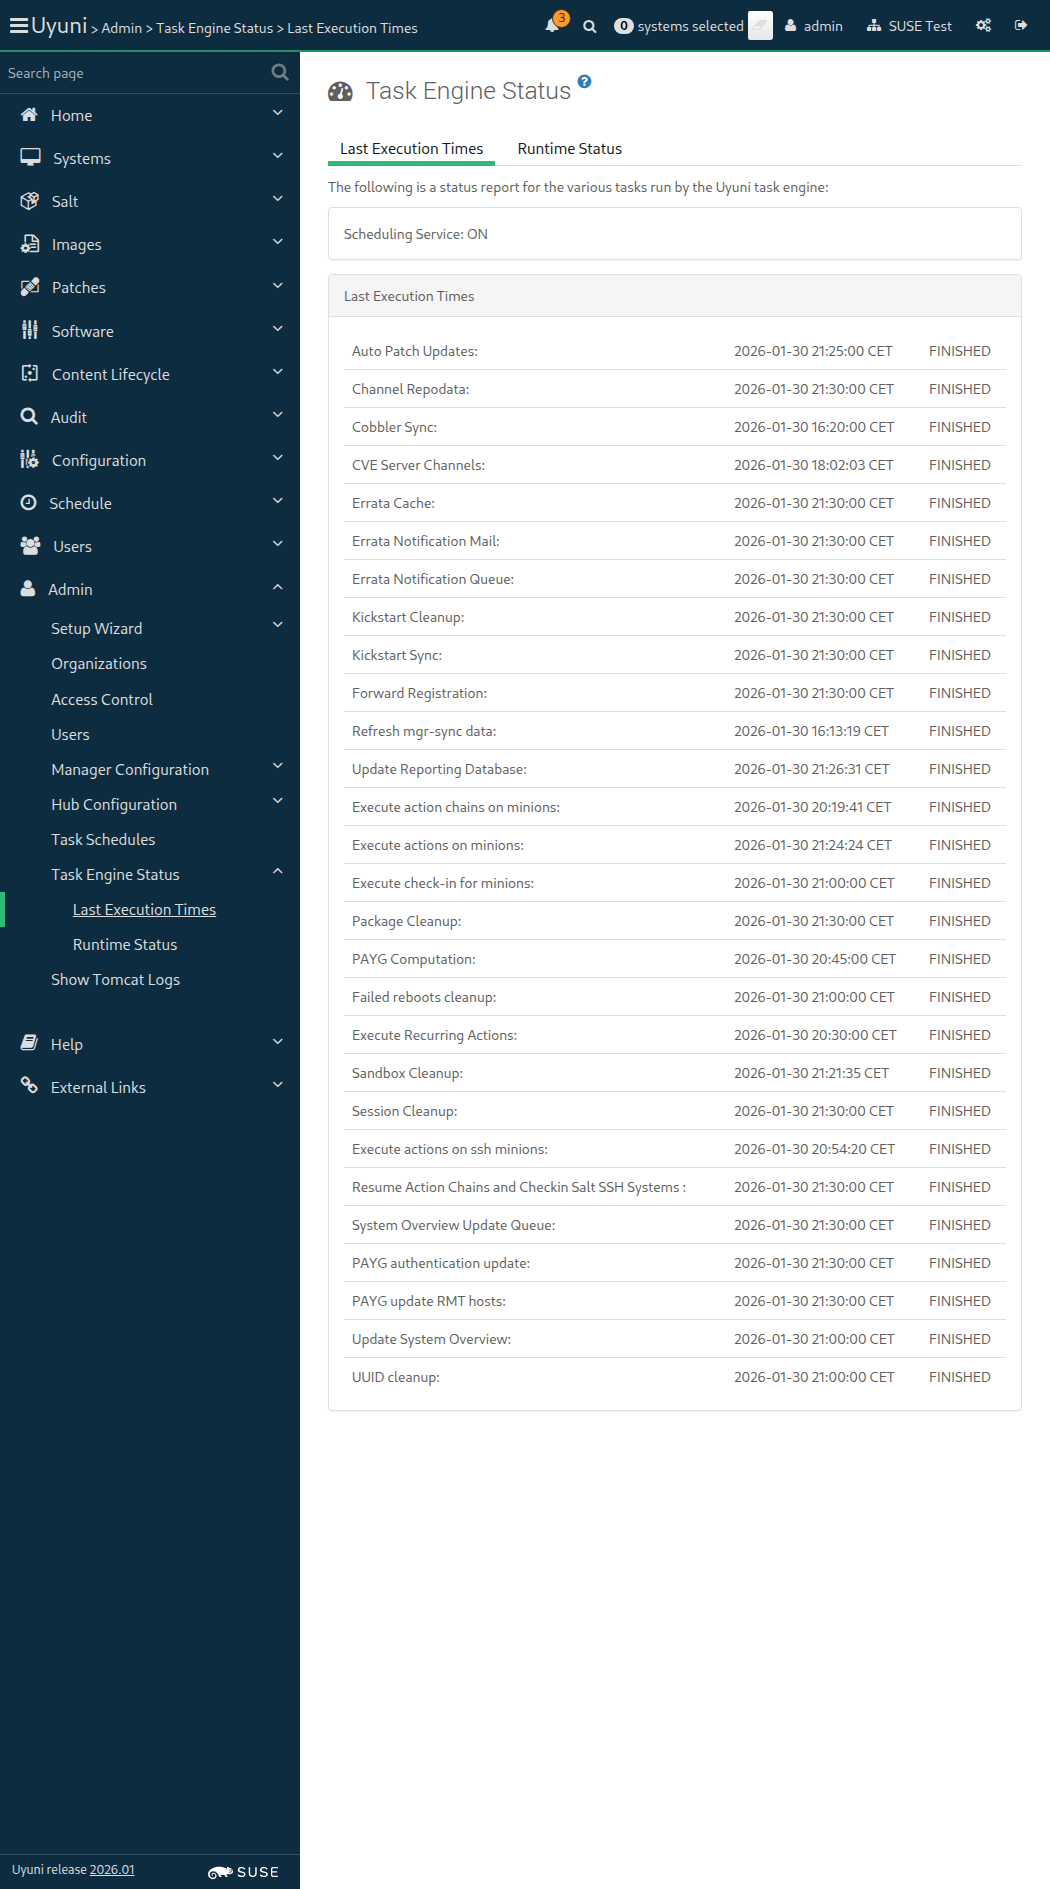
21:26:44:000 - 21:26:48:000 | Current URL: https://uyuni-master-server.sumaci.aws/rhn/admin/BunchDetail.do?label=mgr-update-reporting-bunch
should be able to be parsed by Health Check tool.
FAIL: mgr-health-check -v -s /root/server-supportconfig/uyuni-server-supportconfig/ start returned status code = 1.
Output:
┏━━━━━━━━━━━━━━━━━━━━━━━━━━━━━━━━━━━━━━━━━━━━━━━━━━━━━━━━━━━━━━━━━━━━━━━━━━━━━━┓
┃ Health Check ┃
┗━━━━━━━━━━━━━━━━━━━━━━━━━━━━━━━━━━━━━━━━━━━━━━━━━━━━━━━━━━━━━━━━━━━━━━━━━━━━━━┛
[21:33:12] Checking connection with podman: main.py:43
Executing: podman --version utils.py:37
[21:33:13] podman version 4.9.5 utils.py:61
Supportconfig path not accessible, exitting main.py:94
(ScriptError)
./features/support/remote_node.rb:169:in `run_local'
./features/support/remote_node.rb:117:in `run'
./features/step_definitions/command_steps.rb:1793:in `/^I start the health check tool with supportconfig "([^"]*)" on "([^"]*)"$/'
features/secondary/srv_health_check_supportconfig.feature:19:in `I start the health check tool with supportconfig "/root/server-supportconfig/uyuni-server-supportconfig/" on "localhost"'
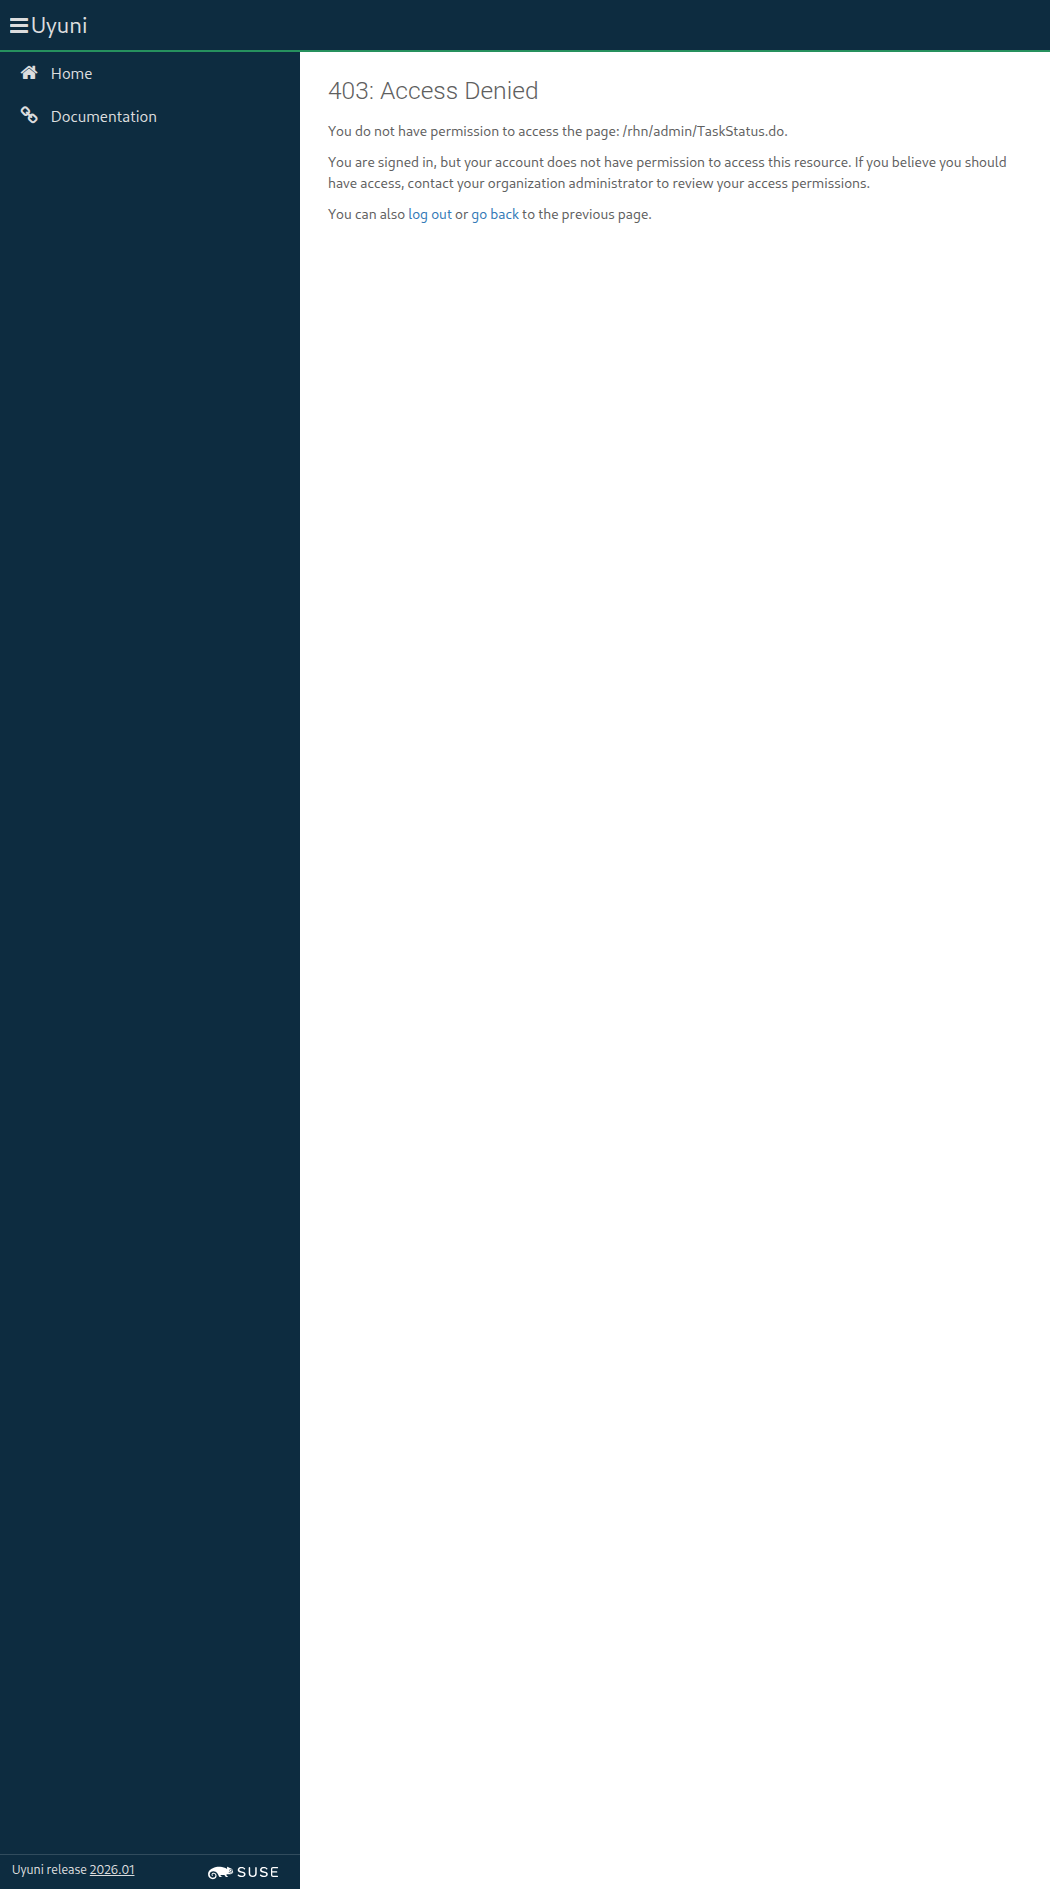
21:33:12:000 - 21:33:13:000 | Current URL: https://uyuni-master-server.sumaci.aws/rhn/admin/TaskStatus.do
execution expired (Timeout::Error)
./features/support/commonlib.rb:95:in `repeat_until_timeout'
./features/support/remote_node.rb:202:in `run_until_ok'
./features/step_definitions/command_steps.rb:1570:in `/^I wait until port "([^"]*)" is listening on "([^"]*)" (host|container)$/'
features/secondary/srv_health_check_supportconfig.feature:23:in `I wait until port "9000" is listening on "localhost" host'
21:33:26:000 - 21:37:36:000 | Current URL: https://uyuni-master-server.sumaci.aws/rhn/admin/TaskStatus.do

FAIL: curl -s localhost:9000/metrics.json | python3 -c 'import sys, json; print(json.load(sys.stdin).keys())' returned status code = 1.
Output:
(ScriptError)
./features/support/remote_node.rb:169:in `run_local'
./features/support/remote_node.rb:117:in `run'
./features/step_definitions/command_steps.rb:1821:in `/^I check that the health check tool exposes metrics on "([^"]*)"$/'
features/secondary/srv_health_check_supportconfig.feature:29:in `I check that the health check tool exposes metrics on "localhost"'
21:37:49:000 - 21:37:49:000 | Current URL: https://uyuni-master-server.sumaci.aws/rhn/admin/TaskStatus.do
I want to configure and enforce password complexity requirements,
So that user accounts comply with security policies
| Require Digits |
|---|
| Require Lowercase Characters |
| Require Uppercase Characters |
| Require Special Characters |
| Restrict Characters Occurrences |
| Restrict Consecutive Characters |
| Require Digits |
|---|
| Require Lowercase Characters |
| Require Uppercase Characters |
| Require Special Characters |
| Restrict Characters Occurrences |
| Restrict Consecutive Characters |
| Require Digits |
|---|
| Require Lowercase Characters |
| Require Uppercase Characters |
| Require Special Characters |
| Restrict Characters Occurrences |
| Restrict Consecutive Characters |
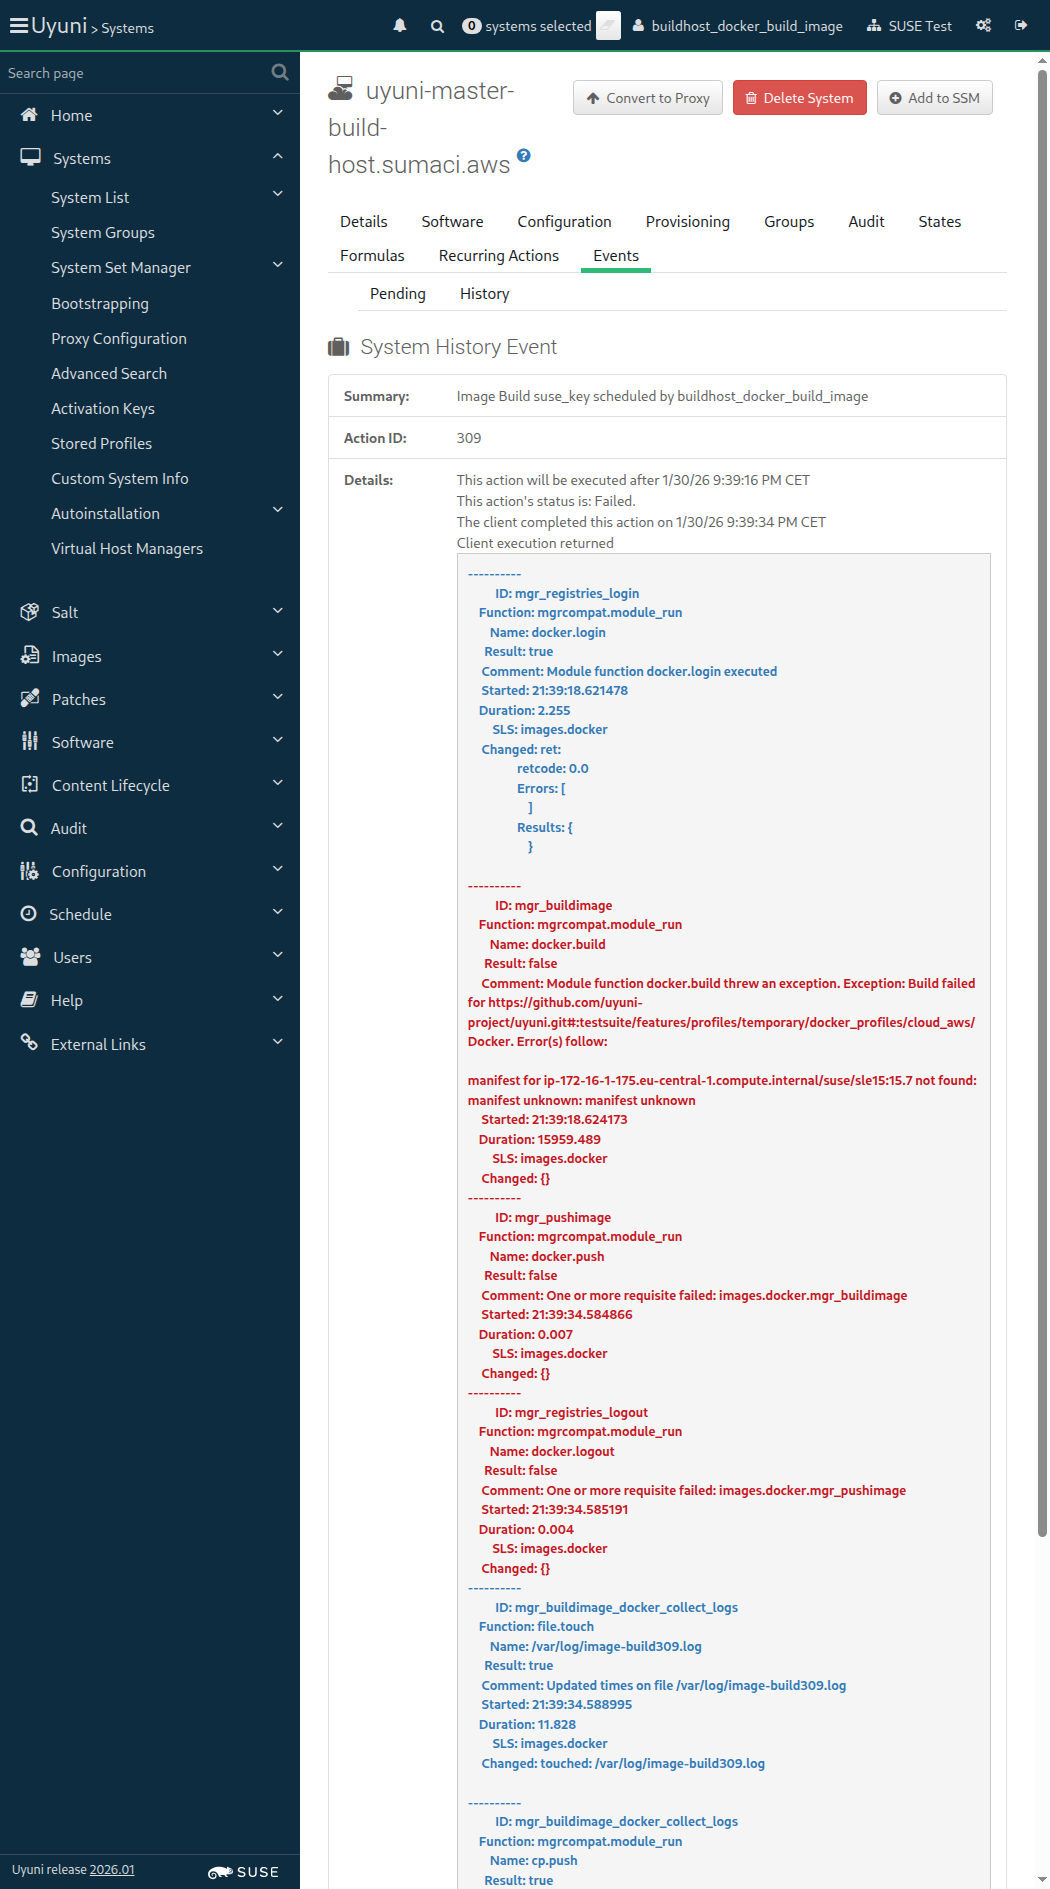
unknown error - Event failed (SystemCallError)
./features/step_definitions/navigation_steps.rb:96:in `block (2 levels) in (top (required))'
./features/support/commonlib.rb:106:in `block in repeat_until_timeout'
./features/support/commonlib.rb:95:in `repeat_until_timeout'
./features/step_definitions/navigation_steps.rb:88:in `/^I wait at most (\d+) seconds until the event is completed, refreshing the page$/'
./features/step_definitions/common_steps.rb:157:in `/^I wait (\d+) seconds until the event is picked up and (\d+) seconds until the event "([^"]*)" is completed$/'
./features/step_definitions/common_steps.rb:174:in `/^I wait at most (\d+) seconds until event "([^"]*)" is completed$/'
features/secondary/buildhost_docker_build_image.feature:61:in `I wait at most 660 seconds until event "Image Build suse_key scheduled" is completed'
21:39:12:000 - 21:39:58:000 | Current URL: https://uyuni-master-server.sumaci.aws/rhn/systems/details/history/Event.do?sid=1000010003&aid=309

Image Details: {"outdatedPackages"=>0, "buildServerId"=>1000010003, "obsolete"=>false, "bugErrata"=>0, "installedPackages"=>0, "type"=>"dockerfile", "version"=>"latest", "storeLabel"=>"galaxy-registry", "revision"=>0, "securityErrata"=>0, "buildStatus"=>"failed", "external"=>false, "profileLabel"=>"suse_key", "name"=>"suse_key", "checksum"=>"", "files"=>[], "id"=>1, "arch"=>"x86_64", "enhancementErrata"=>0}
the list of image packages is empty (ScriptError)
./features/step_definitions/docker_steps.rb:143:in `/^the list of packages of image "([^"]*)" with version "([^"]*)" is not empty$/'
features/secondary/buildhost_docker_build_image.feature:69:in `the list of packages of image "suse_key" with version "latest" is not empty'
21:40:12:000 - 21:40:13:000 | Current URL: https://uyuni-master-server.sumaci.aws/rhn/systems/details/history/Event.do?sid=1000010003&aid=309
unknown error - Event failed (SystemCallError)
./features/step_definitions/navigation_steps.rb:96:in `block (2 levels) in (top (required))'
./features/support/commonlib.rb:106:in `block in repeat_until_timeout'
./features/support/commonlib.rb:95:in `repeat_until_timeout'
./features/step_definitions/navigation_steps.rb:88:in `/^I wait at most (\d+) seconds until the event is completed, refreshing the page$/'
./features/step_definitions/common_steps.rb:157:in `/^I wait (\d+) seconds until the event is picked up and (\d+) seconds until the event "([^"]*)" is completed$/'
./features/step_definitions/common_steps.rb:174:in `/^I wait at most (\d+) seconds until event "([^"]*)" is completed$/'
features/secondary/buildhost_docker_build_image.feature:74:in `I wait at most 660 seconds until event "Image Build suse_simple scheduled" is completed'
21:40:26:000 - 21:41:10:000 | Current URL: https://uyuni-master-server.sumaci.aws/rhn/systems/details/history/Event.do?sid=1000010003&aid=310
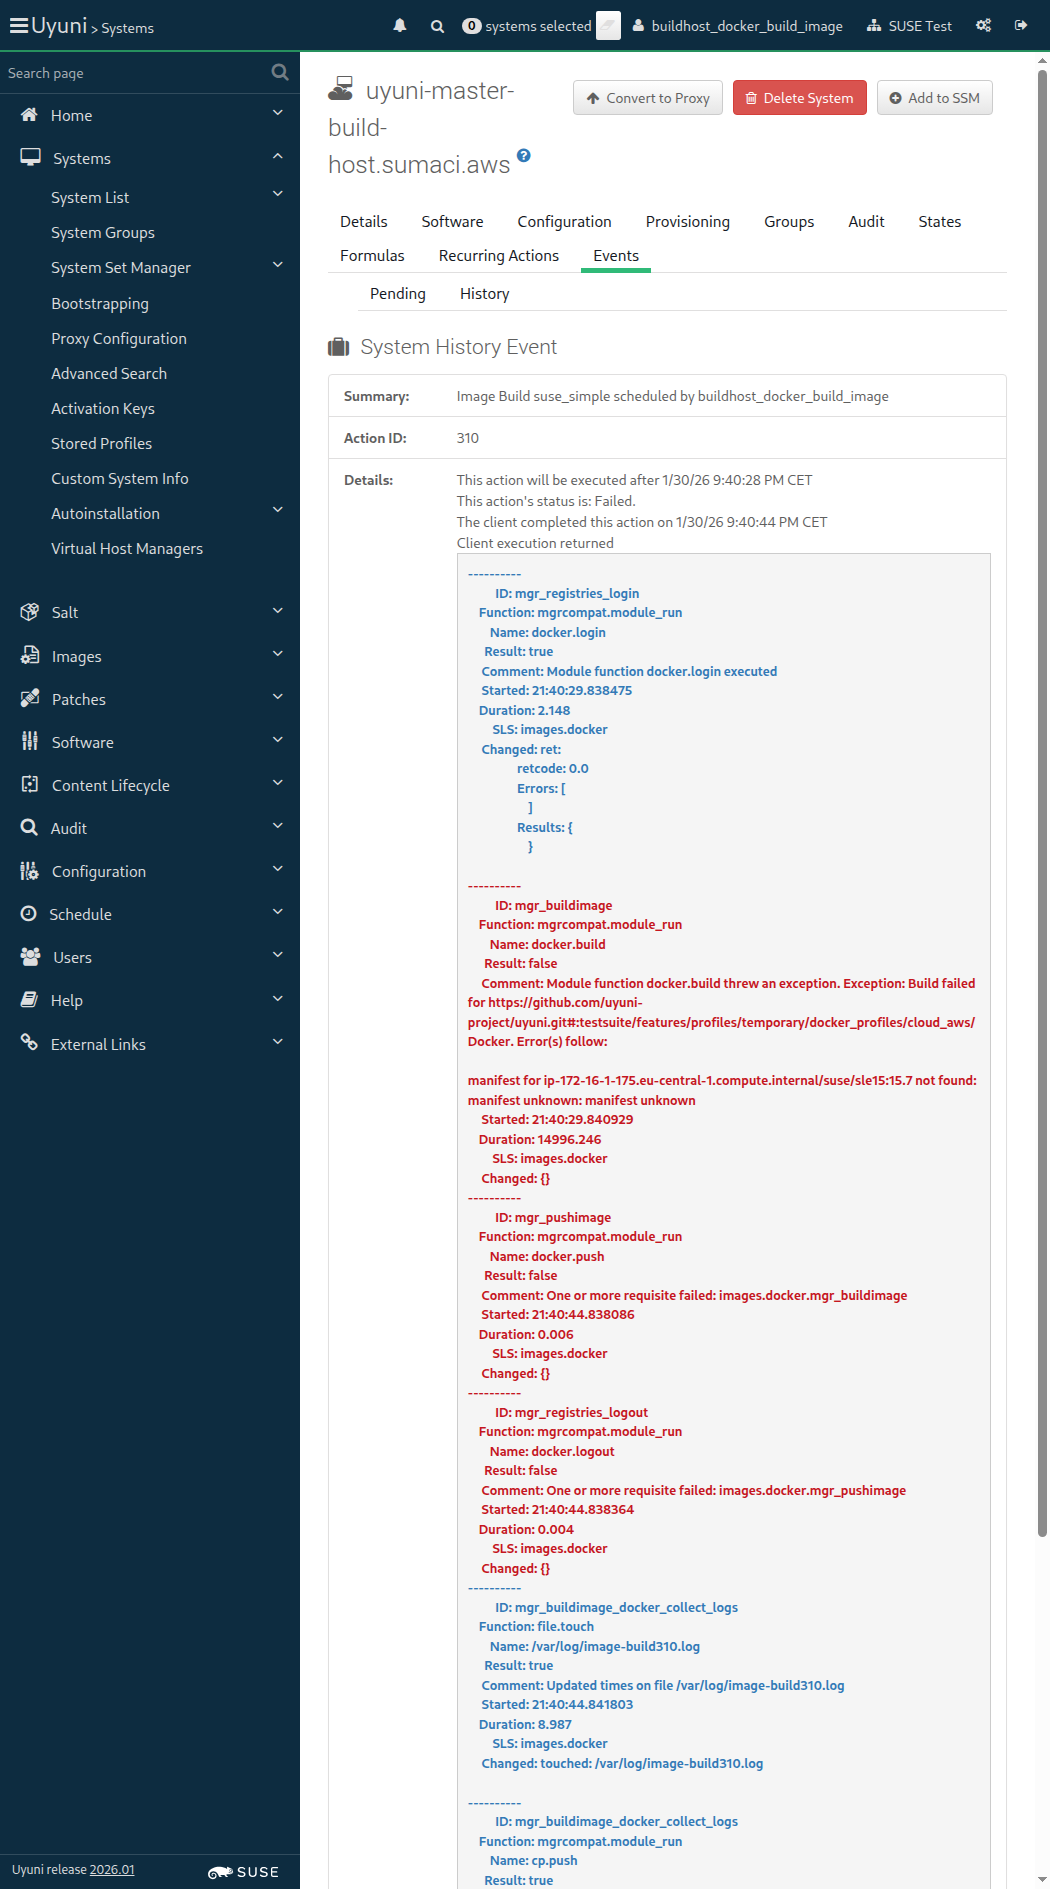
Image Details: {"outdatedPackages"=>0, "buildServerId"=>1000010003, "obsolete"=>false, "bugErrata"=>0, "installedPackages"=>0, "type"=>"dockerfile", "version"=>"latest", "storeLabel"=>"galaxy-registry", "revision"=>0, "securityErrata"=>0, "buildStatus"=>"failed", "external"=>false, "profileLabel"=>"suse_simple", "name"=>"suse_simple", "checksum"=>"", "files"=>[], "id"=>2, "arch"=>"x86_64", "enhancementErrata"=>0}
the list of image packages is empty (ScriptError)
./features/step_definitions/docker_steps.rb:143:in `/^the list of packages of image "([^"]*)" with version "([^"]*)" is not empty$/'
features/secondary/buildhost_docker_build_image.feature:80:in `the list of packages of image "suse_simple" with version "latest" is not empty'
21:41:23:000 - 21:41:24:000 | Current URL: https://uyuni-master-server.sumaci.aws/rhn/systems/details/history/Event.do?sid=1000010003&aid=310

unknown error - error detected while building images (SystemCallError)
./features/step_definitions/docker_steps.rb:90:in `block (2 levels) in (top (required))'
./features/support/commonlib.rb:106:in `block in repeat_until_timeout'
./features/support/commonlib.rb:95:in `repeat_until_timeout'
./features/step_definitions/docker_steps.rb:87:in `/^I wait at most (\d+) seconds until all "([^"]*)" container images are built correctly on the Image List page$/'
features/secondary/buildhost_docker_build_image.feature:87:in `I wait at most 60 seconds until all "3" container images are built correctly on the Image List page'
21:41:38:000 - 21:44:33:000 | Current URL: https://uyuni-master-server.sumaci.aws/rhn/manager/cm/images

Image Details: {"outdatedPackages"=>0, "buildServerId"=>1000010003, "obsolete"=>false, "bugErrata"=>0, "installedPackages"=>0, "type"=>"dockerfile", "inspectStatus"=>"picked up", "version"=>"latest", "storeLabel"=>"galaxy-registry", "revision"=>1, "securityErrata"=>0, "buildStatus"=>"completed", "external"=>false, "profileLabel"=>"suse_real_key", "name"=>"suse_real_key", "checksum"=>"", "files"=>[], "id"=>3, "arch"=>"x86_64", "enhancementErrata"=>0}
the list of image packages is empty (ScriptError)
./features/step_definitions/docker_steps.rb:143:in `/^the list of packages of image "([^"]*)" with version "([^"]*)" is not empty$/'
features/secondary/buildhost_docker_build_image.feature:94:in `the list of packages of image "suse_real_key" with version "latest" is not empty'
21:44:47:000 - 21:44:48:000 | Current URL: https://uyuni-master-server.sumaci.aws/rhn/manager/cm/images
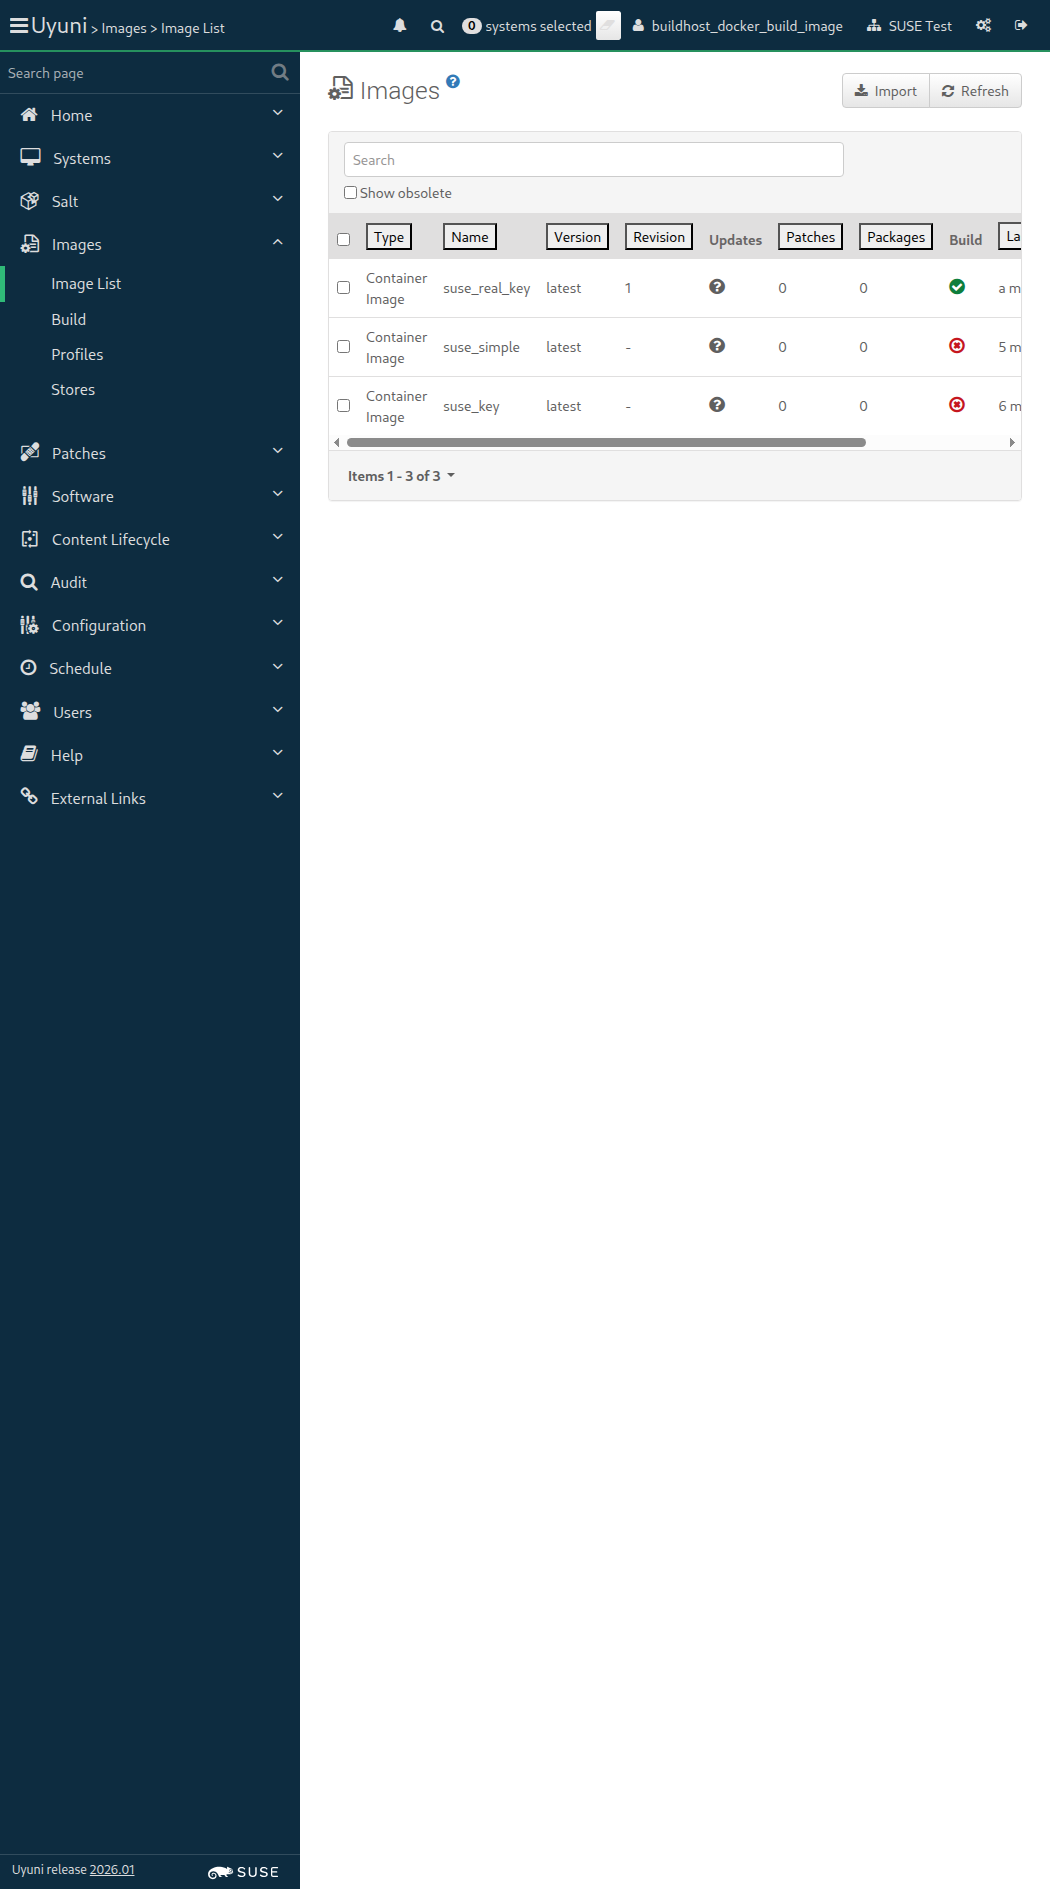
Image Details: {"outdatedPackages"=>0, "buildServerId"=>1000010003, "obsolete"=>false, "bugErrata"=>0, "installedPackages"=>0, "type"=>"dockerfile", "version"=>"Latest_key-activation1", "storeLabel"=>"galaxy-registry", "revision"=>0, "securityErrata"=>0, "buildStatus"=>"picked up", "external"=>false, "profileLabel"=>"suse_key", "name"=>"suse_key", "checksum"=>"", "files"=>[], "id"=>4, "arch"=>"x86_64", "enhancementErrata"=>0}
Image Details: {"outdatedPackages"=>0, "buildServerId"=>1000010003, "obsolete"=>false, "bugErrata"=>0, "installedPackages"=>0, "type"=>"dockerfile", "version"=>"Latest_key-activation1", "storeLabel"=>"galaxy-registry", "revision"=>0, "securityErrata"=>0, "buildStatus"=>"picked up", "external"=>false, "profileLabel"=>"suse_key", "name"=>"suse_key", "checksum"=>"", "files"=>[], "id"=>4, "arch"=>"x86_64", "enhancementErrata"=>0}
Image Details: {"outdatedPackages"=>0, "buildServerId"=>1000010003, "obsolete"=>false, "bugErrata"=>0, "installedPackages"=>0, "type"=>"dockerfile", "version"=>"Latest_key-activation1", "storeLabel"=>"galaxy-registry", "revision"=>0, "securityErrata"=>0, "buildStatus"=>"picked up", "external"=>false, "profileLabel"=>"suse_key", "name"=>"suse_key", "checksum"=>"", "files"=>[], "id"=>4, "arch"=>"x86_64", "enhancementErrata"=>0}
Image Details: {"outdatedPackages"=>0, "buildServerId"=>1000010003, "obsolete"=>false, "bugErrata"=>0, "installedPackages"=>0, "type"=>"dockerfile", "version"=>"Latest_key-activation1", "storeLabel"=>"galaxy-registry", "revision"=>0, "securityErrata"=>0, "buildStatus"=>"picked up", "external"=>false, "profileLabel"=>"suse_key", "name"=>"suse_key", "checksum"=>"", "files"=>[], "id"=>4, "arch"=>"x86_64", "enhancementErrata"=>0}
Image Details: {"outdatedPackages"=>0, "buildServerId"=>1000010003, "obsolete"=>false, "bugErrata"=>0, "installedPackages"=>0, "type"=>"dockerfile", "version"=>"Latest_key-activation1", "storeLabel"=>"galaxy-registry", "revision"=>0, "securityErrata"=>0, "buildStatus"=>"picked up", "external"=>false, "profileLabel"=>"suse_key", "name"=>"suse_key", "checksum"=>"", "files"=>[], "id"=>4, "arch"=>"x86_64", "enhancementErrata"=>0}
Image Details: {"outdatedPackages"=>0, "buildServerId"=>1000010003, "obsolete"=>false, "bugErrata"=>0, "installedPackages"=>0, "type"=>"dockerfile", "version"=>"Latest_key-activation1", "storeLabel"=>"galaxy-registry", "revision"=>0, "securityErrata"=>0, "buildStatus"=>"picked up", "external"=>false, "profileLabel"=>"suse_key", "name"=>"suse_key", "checksum"=>"", "files"=>[], "id"=>4, "arch"=>"x86_64", "enhancementErrata"=>0}
Image Details: {"outdatedPackages"=>0, "buildServerId"=>1000010003, "obsolete"=>false, "bugErrata"=>0, "installedPackages"=>0, "type"=>"dockerfile", "version"=>"Latest_key-activation1", "storeLabel"=>"galaxy-registry", "revision"=>0, "securityErrata"=>0, "buildStatus"=>"picked up", "external"=>false, "profileLabel"=>"suse_key", "name"=>"suse_key", "checksum"=>"", "files"=>[], "id"=>4, "arch"=>"x86_64", "enhancementErrata"=>0}
Image Details: {"outdatedPackages"=>0, "buildServerId"=>1000010003, "obsolete"=>false, "bugErrata"=>0, "installedPackages"=>0, "type"=>"dockerfile", "version"=>"Latest_key-activation1", "storeLabel"=>"galaxy-registry", "revision"=>0, "securityErrata"=>0, "buildStatus"=>"picked up", "external"=>false, "profileLabel"=>"suse_key", "name"=>"suse_key", "checksum"=>"", "files"=>[], "id"=>4, "arch"=>"x86_64", "enhancementErrata"=>0}
Image Details: {"outdatedPackages"=>0, "buildServerId"=>1000010003, "obsolete"=>false, "bugErrata"=>0, "installedPackages"=>0, "type"=>"dockerfile", "version"=>"Latest_key-activation1", "storeLabel"=>"galaxy-registry", "revision"=>0, "securityErrata"=>0, "buildStatus"=>"picked up", "external"=>false, "profileLabel"=>"suse_key", "name"=>"suse_key", "checksum"=>"", "files"=>[], "id"=>4, "arch"=>"x86_64", "enhancementErrata"=>0}
Image Details: {"outdatedPackages"=>0, "buildServerId"=>1000010003, "obsolete"=>false, "bugErrata"=>0, "installedPackages"=>0, "type"=>"dockerfile", "version"=>"Latest_key-activation1", "storeLabel"=>"galaxy-registry", "revision"=>0, "securityErrata"=>0, "buildStatus"=>"picked up", "external"=>false, "profileLabel"=>"suse_key", "name"=>"suse_key", "checksum"=>"", "files"=>[], "id"=>4, "arch"=>"x86_64", "enhancementErrata"=>0}
Image Details: {"outdatedPackages"=>0, "buildServerId"=>1000010003, "obsolete"=>false, "bugErrata"=>0, "installedPackages"=>0, "type"=>"dockerfile", "version"=>"Latest_key-activation1", "storeLabel"=>"galaxy-registry", "revision"=>0, "securityErrata"=>0, "buildStatus"=>"picked up", "external"=>false, "profileLabel"=>"suse_key", "name"=>"suse_key", "checksum"=>"", "files"=>[], "id"=>4, "arch"=>"x86_64", "enhancementErrata"=>0}
Image Details: {"outdatedPackages"=>0, "buildServerId"=>1000010003, "obsolete"=>false, "bugErrata"=>0, "installedPackages"=>0, "type"=>"dockerfile", "version"=>"Latest_key-activation1", "storeLabel"=>"galaxy-registry", "revision"=>0, "securityErrata"=>0, "buildStatus"=>"picked up", "external"=>false, "profileLabel"=>"suse_key", "name"=>"suse_key", "checksum"=>"", "files"=>[], "id"=>4, "arch"=>"x86_64", "enhancementErrata"=>0}
Image Details: {"outdatedPackages"=>0, "buildServerId"=>1000010003, "obsolete"=>false, "bugErrata"=>0, "installedPackages"=>0, "type"=>"dockerfile", "version"=>"Latest_key-activation1", "storeLabel"=>"galaxy-registry", "revision"=>0, "securityErrata"=>0, "buildStatus"=>"picked up", "external"=>false, "profileLabel"=>"suse_key", "name"=>"suse_key", "checksum"=>"", "files"=>[], "id"=>4, "arch"=>"x86_64", "enhancementErrata"=>0}
Image Details: {"outdatedPackages"=>0, "buildServerId"=>1000010003, "obsolete"=>false, "bugErrata"=>0, "installedPackages"=>0, "type"=>"dockerfile", "version"=>"Latest_key-activation1", "storeLabel"=>"galaxy-registry", "revision"=>0, "securityErrata"=>0, "buildStatus"=>"picked up", "external"=>false, "profileLabel"=>"suse_key", "name"=>"suse_key", "checksum"=>"", "files"=>[], "id"=>4, "arch"=>"x86_64", "enhancementErrata"=>0}
Image Details: {"outdatedPackages"=>0, "buildServerId"=>1000010003, "obsolete"=>false, "bugErrata"=>0, "installedPackages"=>0, "type"=>"dockerfile", "version"=>"Latest_key-activation1", "storeLabel"=>"galaxy-registry", "revision"=>0, "securityErrata"=>0, "buildStatus"=>"picked up", "external"=>false, "profileLabel"=>"suse_key", "name"=>"suse_key", "checksum"=>"", "files"=>[], "id"=>4, "arch"=>"x86_64", "enhancementErrata"=>0}
Image Details: {"outdatedPackages"=>0, "buildServerId"=>1000010003, "obsolete"=>false, "bugErrata"=>0, "installedPackages"=>0, "type"=>"dockerfile", "version"=>"Latest_key-activation1", "storeLabel"=>"galaxy-registry", "revision"=>0, "securityErrata"=>0, "buildStatus"=>"picked up", "external"=>false, "profileLabel"=>"suse_key", "name"=>"suse_key", "checksum"=>"", "files"=>[], "id"=>4, "arch"=>"x86_64", "enhancementErrata"=>0}
Image Details: {"outdatedPackages"=>0, "buildServerId"=>1000010003, "obsolete"=>false, "bugErrata"=>0, "installedPackages"=>0, "type"=>"dockerfile", "version"=>"Latest_key-activation1", "storeLabel"=>"galaxy-registry", "revision"=>0, "securityErrata"=>0, "buildStatus"=>"picked up", "external"=>false, "profileLabel"=>"suse_key", "name"=>"suse_key", "checksum"=>"", "files"=>[], "id"=>4, "arch"=>"x86_64", "enhancementErrata"=>0}
Image Details: {"outdatedPackages"=>0, "buildServerId"=>1000010003, "obsolete"=>false, "bugErrata"=>0, "installedPackages"=>0, "type"=>"dockerfile", "version"=>"Latest_key-activation1", "storeLabel"=>"galaxy-registry", "revision"=>0, "securityErrata"=>0, "buildStatus"=>"picked up", "external"=>false, "profileLabel"=>"suse_key", "name"=>"suse_key", "checksum"=>"", "files"=>[], "id"=>4, "arch"=>"x86_64", "enhancementErrata"=>0}
Image Details: {"outdatedPackages"=>0, "buildServerId"=>1000010003, "obsolete"=>false, "bugErrata"=>0, "installedPackages"=>0, "type"=>"dockerfile", "version"=>"Latest_key-activation1", "storeLabel"=>"galaxy-registry", "revision"=>0, "securityErrata"=>0, "buildStatus"=>"picked up", "external"=>false, "profileLabel"=>"suse_key", "name"=>"suse_key", "checksum"=>"", "files"=>[], "id"=>4, "arch"=>"x86_64", "enhancementErrata"=>0}
Image Details: {"outdatedPackages"=>0, "buildServerId"=>1000010003, "obsolete"=>false, "bugErrata"=>0, "installedPackages"=>0, "type"=>"dockerfile", "version"=>"Latest_key-activation1", "storeLabel"=>"galaxy-registry", "revision"=>0, "securityErrata"=>0, "buildStatus"=>"picked up", "external"=>false, "profileLabel"=>"suse_key", "name"=>"suse_key", "checksum"=>"", "files"=>[], "id"=>4, "arch"=>"x86_64", "enhancementErrata"=>0}
Image Details: {"outdatedPackages"=>0, "buildServerId"=>1000010003, "obsolete"=>false, "bugErrata"=>0, "installedPackages"=>0, "type"=>"dockerfile", "version"=>"Latest_key-activation1", "storeLabel"=>"galaxy-registry", "revision"=>0, "securityErrata"=>0, "buildStatus"=>"failed", "external"=>false, "profileLabel"=>"suse_key", "name"=>"suse_key", "checksum"=>"", "files"=>[], "id"=>4, "arch"=>"x86_64", "enhancementErrata"=>0}
unknown error - image build failed. (SystemCallError)
./features/step_definitions/docker_steps.rb:55:in `block (2 levels) in (top (required))'
./features/support/commonlib.rb:106:in `block in repeat_until_timeout'
./features/support/commonlib.rb:95:in `repeat_until_timeout'
./features/step_definitions/docker_steps.rb:41:in `/^I wait at most (\d+) seconds until image "([^"]*)" with version "([^"]*)" is built successfully via API$/'
features/secondary/buildhost_docker_build_image.feature:99:in `I wait at most 900 seconds until image "suse_key" with version "Latest_key-activation1" is built successfully via API'
21:45:03:000 - 21:46:57:000 | Current URL: https://uyuni-master-server.sumaci.aws/rhn/manager/cm/images

Image Details: {"outdatedPackages"=>0, "buildServerId"=>1000010003, "obsolete"=>false, "bugErrata"=>0, "installedPackages"=>0, "type"=>"dockerfile", "version"=>"Latest_key-activation1", "storeLabel"=>"galaxy-registry", "revision"=>0, "securityErrata"=>0, "buildStatus"=>"failed", "external"=>false, "profileLabel"=>"suse_key", "name"=>"suse_key", "checksum"=>"", "files"=>[], "id"=>4, "arch"=>"x86_64", "enhancementErrata"=>0}
the list of image packages is empty (ScriptError)
./features/step_definitions/docker_steps.rb:143:in `/^the list of packages of image "([^"]*)" with version "([^"]*)" is not empty$/'
features/secondary/buildhost_docker_build_image.feature:105:in `the list of packages of image "suse_key" with version "Latest_key-activation1" is not empty'
21:47:12:000 - 21:47:13:000 | Current URL: https://uyuni-master-server.sumaci.aws/rhn/manager/cm/images

Image Details: {"outdatedPackages"=>0, "buildServerId"=>1000010003, "obsolete"=>false, "bugErrata"=>0, "installedPackages"=>0, "type"=>"dockerfile", "version"=>"Latest_simple", "storeLabel"=>"galaxy-registry", "revision"=>0, "securityErrata"=>0, "buildStatus"=>"picked up", "external"=>false, "profileLabel"=>"suse_simple", "name"=>"suse_simple", "checksum"=>"", "files"=>[], "id"=>5, "arch"=>"x86_64", "enhancementErrata"=>0}
Image Details: {"outdatedPackages"=>0, "buildServerId"=>1000010003, "obsolete"=>false, "bugErrata"=>0, "installedPackages"=>0, "type"=>"dockerfile", "version"=>"Latest_simple", "storeLabel"=>"galaxy-registry", "revision"=>0, "securityErrata"=>0, "buildStatus"=>"picked up", "external"=>false, "profileLabel"=>"suse_simple", "name"=>"suse_simple", "checksum"=>"", "files"=>[], "id"=>5, "arch"=>"x86_64", "enhancementErrata"=>0}
Image Details: {"outdatedPackages"=>0, "buildServerId"=>1000010003, "obsolete"=>false, "bugErrata"=>0, "installedPackages"=>0, "type"=>"dockerfile", "version"=>"Latest_simple", "storeLabel"=>"galaxy-registry", "revision"=>0, "securityErrata"=>0, "buildStatus"=>"picked up", "external"=>false, "profileLabel"=>"suse_simple", "name"=>"suse_simple", "checksum"=>"", "files"=>[], "id"=>5, "arch"=>"x86_64", "enhancementErrata"=>0}
Image Details: {"outdatedPackages"=>0, "buildServerId"=>1000010003, "obsolete"=>false, "bugErrata"=>0, "installedPackages"=>0, "type"=>"dockerfile", "version"=>"Latest_simple", "storeLabel"=>"galaxy-registry", "revision"=>0, "securityErrata"=>0, "buildStatus"=>"failed", "external"=>false, "profileLabel"=>"suse_simple", "name"=>"suse_simple", "checksum"=>"", "files"=>[], "id"=>5, "arch"=>"x86_64", "enhancementErrata"=>0}
unknown error - image build failed. (SystemCallError)
./features/step_definitions/docker_steps.rb:55:in `block (2 levels) in (top (required))'
./features/support/commonlib.rb:106:in `block in repeat_until_timeout'
./features/support/commonlib.rb:95:in `repeat_until_timeout'
./features/step_definitions/docker_steps.rb:41:in `/^I wait at most (\d+) seconds until image "([^"]*)" with version "([^"]*)" is built successfully via API$/'
features/secondary/buildhost_docker_build_image.feature:109:in `I wait at most 900 seconds until image "suse_simple" with version "Latest_simple" is built successfully via API'
21:47:27:000 - 21:47:50:000 | Current URL: https://uyuni-master-server.sumaci.aws/rhn/manager/cm/images
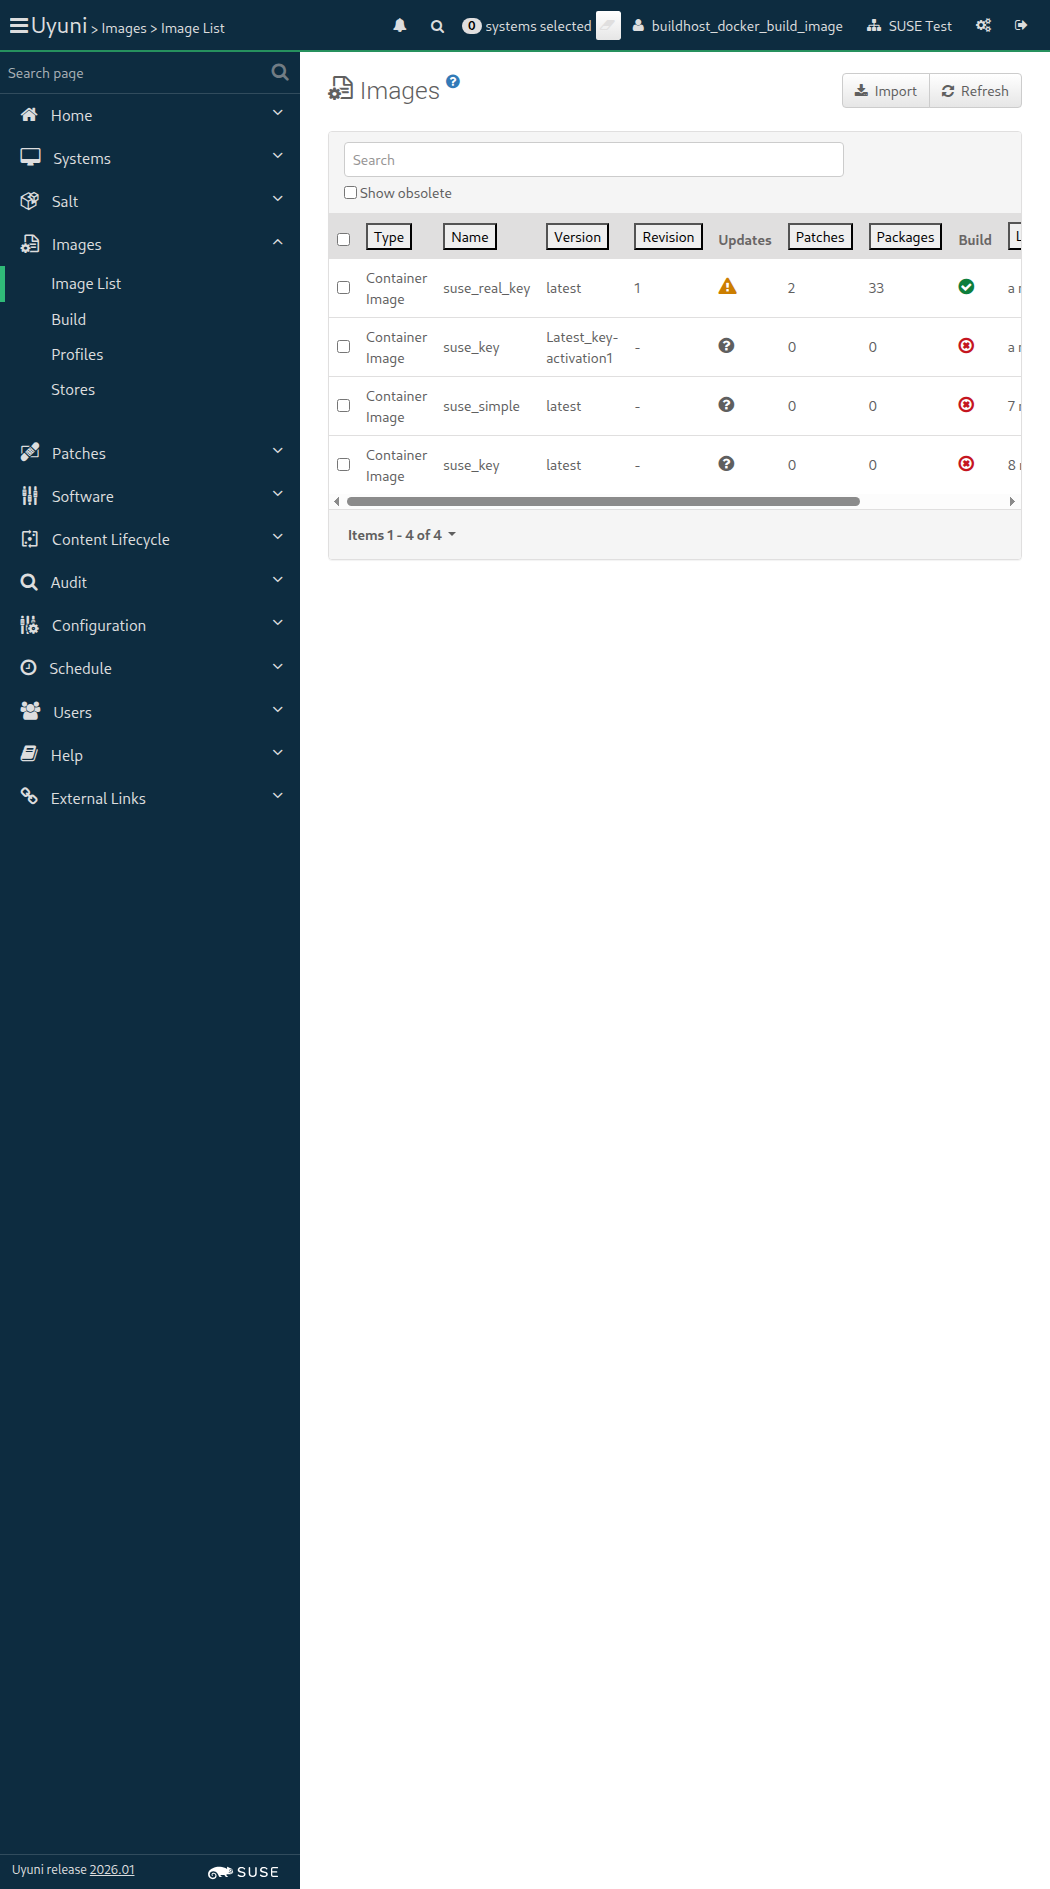
Image Details: {"outdatedPackages"=>0, "buildServerId"=>1000010003, "obsolete"=>false, "bugErrata"=>0, "installedPackages"=>0, "type"=>"dockerfile", "version"=>"Latest_simple", "storeLabel"=>"galaxy-registry", "revision"=>0, "securityErrata"=>0, "buildStatus"=>"failed", "external"=>false, "profileLabel"=>"suse_simple", "name"=>"suse_simple", "checksum"=>"", "files"=>[], "id"=>5, "arch"=>"x86_64", "enhancementErrata"=>0}
the list of image packages is empty (ScriptError)
./features/step_definitions/docker_steps.rb:143:in `/^the list of packages of image "([^"]*)" with version "([^"]*)" is not empty$/'
features/secondary/buildhost_docker_build_image.feature:115:in `the list of packages of image "suse_simple" with version "Latest_simple" is not empty'
21:48:04:000 - 21:48:05:000 | Current URL: https://uyuni-master-server.sumaci.aws/rhn/manager/cm/images

Image Details: {"outdatedPackages"=>0, "buildServerId"=>1000010003, "obsolete"=>false, "bugErrata"=>0, "installedPackages"=>0, "type"=>"dockerfile", "version"=>"Latest_simple", "storeLabel"=>"galaxy-registry", "revision"=>0, "securityErrata"=>0, "buildStatus"=>"picked up", "external"=>false, "profileLabel"=>"suse_simple", "name"=>"suse_simple", "checksum"=>"", "files"=>[], "id"=>6, "arch"=>"x86_64", "enhancementErrata"=>0}
Image Details: {"outdatedPackages"=>0, "buildServerId"=>1000010003, "obsolete"=>false, "bugErrata"=>0, "installedPackages"=>0, "type"=>"dockerfile", "version"=>"Latest_simple", "storeLabel"=>"galaxy-registry", "revision"=>0, "securityErrata"=>0, "buildStatus"=>"picked up", "external"=>false, "profileLabel"=>"suse_simple", "name"=>"suse_simple", "checksum"=>"", "files"=>[], "id"=>6, "arch"=>"x86_64", "enhancementErrata"=>0}
Image Details: {"outdatedPackages"=>0, "buildServerId"=>1000010003, "obsolete"=>false, "bugErrata"=>0, "installedPackages"=>0, "type"=>"dockerfile", "version"=>"Latest_simple", "storeLabel"=>"galaxy-registry", "revision"=>0, "securityErrata"=>0, "buildStatus"=>"picked up", "external"=>false, "profileLabel"=>"suse_simple", "name"=>"suse_simple", "checksum"=>"", "files"=>[], "id"=>6, "arch"=>"x86_64", "enhancementErrata"=>0}
Image Details: {"outdatedPackages"=>0, "buildServerId"=>1000010003, "obsolete"=>false, "bugErrata"=>0, "installedPackages"=>0, "type"=>"dockerfile", "version"=>"Latest_simple", "storeLabel"=>"galaxy-registry", "revision"=>0, "securityErrata"=>0, "buildStatus"=>"failed", "external"=>false, "profileLabel"=>"suse_simple", "name"=>"suse_simple", "checksum"=>"", "files"=>[], "id"=>6, "arch"=>"x86_64", "enhancementErrata"=>0}
unknown error - image build failed. (SystemCallError)
./features/step_definitions/docker_steps.rb:55:in `block (2 levels) in (top (required))'
./features/support/commonlib.rb:106:in `block in repeat_until_timeout'
./features/support/commonlib.rb:95:in `repeat_until_timeout'
./features/step_definitions/docker_steps.rb:41:in `/^I wait at most (\d+) seconds until image "([^"]*)" with version "([^"]*)" is built successfully via API$/'
features/secondary/buildhost_docker_build_image.feature:130:in `I wait at most 900 seconds until image "suse_simple" with version "Latest_simple" is built successfully via API'
21:48:26:000 - 21:48:48:000 | Current URL: https://uyuni-master-server.sumaci.aws/rhn/manager/cm/images

Image Details: {"outdatedPackages"=>0, "buildServerId"=>1000010003, "obsolete"=>false, "bugErrata"=>0, "installedPackages"=>0, "type"=>"dockerfile", "version"=>"Latest_simple", "storeLabel"=>"galaxy-registry", "revision"=>0, "securityErrata"=>0, "buildStatus"=>"failed", "external"=>false, "profileLabel"=>"suse_simple", "name"=>"suse_simple", "checksum"=>"", "files"=>[], "id"=>6, "arch"=>"x86_64", "enhancementErrata"=>0}
the list of image packages is empty (ScriptError)
./features/step_definitions/docker_steps.rb:143:in `/^the list of packages of image "([^"]*)" with version "([^"]*)" is not empty$/'
features/secondary/buildhost_docker_build_image.feature:136:in `the list of packages of image "suse_simple" with version "Latest_simple" is not empty'
21:49:03:000 - 21:49:03:000 | Current URL: https://uyuni-master-server.sumaci.aws/rhn/manager/cm/images

Image Details: {"outdatedPackages"=>0, "buildServerId"=>1000010003, "obsolete"=>false, "bugErrata"=>0, "installedPackages"=>0, "type"=>"dockerfile", "version"=>"Latest_key-activation1", "storeLabel"=>"galaxy-registry", "revision"=>0, "securityErrata"=>0, "buildStatus"=>"picked up", "external"=>false, "profileLabel"=>"suse_key", "name"=>"suse_key", "checksum"=>"", "files"=>[], "id"=>7, "arch"=>"x86_64", "enhancementErrata"=>0}
Image Details: {"outdatedPackages"=>0, "buildServerId"=>1000010003, "obsolete"=>false, "bugErrata"=>0, "installedPackages"=>0, "type"=>"dockerfile", "version"=>"Latest_key-activation1", "storeLabel"=>"galaxy-registry", "revision"=>0, "securityErrata"=>0, "buildStatus"=>"picked up", "external"=>false, "profileLabel"=>"suse_key", "name"=>"suse_key", "checksum"=>"", "files"=>[], "id"=>7, "arch"=>"x86_64", "enhancementErrata"=>0}
Image Details: {"outdatedPackages"=>0, "buildServerId"=>1000010003, "obsolete"=>false, "bugErrata"=>0, "installedPackages"=>0, "type"=>"dockerfile", "version"=>"Latest_key-activation1", "storeLabel"=>"galaxy-registry", "revision"=>0, "securityErrata"=>0, "buildStatus"=>"picked up", "external"=>false, "profileLabel"=>"suse_key", "name"=>"suse_key", "checksum"=>"", "files"=>[], "id"=>7, "arch"=>"x86_64", "enhancementErrata"=>0}
Image Details: {"outdatedPackages"=>0, "buildServerId"=>1000010003, "obsolete"=>false, "bugErrata"=>0, "installedPackages"=>0, "type"=>"dockerfile", "version"=>"Latest_key-activation1", "storeLabel"=>"galaxy-registry", "revision"=>0, "securityErrata"=>0, "buildStatus"=>"picked up", "external"=>false, "profileLabel"=>"suse_key", "name"=>"suse_key", "checksum"=>"", "files"=>[], "id"=>7, "arch"=>"x86_64", "enhancementErrata"=>0}
Image Details: {"outdatedPackages"=>0, "buildServerId"=>1000010003, "obsolete"=>false, "bugErrata"=>0, "installedPackages"=>0, "type"=>"dockerfile", "version"=>"Latest_key-activation1", "storeLabel"=>"galaxy-registry", "revision"=>0, "securityErrata"=>0, "buildStatus"=>"failed", "external"=>false, "profileLabel"=>"suse_key", "name"=>"suse_key", "checksum"=>"", "files"=>[], "id"=>7, "arch"=>"x86_64", "enhancementErrata"=>0}
unknown error - image build failed. (SystemCallError)
./features/step_definitions/docker_steps.rb:55:in `block (2 levels) in (top (required))'
./features/support/commonlib.rb:106:in `block in repeat_until_timeout'
./features/support/commonlib.rb:95:in `repeat_until_timeout'
./features/step_definitions/docker_steps.rb:41:in `/^I wait at most (\d+) seconds until image "([^"]*)" with version "([^"]*)" is built successfully via API$/'
features/secondary/buildhost_docker_build_image.feature:141:in `I wait at most 900 seconds until image "suse_key" with version "Latest_key-activation1" is built successfully via API'
21:49:18:000 - 21:49:46:000 | Current URL: https://uyuni-master-server.sumaci.aws/rhn/manager/cm/images

Image Details: {"outdatedPackages"=>0, "buildServerId"=>1000010003, "obsolete"=>false, "bugErrata"=>0, "installedPackages"=>0, "type"=>"dockerfile", "version"=>"Latest_key-activation1", "storeLabel"=>"galaxy-registry", "revision"=>0, "securityErrata"=>0, "buildStatus"=>"failed", "external"=>false, "profileLabel"=>"suse_key", "name"=>"suse_key", "checksum"=>"", "files"=>[], "id"=>7, "arch"=>"x86_64", "enhancementErrata"=>0}
the list of image packages is empty (ScriptError)
./features/step_definitions/docker_steps.rb:143:in `/^the list of packages of image "([^"]*)" with version "([^"]*)" is not empty$/'
features/secondary/buildhost_docker_build_image.feature:147:in `the list of packages of image "suse_key" with version "Latest_key-activation1" is not empty'
21:50:01:000 - 21:50:01:000 | Current URL: https://uyuni-master-server.sumaci.aws/rhn/manager/cm/images

Image Details: {"outdatedPackages"=>0, "buildServerId"=>1000010003, "obsolete"=>false, "bugErrata"=>0, "installedPackages"=>0, "type"=>"dockerfile", "inspectStatus"=>"picked up", "version"=>"GUI_BUILT_IMAGE", "storeLabel"=>"galaxy-registry", "revision"=>1, "securityErrata"=>0, "buildStatus"=>"completed", "external"=>false, "profileLabel"=>"suse_real_key", "name"=>"suse_real_key", "checksum"=>"", "files"=>[], "id"=>8, "arch"=>"x86_64", "enhancementErrata"=>0}
List of images: [{"external"=>false, "name"=>"suse_key", "checksum"=>"", "obsolete"=>false, "id"=>1, "arch"=>"x86_64-redhat-linux", "type"=>"dockerfile", "version"=>"latest", "storeLabel"=>"galaxy-registry", "revision"=>0}, {"external"=>false, "name"=>"suse_simple", "checksum"=>"", "obsolete"=>false, "id"=>2, "arch"=>"x86_64-redhat-linux", "type"=>"dockerfile", "version"=>"latest", "storeLabel"=>"galaxy-registry", "revision"=>0}, {"external"=>false, "name"=>"suse_real_key", "checksum"=>"60bbc88afbb8e6cf9ec3753964c59fa901aed554f21d24c130ddd3f7814b4364", "obsolete"=>false, "id"=>3, "arch"=>"x86_64-redhat-linux", "type"=>"dockerfile", "version"=>"latest", "storeLabel"=>"galaxy-registry", "revision"=>1}, {"external"=>false, "name"=>"suse_simple", "checksum"=>"", "obsolete"=>false, "id"=>6, "arch"=>"x86_64-redhat-linux", "type"=>"dockerfile", "version"=>"Latest_simple", "storeLabel"=>"galaxy-registry", "revision"=>0}, {"external"=>false, "name"=>"suse_key", "checksum"=>"", "obsolete"=>false, "id"=>7, "arch"=>"x86_64-redhat-linux", "type"=>"dockerfile", "version"=>"Latest_key-activation1", "storeLabel"=>"galaxy-registry", "revision"=>0}, {"external"=>false, "name"=>"suse_real_key", "checksum"=>"", "obsolete"=>false, "id"=>8, "arch"=>"x86_64-redhat-linux", "type"=>"dockerfile", "version"=>"GUI_BUILT_IMAGE", "storeLabel"=>"galaxy-registry", "revision"=>1}]
Image Details: {"outdatedPackages"=>0, "buildServerId"=>1000010003, "obsolete"=>false, "bugErrata"=>0, "installedPackages"=>0, "type"=>"dockerfile", "inspectStatus"=>"picked up", "version"=>"GUI_BUILT_IMAGE", "storeLabel"=>"galaxy-registry", "revision"=>1, "securityErrata"=>0, "buildStatus"=>"completed", "external"=>false, "profileLabel"=>"suse_real_key", "name"=>"suse_real_key", "checksum"=>"", "files"=>[], "id"=>8, "arch"=>"x86_64", "enhancementErrata"=>0}
Image Details: {"outdatedPackages"=>0, "buildServerId"=>1000010003, "obsolete"=>false, "bugErrata"=>0, "installedPackages"=>0, "type"=>"dockerfile", "inspectStatus"=>"picked up", "version"=>"GUI_BUILT_IMAGE", "storeLabel"=>"galaxy-registry", "revision"=>1, "securityErrata"=>0, "buildStatus"=>"completed", "external"=>false, "profileLabel"=>"suse_real_key", "name"=>"suse_real_key", "checksum"=>"", "files"=>[], "id"=>8, "arch"=>"x86_64", "enhancementErrata"=>0}
Image Details: {"outdatedPackages"=>0, "buildServerId"=>1000010003, "obsolete"=>false, "bugErrata"=>0, "installedPackages"=>0, "type"=>"dockerfile", "inspectStatus"=>"picked up", "version"=>"GUI_BUILT_IMAGE", "storeLabel"=>"galaxy-registry", "revision"=>1, "securityErrata"=>0, "buildStatus"=>"completed", "external"=>false, "profileLabel"=>"suse_real_key", "name"=>"suse_real_key", "checksum"=>"", "files"=>[], "id"=>8, "arch"=>"x86_64", "enhancementErrata"=>0}
Image Details: {"outdatedPackages"=>0, "buildServerId"=>1000010003, "obsolete"=>false, "bugErrata"=>0, "installedPackages"=>0, "type"=>"dockerfile", "inspectStatus"=>"picked up", "version"=>"GUI_BUILT_IMAGE", "storeLabel"=>"galaxy-registry", "revision"=>1, "securityErrata"=>0, "buildStatus"=>"completed", "external"=>false, "profileLabel"=>"suse_real_key", "name"=>"suse_real_key", "checksum"=>"", "files"=>[], "id"=>8, "arch"=>"x86_64", "enhancementErrata"=>0}
Image Details: {"outdatedPackages"=>0, "buildServerId"=>1000010003, "obsolete"=>false, "bugErrata"=>0, "installedPackages"=>0, "type"=>"dockerfile", "inspectStatus"=>"picked up", "version"=>"GUI_BUILT_IMAGE", "storeLabel"=>"galaxy-registry", "revision"=>1, "securityErrata"=>0, "buildStatus"=>"completed", "external"=>false, "profileLabel"=>"suse_real_key", "name"=>"suse_real_key", "checksum"=>"", "files"=>[], "id"=>8, "arch"=>"x86_64", "enhancementErrata"=>0}
Image Details: {"outdatedPackages"=>0, "buildServerId"=>1000010003, "obsolete"=>false, "bugErrata"=>0, "installedPackages"=>0, "type"=>"dockerfile", "inspectStatus"=>"picked up", "version"=>"GUI_BUILT_IMAGE", "storeLabel"=>"galaxy-registry", "revision"=>1, "securityErrata"=>0, "buildStatus"=>"completed", "external"=>false, "profileLabel"=>"suse_real_key", "name"=>"suse_real_key", "checksum"=>"", "files"=>[], "id"=>8, "arch"=>"x86_64", "enhancementErrata"=>0}
Image Details: {"outdatedPackages"=>0, "buildServerId"=>1000010003, "obsolete"=>false, "bugErrata"=>0, "installedPackages"=>0, "type"=>"dockerfile", "inspectStatus"=>"picked up", "version"=>"GUI_BUILT_IMAGE", "storeLabel"=>"galaxy-registry", "revision"=>1, "securityErrata"=>0, "buildStatus"=>"completed", "external"=>false, "profileLabel"=>"suse_real_key", "name"=>"suse_real_key", "checksum"=>"", "files"=>[], "id"=>8, "arch"=>"x86_64", "enhancementErrata"=>0}
Image Details: {"outdatedPackages"=>0, "buildServerId"=>1000010003, "obsolete"=>false, "bugErrata"=>0, "installedPackages"=>0, "type"=>"dockerfile", "inspectStatus"=>"picked up", "version"=>"GUI_BUILT_IMAGE", "storeLabel"=>"galaxy-registry", "revision"=>1, "securityErrata"=>0, "buildStatus"=>"completed", "external"=>false, "profileLabel"=>"suse_real_key", "name"=>"suse_real_key", "checksum"=>"", "files"=>[], "id"=>8, "arch"=>"x86_64", "enhancementErrata"=>0}
Image Details: {"outdatedPackages"=>0, "buildServerId"=>1000010003, "obsolete"=>false, "bugErrata"=>0, "installedPackages"=>0, "type"=>"dockerfile", "inspectStatus"=>"picked up", "version"=>"GUI_BUILT_IMAGE", "storeLabel"=>"galaxy-registry", "revision"=>1, "securityErrata"=>0, "buildStatus"=>"completed", "external"=>false, "profileLabel"=>"suse_real_key", "name"=>"suse_real_key", "checksum"=>"", "files"=>[], "id"=>8, "arch"=>"x86_64", "enhancementErrata"=>0}
Image Details: {"outdatedPackages"=>0, "buildServerId"=>1000010003, "obsolete"=>false, "bugErrata"=>0, "installedPackages"=>0, "type"=>"dockerfile", "inspectStatus"=>"picked up", "version"=>"GUI_BUILT_IMAGE", "storeLabel"=>"galaxy-registry", "revision"=>1, "securityErrata"=>0, "buildStatus"=>"completed", "external"=>false, "profileLabel"=>"suse_real_key", "name"=>"suse_real_key", "checksum"=>"", "files"=>[], "id"=>8, "arch"=>"x86_64", "enhancementErrata"=>0}
Image Details: {"outdatedPackages"=>0, "buildServerId"=>1000010003, "obsolete"=>false, "bugErrata"=>0, "installedPackages"=>0, "type"=>"dockerfile", "inspectStatus"=>"picked up", "version"=>"GUI_BUILT_IMAGE", "storeLabel"=>"galaxy-registry", "revision"=>1, "securityErrata"=>0, "buildStatus"=>"completed", "external"=>false, "profileLabel"=>"suse_real_key", "name"=>"suse_real_key", "checksum"=>"", "files"=>[], "id"=>8, "arch"=>"x86_64", "enhancementErrata"=>0}
Image Details: {"outdatedPackages"=>0, "buildServerId"=>1000010003, "obsolete"=>false, "bugErrata"=>0, "installedPackages"=>0, "type"=>"dockerfile", "inspectStatus"=>"picked up", "version"=>"GUI_BUILT_IMAGE", "storeLabel"=>"galaxy-registry", "revision"=>1, "securityErrata"=>0, "buildStatus"=>"completed", "external"=>false, "profileLabel"=>"suse_real_key", "name"=>"suse_real_key", "checksum"=>"", "files"=>[], "id"=>8, "arch"=>"x86_64", "enhancementErrata"=>0}
Image Details: {"outdatedPackages"=>0, "buildServerId"=>1000010003, "obsolete"=>false, "bugErrata"=>0, "installedPackages"=>0, "type"=>"dockerfile", "inspectStatus"=>"picked up", "version"=>"GUI_BUILT_IMAGE", "storeLabel"=>"galaxy-registry", "revision"=>1, "securityErrata"=>0, "buildStatus"=>"completed", "external"=>false, "profileLabel"=>"suse_real_key", "name"=>"suse_real_key", "checksum"=>"", "files"=>[], "id"=>8, "arch"=>"x86_64", "enhancementErrata"=>0}
Image Details: {"outdatedPackages"=>0, "buildServerId"=>1000010003, "obsolete"=>false, "bugErrata"=>0, "installedPackages"=>0, "type"=>"dockerfile", "inspectStatus"=>"picked up", "version"=>"GUI_BUILT_IMAGE", "storeLabel"=>"galaxy-registry", "revision"=>1, "securityErrata"=>0, "buildStatus"=>"completed", "external"=>false, "profileLabel"=>"suse_real_key", "name"=>"suse_real_key", "checksum"=>"", "files"=>[], "id"=>8, "arch"=>"x86_64", "enhancementErrata"=>0}
Image Details: {"outdatedPackages"=>0, "buildServerId"=>1000010003, "obsolete"=>false, "bugErrata"=>0, "installedPackages"=>160, "type"=>"dockerfile", "inspectStatus"=>"completed", "version"=>"GUI_BUILT_IMAGE", "storeLabel"=>"galaxy-registry", "revision"=>1, "securityErrata"=>0, "buildStatus"=>"completed", "external"=>false, "profileLabel"=>"suse_real_key", "name"=>"suse_real_key", "checksum"=>"c34a70a94adaee621cf239182af4c1fef86bc4898cab97e6a9124d3ae1002cc5", "files"=>[], "id"=>8, "arch"=>"x86_64", "enhancementErrata"=>0}
Image Details: {"outdatedPackages"=>0, "buildServerId"=>1000010003, "obsolete"=>false, "bugErrata"=>0, "installedPackages"=>0, "type"=>"dockerfile", "inspectStatus"=>"picked up", "version"=>"GUI_DOCKERADMIN", "storeLabel"=>"galaxy-registry", "revision"=>1, "securityErrata"=>0, "buildStatus"=>"completed", "external"=>false, "profileLabel"=>"suse_real_key", "name"=>"suse_real_key", "checksum"=>"", "files"=>[], "id"=>9, "arch"=>"x86_64", "enhancementErrata"=>0}
List of images: [{"external"=>false, "name"=>"suse_key", "checksum"=>"", "obsolete"=>false, "id"=>1, "arch"=>"x86_64-redhat-linux", "type"=>"dockerfile", "version"=>"latest", "storeLabel"=>"galaxy-registry", "revision"=>0}, {"external"=>false, "name"=>"suse_simple", "checksum"=>"", "obsolete"=>false, "id"=>2, "arch"=>"x86_64-redhat-linux", "type"=>"dockerfile", "version"=>"latest", "storeLabel"=>"galaxy-registry", "revision"=>0}, {"external"=>false, "name"=>"suse_real_key", "checksum"=>"60bbc88afbb8e6cf9ec3753964c59fa901aed554f21d24c130ddd3f7814b4364", "obsolete"=>false, "id"=>3, "arch"=>"x86_64-redhat-linux", "type"=>"dockerfile", "version"=>"latest", "storeLabel"=>"galaxy-registry", "revision"=>1}, {"external"=>false, "name"=>"suse_simple", "checksum"=>"", "obsolete"=>false, "id"=>6, "arch"=>"x86_64-redhat-linux", "type"=>"dockerfile", "version"=>"Latest_simple", "storeLabel"=>"galaxy-registry", "revision"=>0}, {"external"=>false, "name"=>"suse_key", "checksum"=>"", "obsolete"=>false, "id"=>7, "arch"=>"x86_64-redhat-linux", "type"=>"dockerfile", "version"=>"Latest_key-activation1", "storeLabel"=>"galaxy-registry", "revision"=>0}, {"external"=>false, "name"=>"suse_real_key", "checksum"=>"c34a70a94adaee621cf239182af4c1fef86bc4898cab97e6a9124d3ae1002cc5", "obsolete"=>false, "id"=>8, "arch"=>"x86_64-redhat-linux", "type"=>"dockerfile", "version"=>"GUI_BUILT_IMAGE", "storeLabel"=>"galaxy-registry", "revision"=>1}, {"external"=>false, "name"=>"suse_real_key", "checksum"=>"", "obsolete"=>false, "id"=>9, "arch"=>"x86_64-redhat-linux", "type"=>"dockerfile", "version"=>"GUI_DOCKERADMIN", "storeLabel"=>"galaxy-registry", "revision"=>1}]
Image Details: {"outdatedPackages"=>0, "buildServerId"=>1000010003, "obsolete"=>false, "bugErrata"=>0, "installedPackages"=>0, "type"=>"dockerfile", "inspectStatus"=>"picked up", "version"=>"GUI_DOCKERADMIN", "storeLabel"=>"galaxy-registry", "revision"=>1, "securityErrata"=>0, "buildStatus"=>"completed", "external"=>false, "profileLabel"=>"suse_real_key", "name"=>"suse_real_key", "checksum"=>"", "files"=>[], "id"=>9, "arch"=>"x86_64", "enhancementErrata"=>0}
Image Details: {"outdatedPackages"=>0, "buildServerId"=>1000010003, "obsolete"=>false, "bugErrata"=>0, "installedPackages"=>0, "type"=>"dockerfile", "inspectStatus"=>"picked up", "version"=>"GUI_DOCKERADMIN", "storeLabel"=>"galaxy-registry", "revision"=>1, "securityErrata"=>0, "buildStatus"=>"completed", "external"=>false, "profileLabel"=>"suse_real_key", "name"=>"suse_real_key", "checksum"=>"", "files"=>[], "id"=>9, "arch"=>"x86_64", "enhancementErrata"=>0}
Image Details: {"outdatedPackages"=>0, "buildServerId"=>1000010003, "obsolete"=>false, "bugErrata"=>0, "installedPackages"=>0, "type"=>"dockerfile", "inspectStatus"=>"picked up", "version"=>"GUI_DOCKERADMIN", "storeLabel"=>"galaxy-registry", "revision"=>1, "securityErrata"=>0, "buildStatus"=>"completed", "external"=>false, "profileLabel"=>"suse_real_key", "name"=>"suse_real_key", "checksum"=>"", "files"=>[], "id"=>9, "arch"=>"x86_64", "enhancementErrata"=>0}
Image Details: {"outdatedPackages"=>0, "buildServerId"=>1000010003, "obsolete"=>false, "bugErrata"=>0, "installedPackages"=>0, "type"=>"dockerfile", "inspectStatus"=>"picked up", "version"=>"GUI_DOCKERADMIN", "storeLabel"=>"galaxy-registry", "revision"=>1, "securityErrata"=>0, "buildStatus"=>"completed", "external"=>false, "profileLabel"=>"suse_real_key", "name"=>"suse_real_key", "checksum"=>"", "files"=>[], "id"=>9, "arch"=>"x86_64", "enhancementErrata"=>0}
Image Details: {"outdatedPackages"=>0, "buildServerId"=>1000010003, "obsolete"=>false, "bugErrata"=>0, "installedPackages"=>0, "type"=>"dockerfile", "inspectStatus"=>"picked up", "version"=>"GUI_DOCKERADMIN", "storeLabel"=>"galaxy-registry", "revision"=>1, "securityErrata"=>0, "buildStatus"=>"completed", "external"=>false, "profileLabel"=>"suse_real_key", "name"=>"suse_real_key", "checksum"=>"", "files"=>[], "id"=>9, "arch"=>"x86_64", "enhancementErrata"=>0}
Image Details: {"outdatedPackages"=>0, "buildServerId"=>1000010003, "obsolete"=>false, "bugErrata"=>0, "installedPackages"=>0, "type"=>"dockerfile", "inspectStatus"=>"picked up", "version"=>"GUI_DOCKERADMIN", "storeLabel"=>"galaxy-registry", "revision"=>1, "securityErrata"=>0, "buildStatus"=>"completed", "external"=>false, "profileLabel"=>"suse_real_key", "name"=>"suse_real_key", "checksum"=>"", "files"=>[], "id"=>9, "arch"=>"x86_64", "enhancementErrata"=>0}
Image Details: {"outdatedPackages"=>0, "buildServerId"=>1000010003, "obsolete"=>false, "bugErrata"=>0, "installedPackages"=>0, "type"=>"dockerfile", "inspectStatus"=>"picked up", "version"=>"GUI_DOCKERADMIN", "storeLabel"=>"galaxy-registry", "revision"=>1, "securityErrata"=>0, "buildStatus"=>"completed", "external"=>false, "profileLabel"=>"suse_real_key", "name"=>"suse_real_key", "checksum"=>"", "files"=>[], "id"=>9, "arch"=>"x86_64", "enhancementErrata"=>0}
Image Details: {"outdatedPackages"=>0, "buildServerId"=>1000010003, "obsolete"=>false, "bugErrata"=>0, "installedPackages"=>0, "type"=>"dockerfile", "inspectStatus"=>"picked up", "version"=>"GUI_DOCKERADMIN", "storeLabel"=>"galaxy-registry", "revision"=>1, "securityErrata"=>0, "buildStatus"=>"completed", "external"=>false, "profileLabel"=>"suse_real_key", "name"=>"suse_real_key", "checksum"=>"", "files"=>[], "id"=>9, "arch"=>"x86_64", "enhancementErrata"=>0}
Image Details: {"outdatedPackages"=>0, "buildServerId"=>1000010003, "obsolete"=>false, "bugErrata"=>0, "installedPackages"=>0, "type"=>"dockerfile", "inspectStatus"=>"picked up", "version"=>"GUI_DOCKERADMIN", "storeLabel"=>"galaxy-registry", "revision"=>1, "securityErrata"=>0, "buildStatus"=>"completed", "external"=>false, "profileLabel"=>"suse_real_key", "name"=>"suse_real_key", "checksum"=>"", "files"=>[], "id"=>9, "arch"=>"x86_64", "enhancementErrata"=>0}
Image Details: {"outdatedPackages"=>0, "buildServerId"=>1000010003, "obsolete"=>false, "bugErrata"=>0, "installedPackages"=>0, "type"=>"dockerfile", "inspectStatus"=>"picked up", "version"=>"GUI_DOCKERADMIN", "storeLabel"=>"galaxy-registry", "revision"=>1, "securityErrata"=>0, "buildStatus"=>"completed", "external"=>false, "profileLabel"=>"suse_real_key", "name"=>"suse_real_key", "checksum"=>"", "files"=>[], "id"=>9, "arch"=>"x86_64", "enhancementErrata"=>0}
Image Details: {"outdatedPackages"=>0, "buildServerId"=>1000010003, "obsolete"=>false, "bugErrata"=>0, "installedPackages"=>0, "type"=>"dockerfile", "inspectStatus"=>"picked up", "version"=>"GUI_DOCKERADMIN", "storeLabel"=>"galaxy-registry", "revision"=>1, "securityErrata"=>0, "buildStatus"=>"completed", "external"=>false, "profileLabel"=>"suse_real_key", "name"=>"suse_real_key", "checksum"=>"", "files"=>[], "id"=>9, "arch"=>"x86_64", "enhancementErrata"=>0}
Image Details: {"outdatedPackages"=>0, "buildServerId"=>1000010003, "obsolete"=>false, "bugErrata"=>0, "installedPackages"=>0, "type"=>"dockerfile", "inspectStatus"=>"picked up", "version"=>"GUI_DOCKERADMIN", "storeLabel"=>"galaxy-registry", "revision"=>1, "securityErrata"=>0, "buildStatus"=>"completed", "external"=>false, "profileLabel"=>"suse_real_key", "name"=>"suse_real_key", "checksum"=>"", "files"=>[], "id"=>9, "arch"=>"x86_64", "enhancementErrata"=>0}
Image Details: {"outdatedPackages"=>0, "buildServerId"=>1000010003, "obsolete"=>false, "bugErrata"=>0, "installedPackages"=>0, "type"=>"dockerfile", "inspectStatus"=>"picked up", "version"=>"GUI_DOCKERADMIN", "storeLabel"=>"galaxy-registry", "revision"=>1, "securityErrata"=>0, "buildStatus"=>"completed", "external"=>false, "profileLabel"=>"suse_real_key", "name"=>"suse_real_key", "checksum"=>"", "files"=>[], "id"=>9, "arch"=>"x86_64", "enhancementErrata"=>0}
Image Details: {"outdatedPackages"=>0, "buildServerId"=>1000010003, "obsolete"=>false, "bugErrata"=>0, "installedPackages"=>0, "type"=>"dockerfile", "inspectStatus"=>"picked up", "version"=>"GUI_DOCKERADMIN", "storeLabel"=>"galaxy-registry", "revision"=>1, "securityErrata"=>0, "buildStatus"=>"completed", "external"=>false, "profileLabel"=>"suse_real_key", "name"=>"suse_real_key", "checksum"=>"", "files"=>[], "id"=>9, "arch"=>"x86_64", "enhancementErrata"=>0}
Image Details: {"outdatedPackages"=>0, "buildServerId"=>1000010003, "obsolete"=>false, "bugErrata"=>0, "installedPackages"=>160, "type"=>"dockerfile", "inspectStatus"=>"completed", "version"=>"GUI_DOCKERADMIN", "storeLabel"=>"galaxy-registry", "revision"=>1, "securityErrata"=>0, "buildStatus"=>"completed", "external"=>false, "profileLabel"=>"suse_real_key", "name"=>"suse_real_key", "checksum"=>"2bd86add484c1b6511220578f7ffbe737d884abf39685a87fc71b40549285d13", "files"=>[], "id"=>9, "arch"=>"x86_64", "enhancementErrata"=>0}
List of images: [{"external"=>false, "name"=>"auth_registry_profile", "checksum"=>"", "obsolete"=>false, "id"=>10, "arch"=>"x86_64-redhat-linux", "type"=>"dockerfile", "version"=>"latest", "storeLabel"=>"auth_registry", "revision"=>0}]
Image Details: {"outdatedPackages"=>0, "buildServerId"=>1000010003, "obsolete"=>false, "bugErrata"=>0, "installedPackages"=>0, "type"=>"dockerfile", "version"=>"latest", "storeLabel"=>"auth_registry", "revision"=>0, "securityErrata"=>0, "buildStatus"=>"picked up", "external"=>false, "profileLabel"=>"auth_registry_profile", "name"=>"auth_registry_profile", "checksum"=>"", "files"=>[], "id"=>10, "arch"=>"x86_64", "enhancementErrata"=>0}
Image Details: {"outdatedPackages"=>0, "buildServerId"=>1000010003, "obsolete"=>false, "bugErrata"=>0, "installedPackages"=>0, "type"=>"dockerfile", "version"=>"latest", "storeLabel"=>"auth_registry", "revision"=>0, "securityErrata"=>0, "buildStatus"=>"picked up", "external"=>false, "profileLabel"=>"auth_registry_profile", "name"=>"auth_registry_profile", "checksum"=>"", "files"=>[], "id"=>10, "arch"=>"x86_64", "enhancementErrata"=>0}
Image Details: {"outdatedPackages"=>0, "buildServerId"=>1000010003, "obsolete"=>false, "bugErrata"=>0, "installedPackages"=>0, "type"=>"dockerfile", "version"=>"latest", "storeLabel"=>"auth_registry", "revision"=>0, "securityErrata"=>0, "buildStatus"=>"failed", "external"=>false, "profileLabel"=>"auth_registry_profile", "name"=>"auth_registry_profile", "checksum"=>"", "files"=>[], "id"=>10, "arch"=>"x86_64", "enhancementErrata"=>0}
unknown error - image build failed. (SystemCallError)
./features/step_definitions/docker_steps.rb:55:in `block (2 levels) in (top (required))'
./features/support/commonlib.rb:106:in `block in repeat_until_timeout'
./features/support/commonlib.rb:95:in `repeat_until_timeout'
./features/step_definitions/docker_steps.rb:41:in `/^I wait at most (\d+) seconds until image "([^"]*)" with version "([^"]*)" is built successfully via API$/'
features/secondary/buildhost_docker_auth_registry.feature:45:in `I wait at most 900 seconds until image "auth_registry_profile" with version "latest" is built successfully via API'
21:58:25:000 - 21:58:49:000 | Current URL: https://uyuni-master-server.sumaci.aws/rhn/manager/cm/images
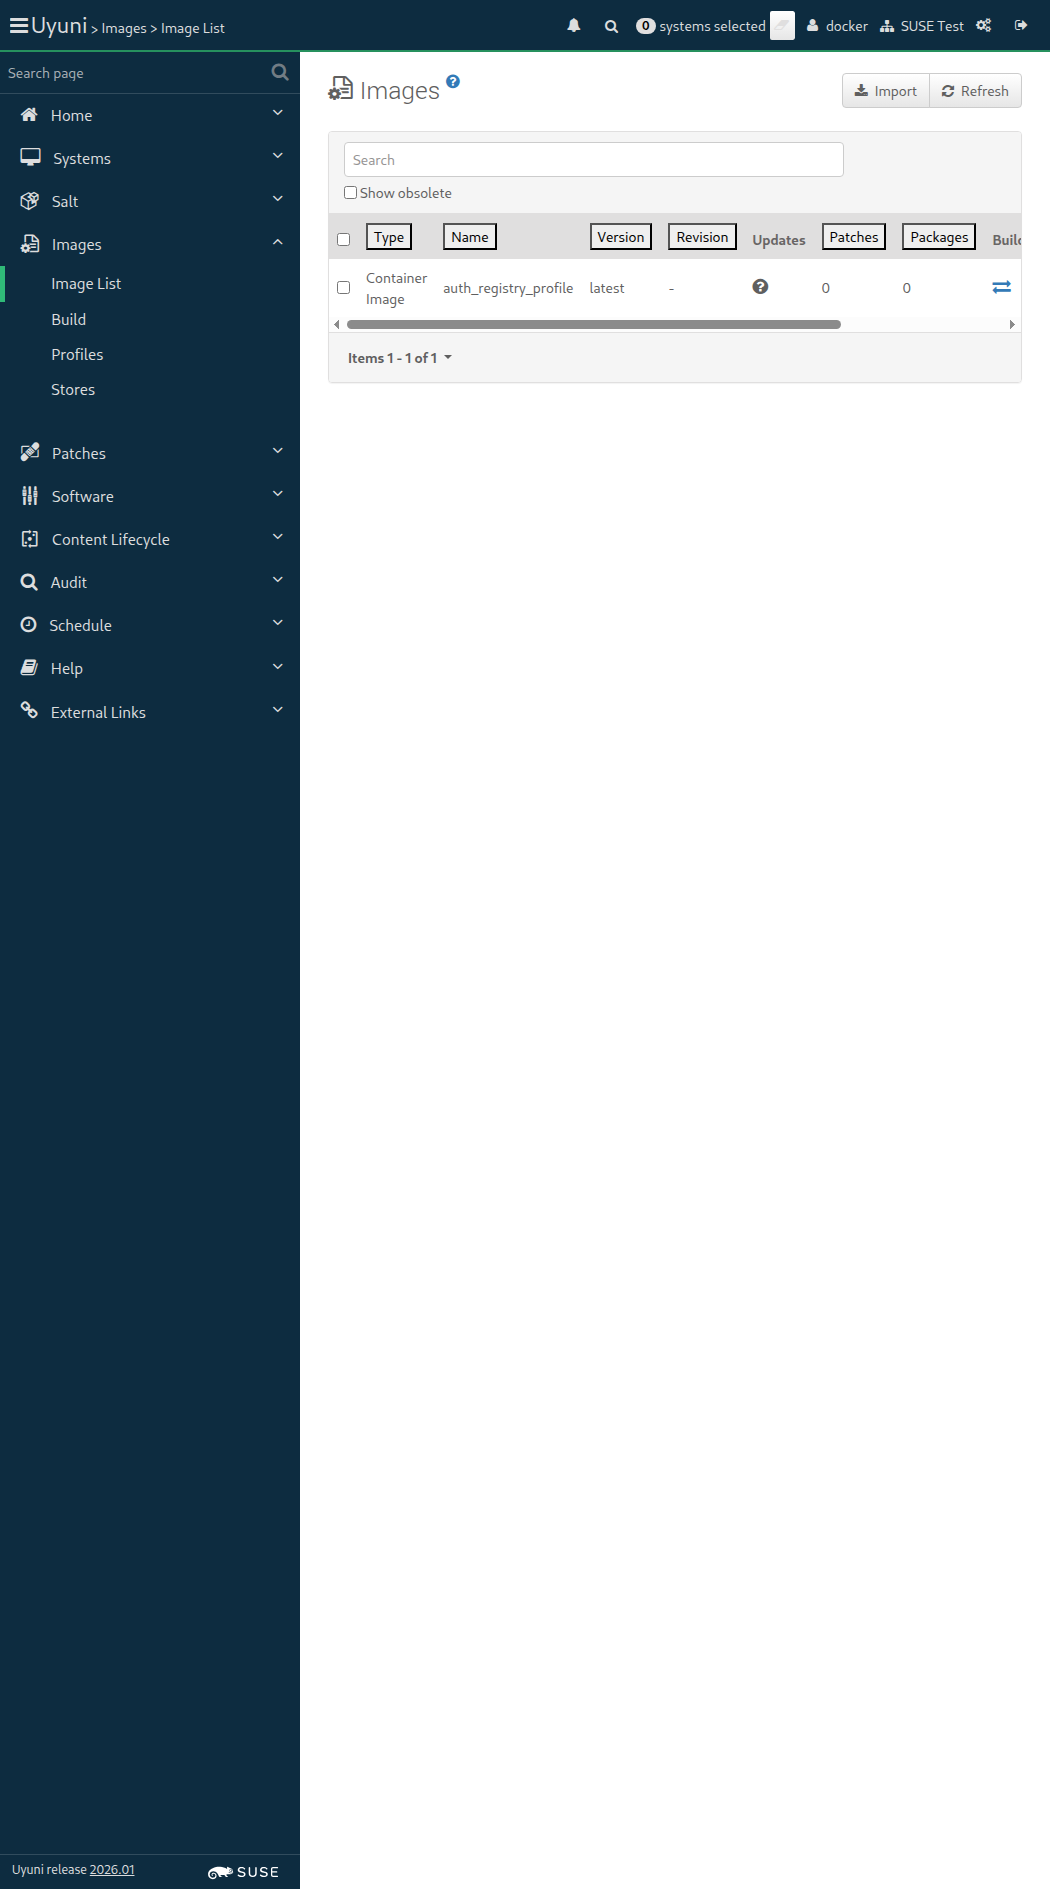
Image Details: {"outdatedPackages"=>0, "buildServerId"=>1000010003, "obsolete"=>false, "bugErrata"=>0, "installedPackages"=>0, "type"=>"dockerfile", "version"=>"latest", "storeLabel"=>"auth_registry", "revision"=>0, "securityErrata"=>0, "buildStatus"=>"failed", "external"=>false, "profileLabel"=>"auth_registry_profile", "name"=>"auth_registry_profile", "checksum"=>"", "files"=>[], "id"=>10, "arch"=>"x86_64", "enhancementErrata"=>0}
the list of image packages is empty (ScriptError)
./features/step_definitions/docker_steps.rb:143:in `/^the list of packages of image "([^"]*)" with version "([^"]*)" is not empty$/'
features/secondary/buildhost_docker_auth_registry.feature:53:in `the list of packages of image "auth_registry_profile" with version "latest" is not empty'
21:59:03:000 - 21:59:04:000 | Current URL: https://uyuni-master-server.sumaci.aws/rhn/manager/cm/images

IPv4 address: 172.16.3.8
IPv6 address: fe80::42d:a0ff:fe4e:c31
IPv4 address: 172.16.3.10
IPv6 address: fe80::4b5:25ff:fe7e:f1ab
IPv4 address: 172.16.3.11
IPv6 address: fe80::4bb:6bff:fe5d:af83
IPv4 address: 172.16.3.9
IPv6 address: fe80::416:31ff:fe64:aa3b
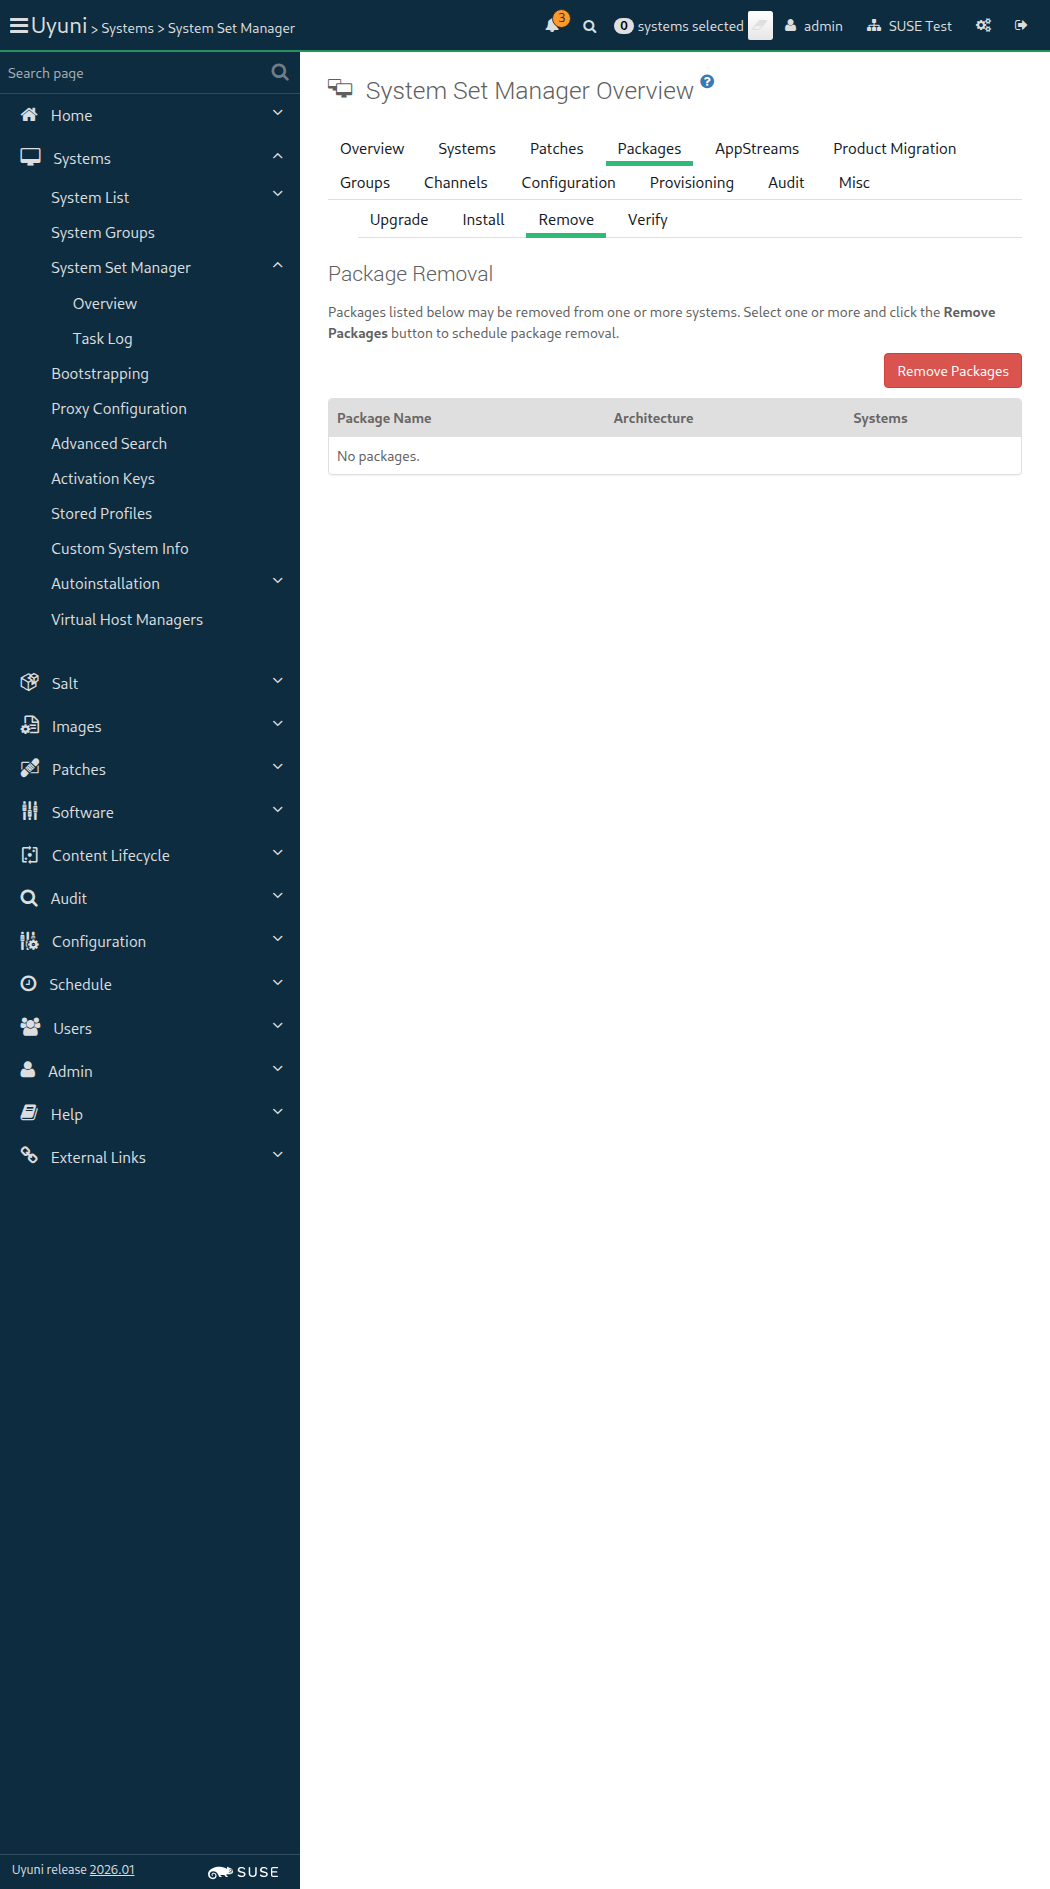
Unable to find css "input[placeholder='Filter by Package Name: ']" (Capybara::ElementNotFound)
./features/support/navigation_step_helper.rb:45:in `filter_by_package_name'
./features/step_definitions/navigation_steps.rb:925:in `/^I enter "([^"]*)" as the filtered package name$/'
features/secondary/allcli_system_group.feature:113:in `I enter "virgo-dummy" as the filtered package name'
22:03:42:000 - 22:03:54:000 | Current URL: https://uyuni-master-server.sumaci.aws/rhn/ssm/PackageRemove.do
execution expired (Timeout::Error)
./features/support/commonlib.rb:95:in `repeat_until_timeout'
./features/step_definitions/navigation_steps.rb:59:in `/^I wait until I see "([^"]*)" (text|regex), refreshing the page$/'
features/secondary/allcli_system_group.feature:126:in `I wait until I see "Fake-RPM-SUSE-Channel" text, refreshing the page'
undefined method `map' for nil (NoMethodError)
./features/step_definitions/navigation_steps.rb:594:in `/^I am authorized as "([^"]*)" with password "([^"]*)"$/'
./features/step_definitions/navigation_steps.rb:460:in `/^I am authorized for the "([^"]*)" section$/'
./features/step_definitions/navigation_steps.rb:420:in `rescue in block (2 levels) in (top (required))'
./features/step_definitions/navigation_steps.rb:413:in `block (2 levels) in (top (required))'
./features/step_definitions/navigation_steps.rb:406:in `each'
./features/step_definitions/navigation_steps.rb:406:in `each_with_index'
./features/step_definitions/navigation_steps.rb:406:in `/^I follow the left menu "([^"]*)"$/'
features/secondary/allcli_system_group.feature:139:in `I follow the left menu "Systems ) System Groups"'
undefined method `map' for nil (NoMethodError)
./features/step_definitions/navigation_steps.rb:594:in `/^I am authorized as "([^"]*)" with password "([^"]*)"$/'
./features/step_definitions/navigation_steps.rb:460:in `/^I am authorized for the "([^"]*)" section$/'
./features/step_definitions/navigation_steps.rb:420:in `rescue in block (2 levels) in (top (required))'
./features/step_definitions/navigation_steps.rb:413:in `block (2 levels) in (top (required))'
./features/step_definitions/navigation_steps.rb:406:in `each'
./features/step_definitions/navigation_steps.rb:406:in `each_with_index'
./features/step_definitions/navigation_steps.rb:406:in `/^I follow the left menu "([^"]*)"$/'
features/secondary/allcli_system_group.feature:149:in `I follow the left menu "Systems ) System Groups"'
execution expired (Timeout::Error)
./features/support/commonlib.rb:95:in `repeat_until_timeout'
./features/step_definitions/navigation_steps.rb:59:in `/^I wait until I see "([^"]*)" (text|regex), refreshing the page$/'
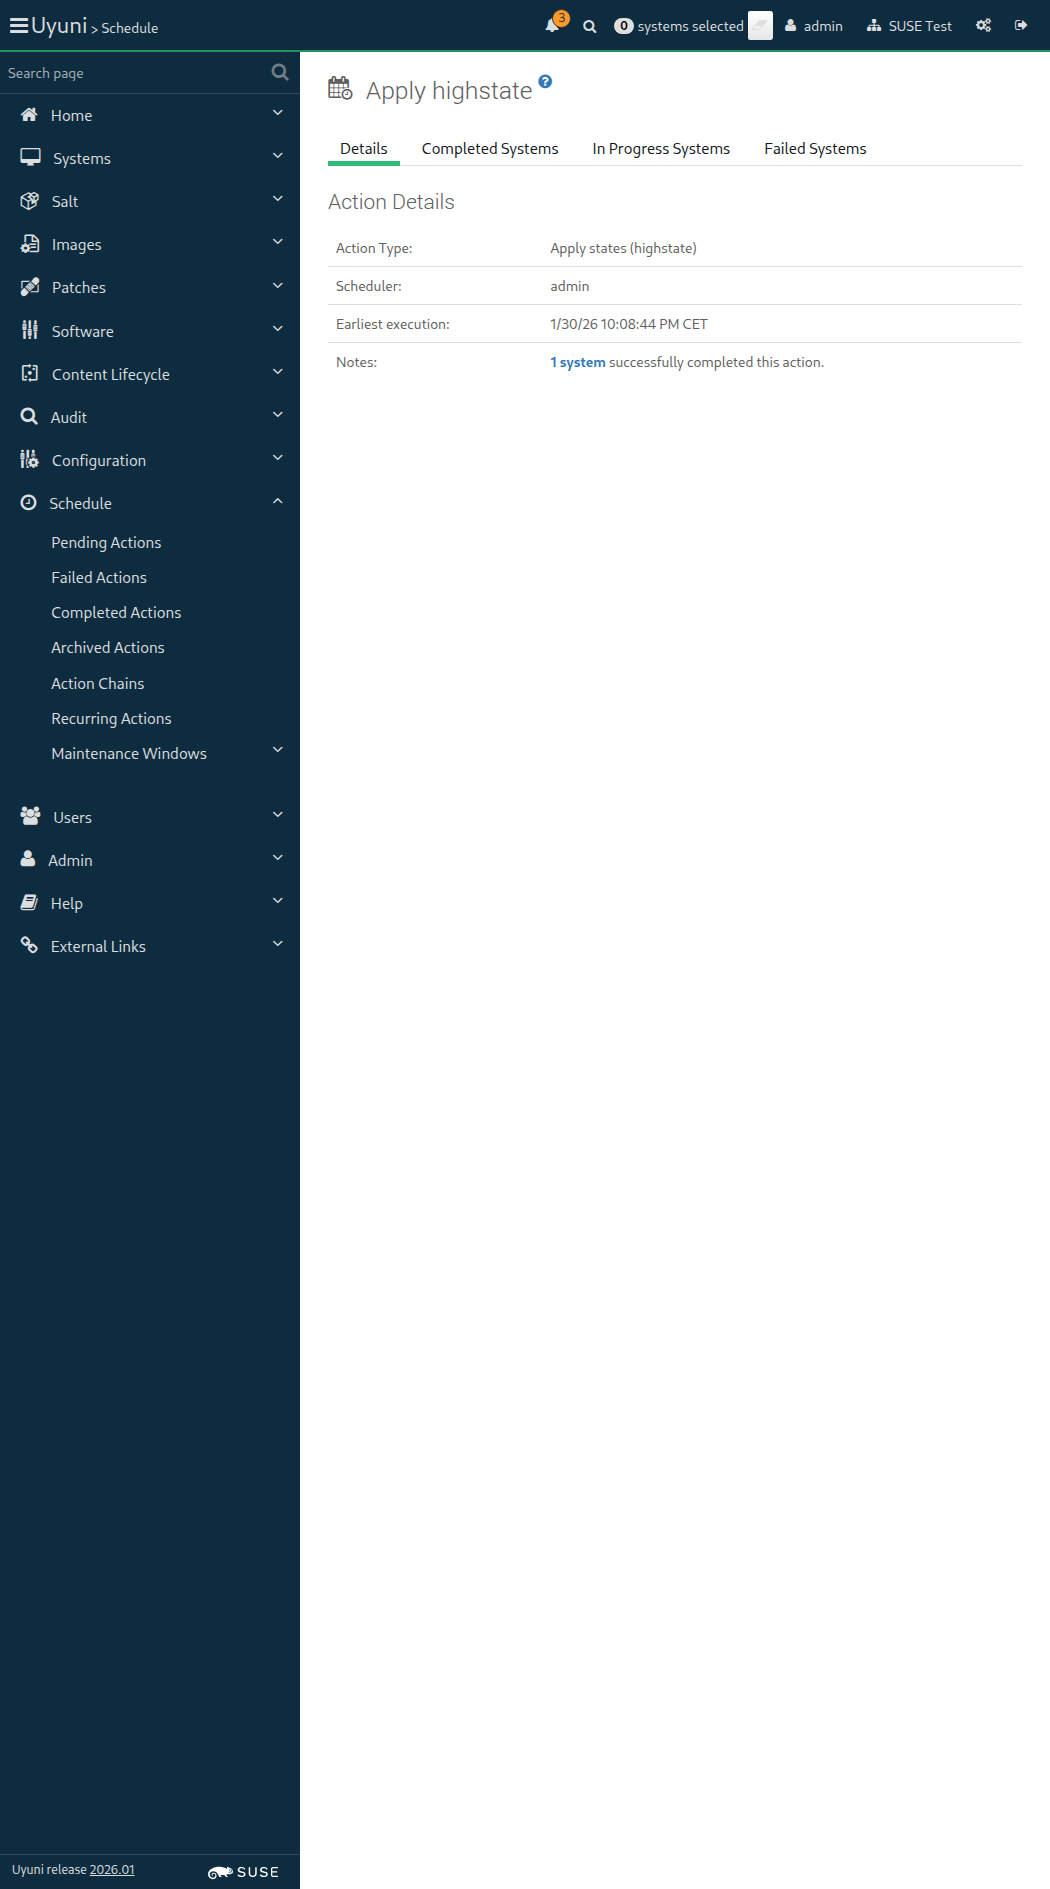
features/secondary/allcli_system_group.feature:182:in `I wait until I see "2 systems successfully completed this action." text, refreshing the page'
22:08:43:000 - 22:12:58:000 | Current URL: https://uyuni-master-server.sumaci.aws/rhn/schedule/ActionDetails.do?aid=329
[{"last_boot"=>"2026-01-30T19:04:49Z", "name"=>"uyuni-master-suse-minion.sumaci.aws", "id"=>1000010023, "last_checkin"=>"2026-01-30T21:13:14Z"}]
As an authorized user
I want to enable Prometheus exporters
Feature:Install a package and a patch on the SUSE SSH client via Salt through the UI 3m 56s 749ms 11
Scenario:Pre-requisite: ensure the errata cache is computed before patching Salt minion
18s 237ms
11
As an authorized user
I want to enable Prometheus exporters
Scenario:Enable tools_update_repo tools_pool_repo so the exporters packages are available
1s 384ms
1
Unable to find css "input[placeholder='Filter by Synopsis: ']" (Capybara::ElementNotFound)
./features/step_definitions/navigation_steps.rb:935:in `/^I enter "([^"]*)" as the filtered synopsis$/'
features/secondary/min_deblike_salt_install_with_staging.feature:66:in `I enter "virgo" as the filtered synopsis'
22:40:07:000 - 22:40:18:000 | Current URL: https://uyuni-master-server.sumaci.aws/rhn/systems/details/ErrataList.do?sid=1000010009&
Unable to find xpath "//table/tbody/tr[.//td[contains(.,'3456-1')]]//input[@type='checkbox']" (Capybara::ElementNotFound)
./features/support/navigation_step_helper.rb:32:in `toggle_checkbox_in_list'
./features/support/navigation_step_helper.rb:10:in `toggle_checkbox_in_package_list'
./features/step_definitions/navigation_steps.rb:1007:in `/^I (check|uncheck) "([^"]*)"(| last version) in the list$/'
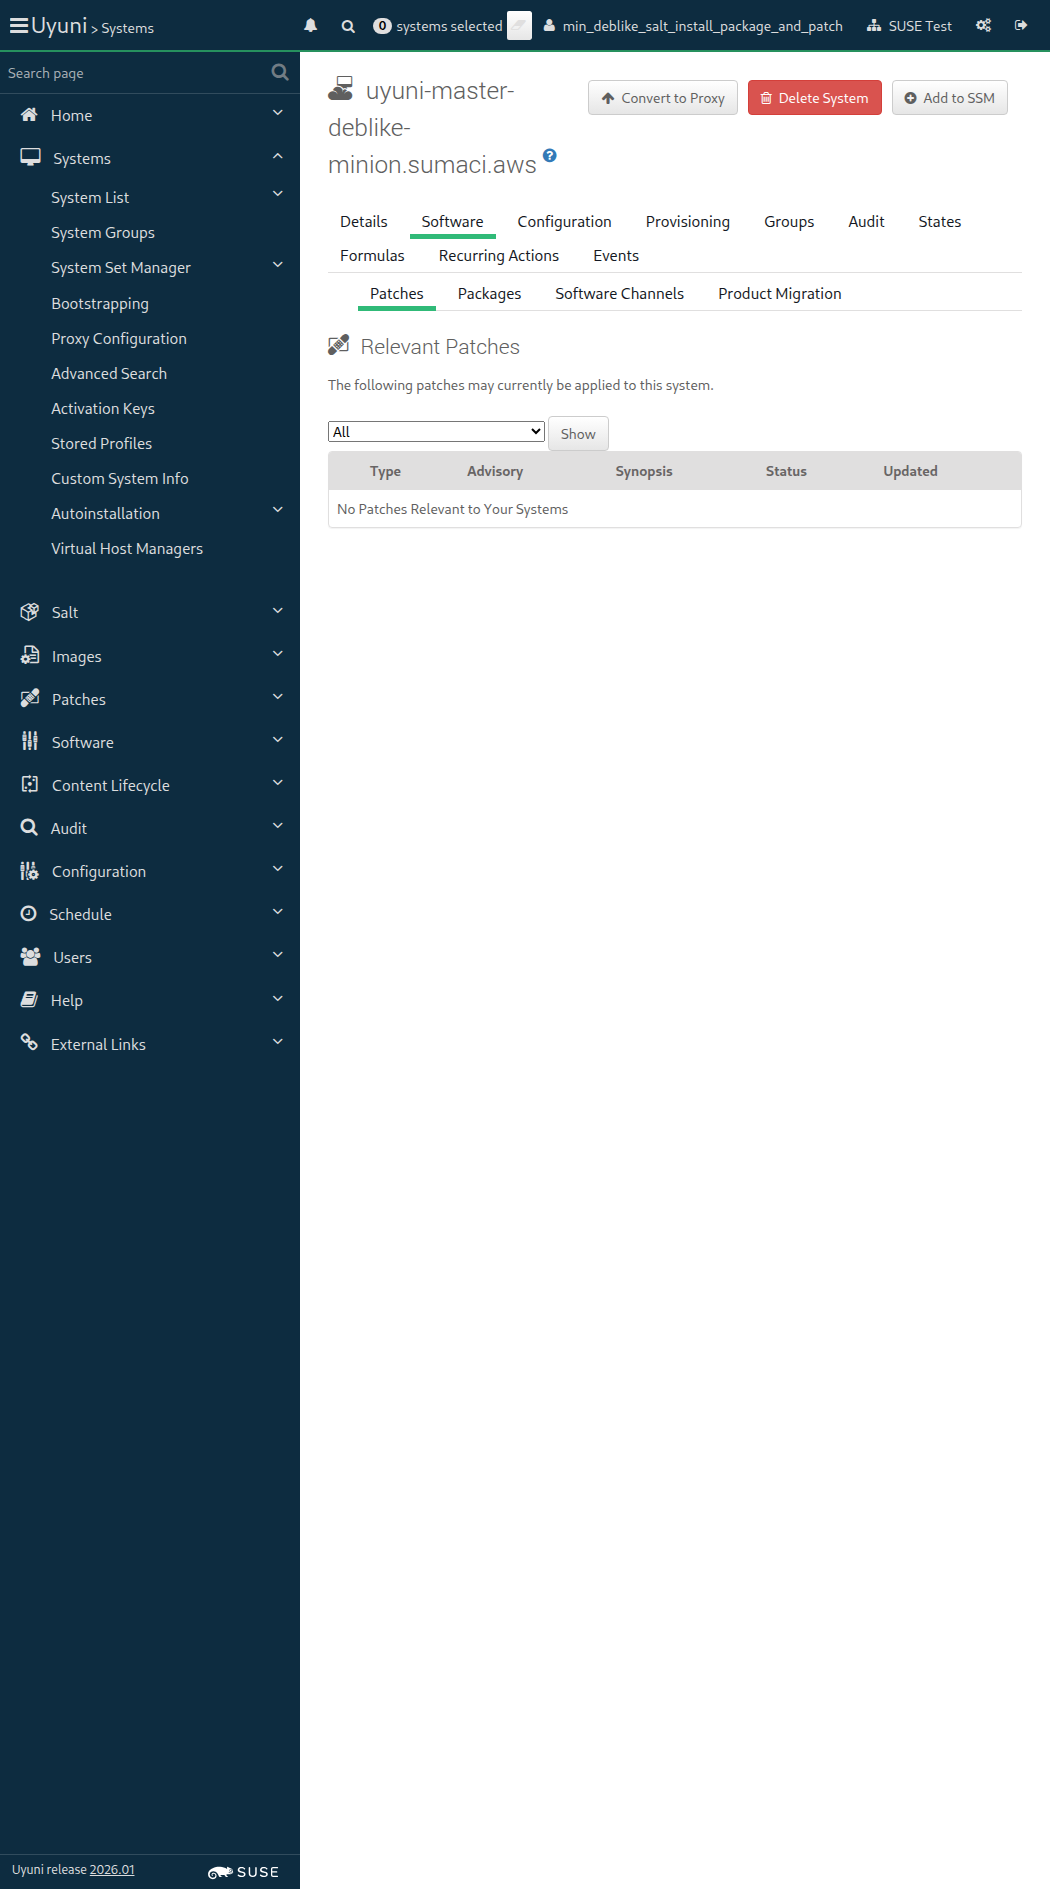
features/secondary/min_deblike_salt_install_package_and_patch.feature:34:in `I check "3456-1" in the list'
22:41:17:000 - 22:41:28:000 | Current URL: https://uyuni-master-server.sumaci.aws/rhn/systems/details/ErrataList.do?sid=1000010009&
As an authorized user
I want to avoid registration with invalid input parameters
As an authorized user
I want to be able to install and use salt formulas
As an authorized user
I want to be able to install and use Salt formulas
As an authorized user
I want to run an OpenSCAP scan on it
FAIL: zypper --non-interactive install -y openscap-utils openscap-content scap-security-guide returned status code = 104.
Output:
Loading repository data...
Reading installed packages...
'openscap-content' not found in package names. Trying capabilities.
'openscap-utils' not found in package names. Trying capabilities.
'scap-security-guide' not found in package names. Trying capabilities.
(ScriptError)
./features/support/remote_node.rb:169:in `run_local'
./features/support/remote_node.rb:117:in `run'
./features/step_definitions/command_steps.rb:993:in `/^I install packages? "([^"]*)" on this "([^"]*)"((?: without error control)?)$/'
./features/step_definitions/command_steps.rb:971:in `/^I (install|remove) OpenSCAP dependencies (on|from) "([^"]*)"$/'
features/secondary/min_salt_openscap_audit.feature:23:in `I install OpenSCAP dependencies on "sle_minion"'
22:51:16:000 - 22:51:18:000 | Current URL: https://uyuni-master-server.sumaci.aws/rhn/systems/details/Overview.do?sid=1000010023
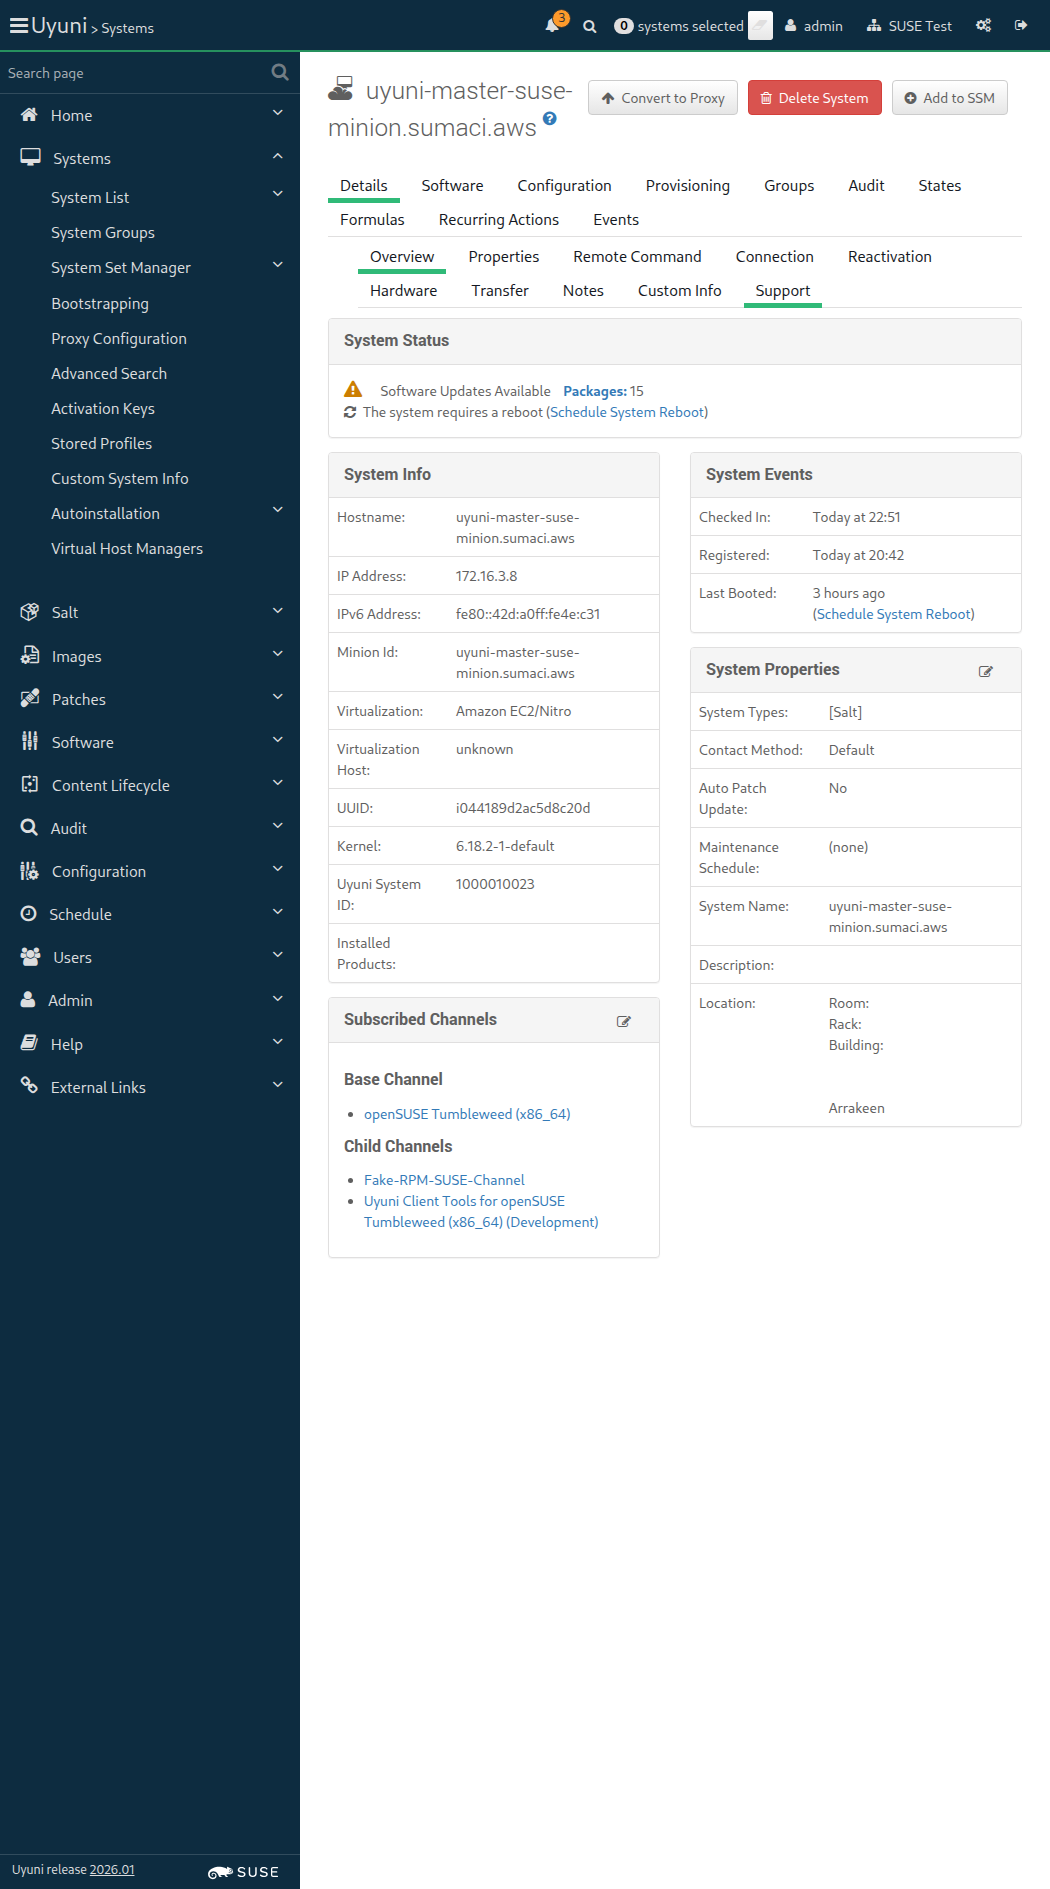
execution expired (Timeout::Error)
./features/support/commonlib.rb:95:in `repeat_until_timeout'
./features/step_definitions/navigation_steps.rb:69:in `/^I wait at most (\d+) seconds until I do not see "([^"]*)" text, refreshing the page$/'
features/secondary/min_salt_openscap_audit.feature:45:in `I wait at most 30 seconds until I do not see "This system does not yet have OpenSCAP scan capability." text, refreshing the page'
undefined method `map' for true (NoMethodError)
./features/support/commonlib.rb:198:in `click_link_and_wait'
./features/step_definitions/navigation_steps.rb:339:in `/^I follow "([^"]*)"$/'
./features/step_definitions/navigation_steps.rb:361:in `block (2 levels) in (top (required))'
./features/step_definitions/navigation_steps.rb:360:in `/^I follow "([^"]*)" in the (.+)$/'
features/secondary/min_salt_openscap_audit.feature:66:in `I follow "Audit" in the content area'
undefined method `map' for true (NoMethodError)
./features/support/commonlib.rb:198:in `click_link_and_wait'
./features/step_definitions/navigation_steps.rb:339:in `/^I follow "([^"]*)"$/'
./features/step_definitions/navigation_steps.rb:361:in `block (2 levels) in (top (required))'
./features/step_definitions/navigation_steps.rb:360:in `/^I follow "([^"]*)" in the (.+)$/'
features/secondary/min_salt_openscap_audit.feature:90:in `I follow "Audit" in the content area'
undefined method `map' for true (NoMethodError)
./features/support/commonlib.rb:198:in `click_link_and_wait'
./features/step_definitions/navigation_steps.rb:339:in `/^I follow "([^"]*)"$/'
./features/step_definitions/navigation_steps.rb:361:in `block (2 levels) in (top (required))'
./features/step_definitions/navigation_steps.rb:360:in `/^I follow "([^"]*)" in the (.+)$/'
features/secondary/min_salt_openscap_audit.feature:101:in `I follow "Audit" in the content area'
undefined method `map' for nil (NoMethodError)
./features/step_definitions/navigation_steps.rb:594:in `/^I am authorized as "([^"]*)" with password "([^"]*)"$/'
./features/step_definitions/navigation_steps.rb:460:in `/^I am authorized for the "([^"]*)" section$/'
./features/step_definitions/navigation_steps.rb:420:in `rescue in block (2 levels) in (top (required))'
./features/step_definitions/navigation_steps.rb:413:in `block (2 levels) in (top (required))'
./features/step_definitions/navigation_steps.rb:406:in `each'
./features/step_definitions/navigation_steps.rb:406:in `each_with_index'
./features/step_definitions/navigation_steps.rb:406:in `/^I follow the left menu "([^"]*)"$/'
features/secondary/min_salt_openscap_audit.feature:110:in `I follow the left menu "Admin ) Organizations"'
Unable to find button "Select All" that is not disabled (Capybara::ElementNotFound)
./features/support/commonlib.rb:184:in `click_button_and_wait'
./features/step_definitions/navigation_steps.rb:293:in `/^I click on "([^"]*)"$/'
features/secondary/min_salt_openscap_audit.feature:122:in `I click on "Select All"'
22:52:17:000 - 22:52:30:000 | Current URL: https://uyuni-master-server.sumaci.aws/rhn/systems/details/audit/ListScap.do?sid=1000010023&
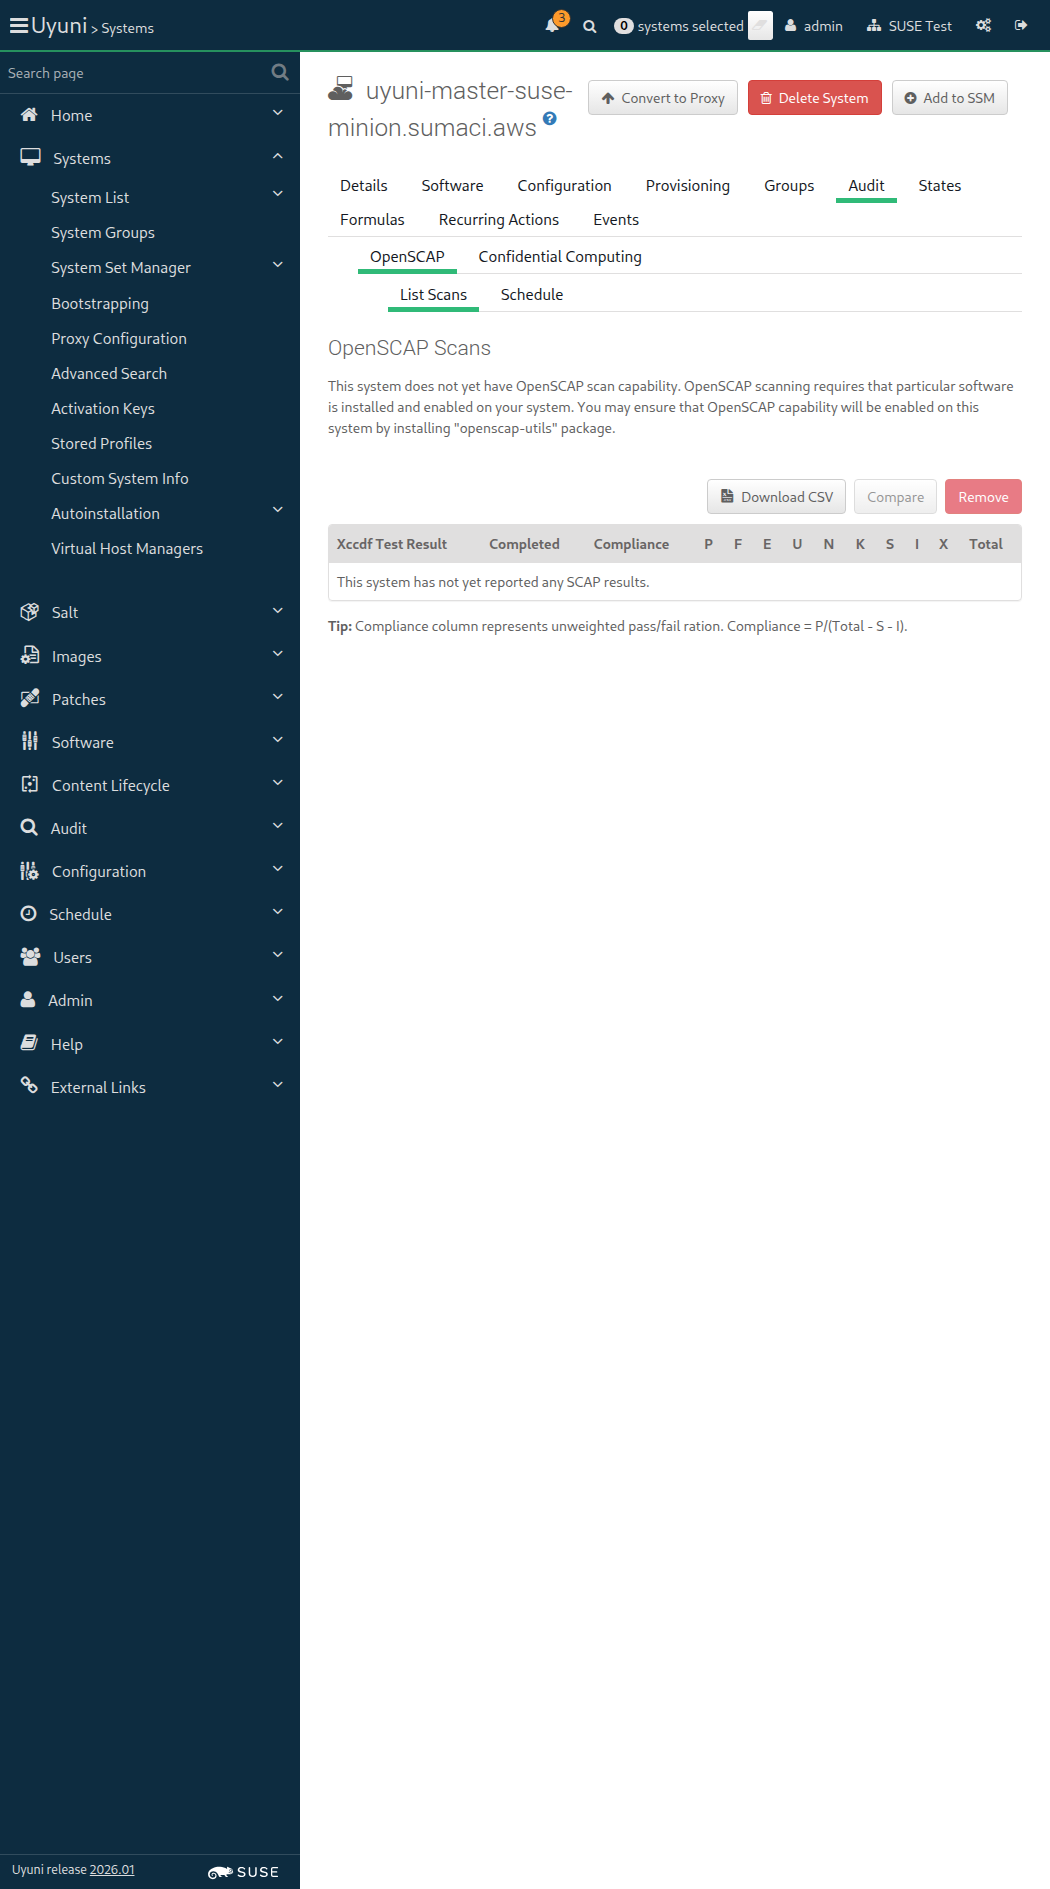
I want to see minion details and installed packages
I want to be able to use the state channels
As an authorized user
I want to enable Prometheus exporters
unknown error - Event failed (SystemCallError)
./features/step_definitions/navigation_steps.rb:96:in `block (2 levels) in (top (required))'
./features/support/commonlib.rb:106:in `block in repeat_until_timeout'
./features/support/commonlib.rb:95:in `repeat_until_timeout'
./features/step_definitions/navigation_steps.rb:88:in `/^I wait at most (\d+) seconds until the event is completed, refreshing the page$/'
./features/step_definitions/common_steps.rb:157:in `/^I wait (\d+) seconds until the event is picked up and (\d+) seconds until the event "([^"]*)" is completed$/'
./features/step_definitions/common_steps.rb:174:in `/^I wait at most (\d+) seconds until event "([^"]*)" is completed$/'
./features/step_definitions/common_steps.rb:151:in `/^I wait until event "([^"]*)" is completed$/'
features/secondary/min_monitoring.feature:51:in `I wait until event "Apply highstate scheduled" is completed'
22:57:55:000 - 22:58:55:000 | Current URL: https://uyuni-master-server.sumaci.aws/rhn/systems/details/history/Event.do?sid=1000010023&aid=403
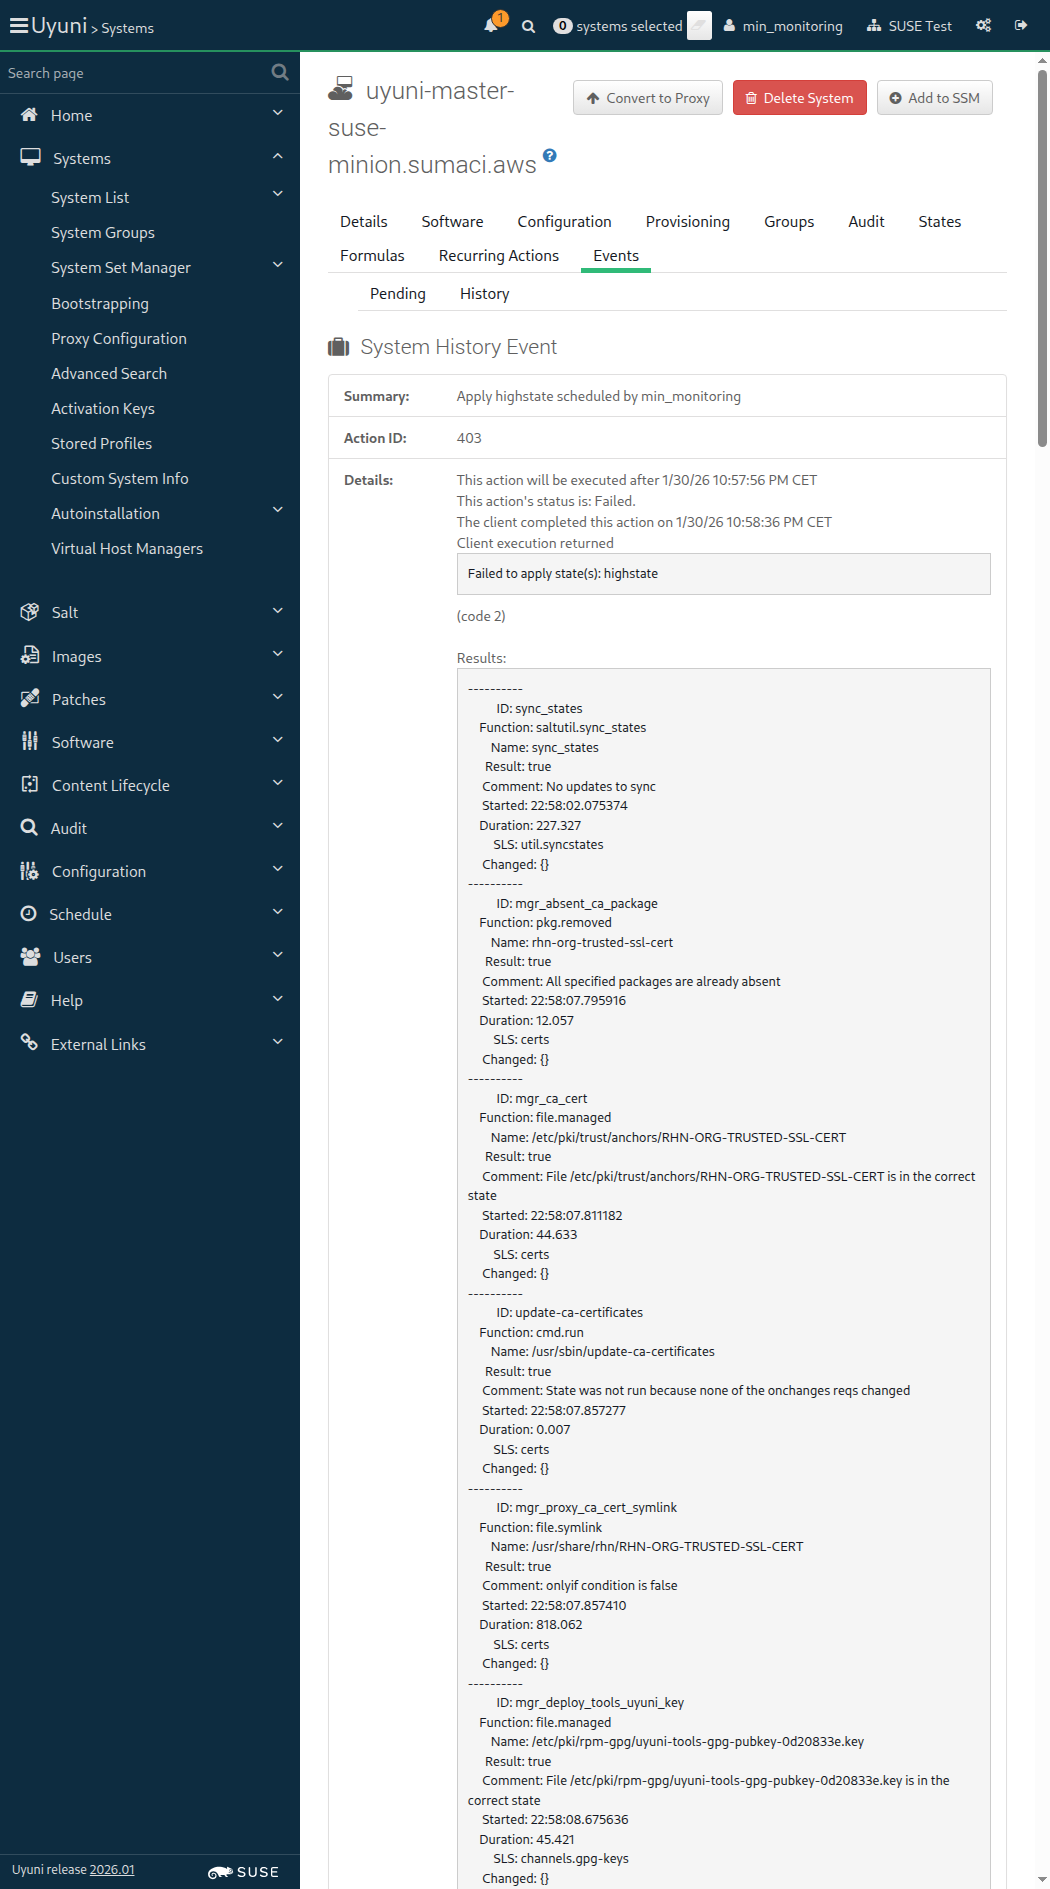
execution expired (Timeout::Error)
./features/support/commonlib.rb:95:in `repeat_until_timeout'
./features/support/remote_node.rb:202:in `run_until_ok'
./features/step_definitions/command_steps.rb:299:in `/^I wait until "([^"]*)" service is active on "([^"]*)"$/'
features/secondary/min_monitoring.feature:54:in `I wait until "prometheus" service is active on "sle_minion"'
22:59:09:000 - 23:03:19:000 | Current URL: https://uyuni-master-server.sumaci.aws/rhn/systems/details/history/Event.do?sid=1000010023&aid=403

execution expired (Timeout::Error)
./features/support/commonlib.rb:95:in `repeat_until_timeout'
./features/support/remote_node.rb:202:in `run_until_ok'
./features/step_definitions/navigation_steps.rb:1168:in `/^I visit "([^"]*)" endpoint of this "([^"]*)"$/'
features/secondary/min_monitoring.feature:60:in `I visit "Prometheus" endpoint of this "sle_minion"'
23:03:33:000 - 23:07:43:000 | Current URL: https://uyuni-master-server.sumaci.aws/rhn/systems/details/history/Event.do?sid=1000010023&aid=403

In order to manage organization's access to SUSE Customer Service
I want to create, edit, and delete its credentials
[{"last_boot"=>"2026-01-30T19:04:49Z", "name"=>"uyuni-master-suse-minion.sumaci.aws", "id"=>1000010023, "last_checkin"=>"2026-01-30T22:09:17Z"}]
As an authorized user
I want to be able to install and remove them through the WebUI
In order to change the server's hostname
I want to use the tool spacewalk-hostname-rename.
I want to be sure that there is no wrong SELinux label
Found 23 failures in salt event log:
# Failure 2 , _stamp: 2026-01-30T20:24:35.752787 {
"__id__": "pkg_installed",
"__run_num__": 11,
"__sls__": "packages.pkginstall",
"changes": {},
"comment": "An error was encountered while installing package(s): Zypper command failure: Running as unit: run-p14271-i14272.scope; invocation ID: 947b5f5ea6cb40cca4d0c87d5a25c815Loading repository data...\nReading installed packages...\nResolving package dependencies...\n\nProblem: 1: nothing provides 'python3-defusedxml' needed by the to be installed python3-rhnlib-5.2.1-2.3.uyuni.noarch\n Solution 1: do not install mgr-push-5.2.1-2.3.uyuni.noarch\n Solution 2: break python3-rhnlib-5.2.1-2.3.uyuni.noarch by ignoring some of its dependencies\n\nChoose from above solutions by number or cancel [1/2/c/d/?] (c): c",
"duration": 1981.154,
"name": "pkg_installed",
"result": false,
"start_time": "21:24:33.762281"
}
# Failure 3 , _stamp: 2026-01-30T20:39:34.629345 {
"__id__": "mgr_buildimage",
"__run_num__": 1,
"__sls__": "images.docker",
"changes": {},
"comment": "Module function docker.build threw an exception. Exception: Build failed for https://github.com/uyuni-project/uyuni.git#:testsuite/features/profiles/temporary/docker_profiles/cloud_aws/Docker. Error(s) follow:\n\nmanifest for ip-172-16-1-175.eu-central-1.compute.internal/suse/sle15:15.7 not found: manifest unknown: manifest unknown",
"duration": 15959.489,
"name": "docker.build",
"result": false,
"start_time": "21:39:18.624173"
}
# Failure 4 , _stamp: 2026-01-30T20:39:34.629345 {
"__id__": "mgr_pushimage",
"__run_num__": 2,
"__sls__": "images.docker",
"changes": {},
"comment": "One or more requisite failed: images.docker.mgr_buildimage",
"duration": 0.007,
"name": "docker.push",
"result": false,
"start_time": "21:39:34.584866"
}
# Failure 5 , _stamp: 2026-01-30T20:39:34.629345 {
"__id__": "mgr_registries_logout",
"__run_num__": 3,
"__sls__": "images.docker",
"changes": {},
"comment": "One or more requisite failed: images.docker.mgr_pushimage",
"duration": 0.004,
"name": "docker.logout",
"result": false,
"start_time": "21:39:34.585191"
}
# Failure 6 , _stamp: 2026-01-30T20:40:44.872010 {
"__id__": "mgr_buildimage",
"__run_num__": 1,
"__sls__": "images.docker",
"changes": {},
"comment": "Module function docker.build threw an exception. Exception: Build failed for https://github.com/uyuni-project/uyuni.git#:testsuite/features/profiles/temporary/docker_profiles/cloud_aws/Docker. Error(s) follow:\n\nmanifest for ip-172-16-1-175.eu-central-1.compute.internal/suse/sle15:15.7 not found: manifest unknown: manifest unknown",
"duration": 14996.246,
"name": "docker.build",
"result": false,
"start_time": "21:40:29.840929"
}
# Failure 7 , _stamp: 2026-01-30T20:40:44.872010 {
"__id__": "mgr_pushimage",
"__run_num__": 2,
"__sls__": "images.docker",
"changes": {},
"comment": "One or more requisite failed: images.docker.mgr_buildimage",
"duration": 0.006,
"name": "docker.push",
"result": false,
"start_time": "21:40:44.838086"
}
# Failure 8 , _stamp: 2026-01-30T20:40:44.872010 {
"__id__": "mgr_registries_logout",
"__run_num__": 3,
"__sls__": "images.docker",
"changes": {},
"comment": "One or more requisite failed: images.docker.mgr_pushimage",
"duration": 0.004,
"name": "docker.logout",
"result": false,
"start_time": "21:40:44.838364"
}
# Failure 9 , _stamp: 2026-01-30T20:46:48.833287 {
"__id__": "mgr_buildimage",
"__run_num__": 1,
"__sls__": "images.docker",
"changes": {},
"comment": "Module function docker.build threw an exception. Exception: Build failed for https://github.com/uyuni-project/uyuni.git#:testsuite/features/profiles/temporary/docker_profiles/cloud_aws/Docker. Error(s) follow:\n\nmanifest for ip-172-16-1-175.eu-central-1.compute.internal/suse/sle15:15.7 not found: manifest unknown: manifest unknown",
"duration": 14124.613,
"name": "docker.build",
"result": false,
"start_time": "21:46:34.657597"
}
# Failure 10 , _stamp: 2026-01-30T20:46:48.833287 {
"__id__": "mgr_pushimage",
"__run_num__": 2,
"__sls__": "images.docker",
"changes": {},
"comment": "One or more requisite failed: images.docker.mgr_buildimage",
"duration": 0.005,
"name": "docker.push",
"result": false,
"start_time": "21:46:48.782952"
}
# Failure 11 , _stamp: 2026-01-30T20:46:48.833287 {
"__id__": "mgr_registries_logout",
"__run_num__": 3,
"__sls__": "images.docker",
"changes": {},
"comment": "One or more requisite failed: images.docker.mgr_pushimage",
"duration": 0.004,
"name": "docker.logout",
"result": false,
"start_time": "21:46:48.783234"
}
# Failure 12 , _stamp: 2026-01-30T20:47:44.853992 {
"__id__": "mgr_buildimage",
"__run_num__": 1,
"__sls__": "images.docker",
"changes": {},
"comment": "Module function docker.build threw an exception. Exception: Build failed for https://github.com/uyuni-project/uyuni.git#:testsuite/features/profiles/temporary/docker_profiles/cloud_aws/Docker. Error(s) follow:\n\nmanifest for ip-172-16-1-175.eu-central-1.compute.internal/suse/sle15:15.7 not found: manifest unknown: manifest unknown",
"duration": 15394.042,
"name": "docker.build",
"result": false,
"start_time": "21:47:29.429187"
}
# Failure 13 , _stamp: 2026-01-30T20:47:44.853992 {
"__id__": "mgr_pushimage",
"__run_num__": 2,
"__sls__": "images.docker",
"changes": {},
"comment": "One or more requisite failed: images.docker.mgr_buildimage",
"duration": 0.005,
"name": "docker.push",
"result": false,
"start_time": "21:47:44.823693"
}
# Failure 14 , _stamp: 2026-01-30T20:47:44.853992 {
"__id__": "mgr_registries_logout",
"__run_num__": 3,
"__sls__": "images.docker",
"changes": {},
"comment": "One or more requisite failed: images.docker.mgr_pushimage",
"duration": 0.004,
"name": "docker.logout",
"result": false,
"start_time": "21:47:44.824074"
}
# Failure 15 , _stamp: 2026-01-30T20:48:44.079970 {
"__id__": "mgr_buildimage",
"__run_num__": 1,
"__sls__": "images.docker",
"changes": {},
"comment": "Module function docker.build threw an exception. Exception: Build failed for https://github.com/uyuni-project/uyuni.git#:testsuite/features/profiles/temporary/docker_profiles/cloud_aws/Docker. Error(s) follow:\n\nmanifest for ip-172-16-1-175.eu-central-1.compute.internal/suse/sle15:15.7 not found: manifest unknown: manifest unknown",
"duration": 16012.698,
"name": "docker.build",
"result": false,
"start_time": "21:48:28.029813"
}
# Failure 16 , _stamp: 2026-01-30T20:48:44.079970 {
"__id__": "mgr_pushimage",
"__run_num__": 2,
"__sls__": "images.docker",
"changes": {},
"comment": "One or more requisite failed: images.docker.mgr_buildimage",
"duration": 0.006,
"name": "docker.push",
"result": false,
"start_time": "21:48:44.042999"
}
# Failure 17 , _stamp: 2026-01-30T20:48:44.079970 {
"__id__": "mgr_registries_logout",
"__run_num__": 3,
"__sls__": "images.docker",
"changes": {},
"comment": "One or more requisite failed: images.docker.mgr_pushimage",
"duration": 0.006,
"name": "docker.logout",
"result": false,
"start_time": "21:48:44.043724"
}
# Failure 18 , _stamp: 2026-01-30T20:49:37.021795 {
"__id__": "mgr_buildimage",
"__run_num__": 1,
"__sls__": "images.docker",
"changes": {},
"comment": "Module function docker.build threw an exception. Exception: Build failed for https://github.com/uyuni-project/uyuni.git#:testsuite/features/profiles/temporary/docker_profiles/cloud_aws/Docker. Error(s) follow:\n\nmanifest for ip-172-16-1-175.eu-central-1.compute.internal/suse/sle15:15.7 not found: manifest unknown: manifest unknown",
"duration": 16414.753,
"name": "docker.build",
"result": false,
"start_time": "21:49:20.574731"
}
# Failure 19 , _stamp: 2026-01-30T20:49:37.021795 {
"__id__": "mgr_pushimage",
"__run_num__": 2,
"__sls__": "images.docker",
"changes": {},
"comment": "One or more requisite failed: images.docker.mgr_buildimage",
"duration": 0.005,
"name": "docker.push",
"result": false,
"start_time": "21:49:36.989956"
}
# Failure 20 , _stamp: 2026-01-30T20:49:37.021795 {
"__id__": "mgr_registries_logout",
"__run_num__": 3,
"__sls__": "images.docker",
"changes": {},
"comment": "One or more requisite failed: images.docker.mgr_pushimage",
"duration": 0.004,
"name": "docker.logout",
"result": false,
"start_time": "21:49:36.990233"
}
# Failure 21 , _stamp: 2026-01-30T20:58:45.740810 {
"__id__": "mgr_buildimage",
"__run_num__": 1,
"__sls__": "images.docker",
"changes": {},
"comment": "Module function docker.build threw an exception. Exception: Build failed for https://github.com/uyuni-project/uyuni.git#:testsuite/features/profiles/temporary/docker_profiles/cloud_aws/Docker/authprofile. Error(s) follow:\n\nHead \"https://ip-172-16-1-175.eu-central-1.compute.internal:5000/v2/cucutest/systemsmanagement/uyuni/master/docker/containers/uyuni-master-testsuite/manifests/latest\": no basic auth credentials",
"duration": 15131.529,
"name": "docker.build",
"result": false,
"start_time": "21:58:30.574715"
}
# Failure 22 , _stamp: 2026-01-30T20:58:45.740810 {
"__id__": "mgr_pushimage",
"__run_num__": 2,
"__sls__": "images.docker",
"changes": {},
"comment": "One or more requisite failed: images.docker.mgr_buildimage",
"duration": 0.006,
"name": "docker.push",
"result": false,
"start_time": "21:58:45.706732"
}
# Failure 23 , _stamp: 2026-01-30T20:58:45.740810 {
"__id__": "mgr_registries_logout",
"__run_num__": 3,
"__sls__": "images.docker",
"changes": {},
"comment": "One or more requisite failed: images.docker.mgr_pushimage",
"duration": 0.004,
"name": "docker.logout",
"result": false,
"start_time": "21:58:45.707009"
}
# Failure 24 , _stamp: 2026-01-30T21:58:36.605119 {
"__id__": "os_not_supported",
"__run_num__": 14,
"__sls__": "prometheus",
"changes": {},
"comment": "Failure!",
"duration": 0.88,
"name": "OS not supported!",
"result": false,
"start_time": "22:58:09.036216"
}
(ScriptError)
./features/step_definitions/salt_steps.rb:526:in `/^the salt event log on server should contain no failures$/'
features/finishing/srv_debug.feature:15:in `the salt event log on server should contain no failures'