All Scenarios

1527

Passed Scenarios

1234

Failed Scenarios

66

Skipped Scenarios

227

Execution Time: 499m 7s 29ms

Expand All | Collapse All

In order to use the product
I want to be sure to use a sane environment

Then "server" should have a FQDN 402ms

And reverse resolution should work for "server" 2s 492ms

And the clock from "server" should be exact 2s 488ms

And service "apache2" is active on "server" 2s 606ms

And service "cobblerd" is active on "server" 2s 521ms

And service "rhn-search" is active on "server" 2s 663ms

And service "salt-api" is active on "server" 4s 174ms

And service "salt-master" is active on "server" 2s 470ms

And service "taskomatic" is active on "server" 2s 534ms

And socket "tftp" is active on "server" 2s 557ms

And service "tomcat" is active on "server" 2s 461ms

Then "proxy" should have a FQDN 3s 35ms

And reverse resolution should work for "proxy" 286ms

And "proxy" should communicate with the server using public interface 2s 904ms

And the clock from "proxy" should be exact 277ms

Then "sle_minion" should have a FQDN 4s 535ms

And reverse resolution should work for "sle_minion" 433ms

And "sle_minion" should communicate with the server using public interface 2s 917ms

And the clock from "sle_minion" should be exact 417ms

Then "build_host" should have a FQDN 2s 388ms

And reverse resolution should work for "build_host" 222ms

And "build_host" should communicate with the server using public interface 3s 366ms

And the clock from "build_host" should be exact 213ms

Then "ssh_minion" should have a FQDN 4s 281ms

And reverse resolution should work for "ssh_minion" 400ms

And "ssh_minion" should communicate with the server using public interface 2s 894ms

And the clock from "ssh_minion" should be exact 392ms

Then "rhlike_minion" should have a FQDN 2s 22ms

And reverse resolution should work for "rhlike_minion" 196ms

And "rhlike_minion" should communicate with the server using public interface 4s 758ms

And the clock from "rhlike_minion" should be exact 207ms

Then "deblike_minion" should have a FQDN 4s 400ms

And reverse resolution should work for "deblike_minion" 218ms

And "deblike_minion" should communicate with the server using public interface 2s 753ms

And the clock from "deblike_minion" should be exact 206ms

Then it should be possible to reach the test packages 0s

And it should be possible to reach the build sources 0s

And it should be possible to reach the Docker profiles 0s

Then it should be possible to use the HTTP proxy 0s

Then it should be possible to reach the authenticated registry 2s 470ms

Then it should be possible to reach the not authenticated registry 4s 484ms

Then it should be possible to use the custom download endpoint 2s 556ms

In order to use the product
As the admin user
I want to create the organisation, the first users and set the HTTP proxy

When I run "rm -Rf /srv/salt/*" on "server" 2s 507ms

Given I am authorized for the "Admin" section 39s 955ms

When I wait until mgr-sync refresh is finished 7s 759ms

When I follow the left menu "Users > User List > Active" 199ms

And I follow "Create User" 843ms

And I enter "testing" as "login" 57ms

And I enter "testing" as "desiredpassword" 57ms

And I enter "testing" as "desiredpasswordConfirm" 61ms

And I select "Mr." from "prefix" 51ms

And I enter "Test" as "firstNames" 55ms

And I enter "User" as "lastName" 56ms

And I enter "galaxy-noise@localhost" as "email" 76ms

And I click on "Create Login" 2s 271ms

Then I should see a "Account testing created, login information sent to galaxy-noise@localhost" text 64ms

And I should see a "testing" link 12ms

When I follow the left menu "Users > User List > Active" 76ms

And I follow "testing" 596ms

And I check "role_org_admin" 84ms

And I check "role_system_group_admin" 79ms

And I check "role_channel_admin" 82ms

And I check "role_activation_key_admin" 82ms

And I check "role_config_admin" 82ms

And I click on "Update" 1s 129ms

Then I should see a "User information updated" text 77ms

And I should see a "testing" text 70ms

When I follow the left menu "Admin > Setup Wizard > HTTP Proxy" 0s

Then I should see a "HTTP Proxy Hostname" text 0s

And I should see a "HTTP Proxy Username" text 0s

And I should see a "HTTP Proxy Password" text 0s

When I enter the address of the HTTP proxy as "HTTP Proxy Hostname" 0s

And I enter "suma3" as "HTTP Proxy Username" 0s

And I enter "P4$$w/ord With%and&" as "HTTP Proxy Password" 0s

And I click on "Save and Verify" 0s

Then HTTP proxy verification should have succeeded 0s

* Mon Apr 27 2026 Marek Czernek
- BDSA-2025-60810: Harden Tornado from invalid HTTP reason phrases
- Read full URI from ldap pillar config (bsc#1254900)
- Added:
* bdsa-2025-60810-harden-against-invalid-http-reason-p.patch
* read-full-uri-from-ldap-pillar-config-753.patch

* Tue Apr 14 2026 Marek Czernek
- Fix testsuite failures
- Added:
* fix-test-failures-754.patch

* Tue Mar 17 2026 Victor Zhestkov
- Backport security patch for Salt vendored tornado (bsc#1259554):
* CVE-2026-31958: Add limits on multipart form data parsing

When I query latest Salt changes on "server" 2s 692ms

In order to test the product using shortcuts
As root user
I want to add pillar data to disable that feature

When I turn off disable_local_repos for all clients 8s 385ms

Given I am authorized for the "Admin" section 0s

When I follow the left menu "Admin > Setup Wizard > Organization Credentials" 0s

And I ask to add new credentials 0s

And I enter the SCC credentials 0s

And I click on "Save" 0s

And I wait until the SCC credentials are valid 0s

In order to set up my personal preferences
As admin
I want to navigate through "Home" submenus changing some settings

Given I am authorized as "admin" with password "admin" 512ms

When I follow the left menu "Home > My Preferences" 74ms

And I select "100" from "pagesize" 65ms

And I click on "Save Preferences" 584ms

Then I should see a "Preferences modified" text 108ms

Given I am authorized as "testing" with password "testing" 2s 988ms

When I follow the left menu "Home > My Preferences" 60ms

And I select "100" from "pagesize" 55ms

And I click on "Save Preferences" 679ms

Then I should see a "Preferences modified" text 99ms

New user kiwikiwi created with roles: image_admin

Given I am authorized for the "Admin" section 1s 849ms

When I create a user with name "kiwikiwi" and password "kiwikiwi" with roles "image_admin" 3s 819ms

New user docker created with roles: image_admin

Given I am authorized for the "Admin" section 466ms

When I create a user with name "docker" and password "docker" with roles "image_admin" 3s 564ms

When I follow the left menu "Images > Stores" 125ms

And I follow "Create" 713ms

And I enter "galaxy-registry" as "label" 106ms

And I enter the URI of the registry as "uri" 147ms

And I click on "create-btn" 435ms

Then I wait until table row contains a "galaxy-registry" text 2s 221ms

And I should see a "Items 1 - 1 of 1" text 59ms

Given I am authorized for the "Admin" section 21s 702ms

When I follow the left menu "Admin > Task Schedules" 164ms

And I follow "mgr-sync-refresh-default" 1s 237ms

And I choose "disabled" 75ms

And I click on "Update Schedule" 1s 546ms

And I click on "Disable Schedule" 3s 37ms

When I follow the left menu "Admin > Task Schedules" 66ms

And I follow "cobbler-sync-default" 1s 328ms

And I choose "disabled" 53ms

And I click on "Update Schedule" 1s 437ms

And I click on "Disable Schedule" 1s 621ms

In order to use software channels
As root user
I want to list available channels and enable them

When I refresh SCC 34s 476ms

And I execute mgr-sync "list channels -e" with user "admin" and password "admin" 7s 866ms

Then I should get "[ ] SLE-Product-SLES15-SP7-Pool for x86_64 SUSE Linux Enterprise Server 15 SP7 x86_64 [sle-product-sles15-sp7-pool-x86_64]" < 1ms

And I should get " [ ] SLE-Product-SLES15-SP7-Updates for x86_64 SUSE Linux Enterprise Server 15 SP7 x86_64 [sle-product-sles15-sp7-updates-x86_64]" < 1ms

And I should get " [ ] SLE15-SP7-Installer-Updates for x86_64 SUSE Linux Enterprise Server 15 SP7 x86_64 [sle15-sp7-installer-updates-x86_64]" < 1ms

When I execute mgr-sync "list channels -e --no-optional" 3s 436ms

Then I should get "[ ] SLE-Product-SLES15-SP7-Pool for x86_64 SUSE Linux Enterprise Server 15 SP7 x86_64 [sle-product-sles15-sp7-pool-x86_64]" < 1ms

And I should get " [ ] SLE-Product-SLES15-SP7-Updates for x86_64 SUSE Linux Enterprise Server 15 SP7 x86_64 [sle-product-sles15-sp7-updates-x86_64]" < 1ms

And I shouldn't get " [ ] SLE15-SP7-Installer-Updates for x86_64 SUSE Linux Enterprise Server 15 SP7 x86_64 [sle15-sp7-installer-updates-x86_64]" < 1ms

When I execute mgr-sync "list products" 3s 607ms

Then I should get "[ ] SUSE Linux Enterprise Server 15 SP7 x86_64" < 1ms

When I execute mgr-sync "list products --expand" 0s

Then I should get "[ ] SUSE Linux Enterprise Server 15 SP7 x86_64" 0s

And I should get " [ ] SUSE Multi-Linux Manager Proxy Extension 5.1 x86_64" 0s

And I should get " [ ] SUSE Multi-Linux Manager Proxy Extension for SLE 5.1 x86_64" 0s

And I should get " [ ] (R) SUSE Multi-Linux Manager Client Tools for SUSE Liberty Linux 7, RHEL and clones 7 x86_64" 0s

And I should get " [ ] (R) SUSE Multi-Linux Manager Client Tools for SLE 15 x86_64" 0s

When I execute mgr-sync "list products --expand --filter x86_64" 4s 808ms

Then I should get "[ ] SUSE Linux Enterprise Server 15 SP7 x86_64" < 1ms

And I shouldn't get "ppc64" < 1ms

And I shouldn't get "s390x" < 1ms

When I remove the mgr-sync cache file 2s 598ms

And I execute mgr-sync refresh 1m 2s 417ms

Then I should get "Timeout. No user input for 60 seconds. Exiting..." < 1ms

When I refresh SCC 29s 988ms

Given I am authorized for the "Admin" section 440ms

When I follow the left menu "Admin > Setup Wizard > Products" 200ms

And I wait until I see "Product Description" text 1s 193ms

Then I should see a "Arch" text 117ms

And I should see a "Channels" text 116ms

And I should not see a "WebYaST 1.3" text 117ms

When I follow the left menu "Admin > Setup Wizard > Products" 75ms

And I wait until I do not see "currently running" text 77ms

And I wait until I do not see "Loading" text 991ms

And I enter "RHEL and Liberty" as the filtered product description 180ms

Then I should see a "RHEL and Liberty 8 Base" text 84ms

When I select "x86_64" from "product-arch-filter" 1s 128ms

Then I should see a "RHEL and Liberty 8 Base" text 91ms

When I follow the left menu "Admin > Setup Wizard > Products" 0s

And I wait until I do not see "currently running" text 0s

And I wait until I do not see "Loading" text 0s

And I enter "SUSE Linux Enterprise Server for SAP Applications 15 x86_64" as the filtered product description 0s

And I click the channel list of product "SUSE Linux Enterprise Server for SAP Applications 15 x86_64" 0s

Then I should see a "Product Channels" text 0s

And I should see a "Mandatory Channels" text 0s

And I should see a "Optional Channels" text 0s

When I close the modal dialog 0s

Given I am authorized for the "Admin" section 0s

When I follow the left menu "Admin > Setup Wizard > Products" 0s

And I wait until I do not see "currently running" text 0s

And I wait until I do not see "Loading" text 0s

And I enter "SUSE Linux Enterprise Server 15 SP7" as the filtered product description 0s

And I wait until I see "SUSE Linux Enterprise Server 15 SP7 x86_64" text 0s

And I open the sub-list of the product "SUSE Linux Enterprise Server 15 SP7 x86_64" 0s

And I open the sub-list of the product "Basesystem Module 15 SP7 x86_64" 0s

And I open the sub-list of the product "Desktop Applications Module 15 SP7 x86_64" 0s

And I open the sub-list of the product "SUSE Multi-Linux Manager Client Tools for SLE 15 x86_64" if present 0s

Then I should see that the "Basesystem Module 15 SP7 x86_64" product is "recommended" 0s

And I should see that the "Server Applications Module 15 SP7 x86_64" product is "recommended" 0s

And I should see that the "SUSE Multi-Linux Manager Client Tools for SLE 15 x86_64" product is "recommended" 0s

When I select "SUSE Linux Enterprise Server 15 SP7 x86_64" as a product 0s

Then I should see the "SUSE Linux Enterprise Server 15 SP7 x86_64" selected 0s

And I should see the "Basesystem Module 15 SP7 x86_64" selected 0s

And I should see the "Server Applications Module 15 SP7 x86_64" selected 0s

And I should see the "SUSE Multi-Linux Manager Client Tools for SLE 15 x86_64" selected 0s

When I select "Desktop Applications Module 15 SP7 x86_64" as a product 0s

And I select "Development Tools Module 15 SP7 x86_64" as a product 0s

Then I should see the "Desktop Applications Module 15 SP7 x86_64" selected 0s

And I should see the "Development Tools Module 15 SP7 x86_64" selected 0s

When I select "Python 3 Module 15 SP7 x86_64" as a product 0s

Then I should see the "Python 3 Module 15 SP7 x86_64" selected 0s

When I select "Containers Module 15 SP7 x86_64" as a product 0s

Then I should see the "Containers Module 15 SP7 x86_64" selected 0s

When I click the Add Product button 0s

And I wait until I see "SUSE Linux Enterprise Server 15 SP7 x86_64" product has been added 0s

Then the SLE15 SP7 product should be added 0s

When I wait until all synchronized channels for "sles15-sp7" have finished 0s

Reposync of channel opensuse_tumbleweed-x86_64 killed
Channel opensuse_tumbleweed-uyuni-client-x86_64 added
Channel opensuse_tumbleweed-uyuni-client-devel-x86_64 added
DEBUG: Found channel 'opensuse_tumbleweed-x86_64' at line 9. Checking for completion...
DEBUG: Found 'Sync of channel completed.' for opensuse_tumbleweed-x86_64 at line 13.
SUCCESS: opensuse_tumbleweed-x86_64 is fully synchronized.
DEBUG: Found channel 'opensuse_tumbleweed-uyuni-client-x86_64' at line 17. Checking for completion...
DEBUG: Found 'Sync of channel completed.' for opensuse_tumbleweed-uyuni-client-x86_64 at line 21.
SUCCESS: opensuse_tumbleweed-uyuni-client-x86_64 is fully synchronized.
DEBUG: Channel 'opensuse_tumbleweed-uyuni-client-devel-x86_64' not found in reposync.log
DEBUG: Found channel 'opensuse_tumbleweed-uyuni-client-devel-x86_64' at line 25. Checking for completion...
DEBUG: Sync for opensuse_tumbleweed-uyuni-client-devel-x86_64 still in progress (no completion message found).
DEBUG: Found channel 'opensuse_tumbleweed-uyuni-client-devel-x86_64' at line 25. Checking for completion...
DEBUG: Found 'Sync of channel completed.' for opensuse_tumbleweed-uyuni-client-devel-x86_64 at line 29.
SUCCESS: opensuse_tumbleweed-uyuni-client-devel-x86_64 is fully synchronized.

When I use spacewalk-common-channel to add channel "opensuse_tumbleweed" with arch "x86_64" 13s 215ms

And I kill running spacewalk-repo-sync for "opensuse_tumbleweed-x86_64" channel 7s 742ms

And I use spacewalk-repo-sync to sync channel "opensuse_tumbleweed-x86_64" including only client tools dependencies 4s 696ms

And I use spacewalk-common-channel to add all "tumbleweed-client-tools-x86_64" channels with arch "x86_64" 24s 361ms

When I wait until all synchronized channels for "tumbleweed" have finished 56s 918ms

Channel opensuse_tumbleweed-x86_64 added
Channel opensuse_tumbleweed-uyuni-client-devel-x86_64 added
Channel uyuni-proxy-devel-tumbleweed-x86_64 added
DEBUG: Found channel 'opensuse_tumbleweed-x86_64' at line 9. Checking for completion...
DEBUG: Found 'Sync of channel completed.' for opensuse_tumbleweed-x86_64 at line 13.
SUCCESS: opensuse_tumbleweed-x86_64 is fully synchronized.
DEBUG: Found channel 'opensuse_tumbleweed-uyuni-client-devel-x86_64' at line 25. Checking for completion...
DEBUG: Found 'Sync of channel completed.' for opensuse_tumbleweed-uyuni-client-devel-x86_64 at line 29.
SUCCESS: opensuse_tumbleweed-uyuni-client-devel-x86_64 is fully synchronized.
DEBUG: Found channel 'uyuni-proxy-devel-tumbleweed-x86_64' at line 33. Checking for completion...
DEBUG: Found 'Sync of channel completed.' for uyuni-proxy-devel-tumbleweed-x86_64 at line 37.
SUCCESS: uyuni-proxy-devel-tumbleweed-x86_64 is fully synchronized.

When I use spacewalk-common-channel to add all "uyuni-proxy" channels with arch "x86_64" 32s 117ms

And I wait until all synchronized channels for "uyuni-proxy" have finished 14s 65ms

Products list: Available Channels: Status: - [I] - channel is installed - [ ] - channel is not installed, but is available - [U] - channel is unavailable [ ] EL9-Pool for x86_64 RHEL and Liberty 9 Base [el9-pool-x86_64] [ ] RHEL7-Pool for x86_64 RHEL7 Base x86_64 [rhel7-pool-x86_64] [ ] RHEL8-Pool for x86_64 RHEL and Liberty 8 Base [rhel8-pool-x86_64] [ ] SLE-Micro-5.3-Pool for x86_64 SUSE Linux Enterprise Micro 5.3 x86_64 [sle-micro-5.3-pool-x86_64] [ ] SLE-Product-SLED15-SP4-Pool for x86_64 SUSE Linux Enterprise Desktop 15 SP4 x86_64 [sle-product-sled15-sp4-pool-x86_64] [ ] SLE-Product-SLES15-SP4-Pool for x86_64 SUSE Linux Enterprise Server 15 SP4 x86_64 [sle-product-sles15-sp4-pool-x86_64] [ ] SLE-Product-SLES15-SP5-Pool for x86_64 SUSE Linux Enterprise Server 15 SP5 x86_64 [sle-product-sles15-sp5-pool-x86_64] [ ] SLE-Product-SLES15-SP6-Pool for x86_64 SUSE Linux Enterprise Server 15 SP6 x86_64 [sle-product-sles15-sp6-pool-x86_64] [I] SLE-Product-SLES15-SP7-Pool for x86_64 SUSE Linux Enterprise Server 15 SP7 x86_64 [sle-product-sles15-sp7-pool-x86_64] [I] SLE-Module-Basesystem15-SP7-Pool for x86_64 Basesystem Module 15 SP7 x86_64 [sle-module-basesystem15-sp7-pool-x86_64] [I] SLE-Module-Basesystem15-SP7-Updates for x86_64 Basesystem Module 15 SP7 x86_64 [sle-module-basesystem15-sp7-updates-x86_64] [ ] SLE-Module-Containers15-SP7-Pool for x86_64 Containers Module 15 SP7 x86_64 [sle-module-containers15-sp7-pool-x86_64] [ ] SLE-Module-Containers15-SP7-Updates for x86_64 Containers Module 15 SP7 x86_64 [sle-module-containers15-sp7-updates-x86_64] [I] SLE-Module-Desktop-Applications15-SP7-Pool for x86_64 Desktop Applications Module 15 SP7 x86_64 [sle-module-desktop-applications15-sp7-pool-x86_64] [I] SLE-Module-Desktop-Applications15-SP7-Updates for x86_64 Desktop Applications Module 15 SP7 x86_64 [sle-module-desktop-applications15-sp7-updates-x86_64] [I] SLE-Module-DevTools15-SP7-Pool for x86_64 Development Tools Module 15 SP7 x86_64 [sle-module-devtools15-sp7-pool-x86_64] [I] SLE-Module-DevTools15-SP7-Updates for x86_64 Development Tools Module 15 SP7 x86_64 [sle-module-devtools15-sp7-updates-x86_64] [ ] SLE-Module-Live-Patching15-SP7-Pool for x86_64 SUSE Linux Enterprise Live Patching 15 SP7 x86_64 [sle-module-live-patching15-sp7-pool-x86_64] [ ] SLE-Module-Live-Patching15-SP7-Updates for x86_64 SUSE Linux Enterprise Live Patching 15 SP7 x86_64 [sle-module-live-patching15-sp7-updates-x86_64] [ ] SLE-Module-Public-Cloud15-SP7-Pool for x86_64 Public Cloud Module 15 SP7 x86_64 [sle-module-public-cloud15-sp7-pool-x86_64] [ ] SLE-Module-Public-Cloud15-SP7-Updates for x86_64 Public Cloud Module 15 SP7 x86_64 [sle-module-public-cloud15-sp7-updates-x86_64] [I] SLE-Module-Python3-15-SP7-Pool for x86_64 Python 3 Module 15 SP7 x86_64 [sle-module-python3-15-sp7-pool-x86_64] [I] SLE-Module-Python3-15-SP7-Updates for x86_64 Python 3 Module 15 SP7 x86_64 [sle-module-python3-15-sp7-updates-x86_64] [I] SLE-Module-Server-Applications15-SP7-Pool for x86_64 Server Applications Module 15 SP7 x86_64 [sle-module-server-applications15-sp7-pool-x86_64] [I] SLE-Module-Server-Applications15-SP7-Updates for x86_64 Server Applications Module 15 SP7 x86_64 [sle-module-server-applications15-sp7-updates-x86_64] [I] SLE-Module-Systems-Management-15-SP7-Pool for x86_64 Systems Management Module 15 SP7 x86_64 [sle-module-systems-management-15-sp7-pool-x86_64] [I] SLE-Module-Systems-Management-15-SP7-Updates for x86_64 Systems Management Module 15 SP7 x86_64 [sle-module-systems-management-15-sp7-updates-x86_64] [ ] SLE-Module-Web-Scripting15-SP7-Pool for x86_64 Web and Scripting Module 15 SP7 x86_64 [sle-module-web-scripting15-sp7-pool-x86_64] [ ] SLE-Module-Web-Scripting15-SP7-Updates for x86_64 Web and Scripting Module 15 SP7 x86_64 [sle-module-web-scripting15-sp7-updates-x86_64] [I] SLE-Product-SLES15-SP7-Updates for x86_64 SUSE Linux Enterprise Server 15 SP7 x86_64 [sle-product-sles15-sp7-updates-x86_64] [I] SLE15-SP7-Installer-Updates for x86_64 SUSE Linux Enterprise Server 15 SP7 x86_64 [sle15-sp7-installer-updates-x86_64] [ ] SUSE-MicroOS-5.2-Pool for x86_64 SUSE Linux Enterprise Micro 5.2 x86_64 [suse-microos-5.2-pool-x86_64]
DEBUG: Found channel 'sle-product-sles15-sp7-pool-x86_64' at line 41. Checking for completion...
DEBUG: Found 'Sync of channel completed.' for sle-product-sles15-sp7-pool-x86_64 at line 45.
SUCCESS: sle-product-sles15-sp7-pool-x86_64 is fully synchronized.
DEBUG: Found channel 'sle-product-sles15-sp7-updates-x86_64' at line 49. Checking for completion...
DEBUG: Found 'Sync of channel completed.' for sle-product-sles15-sp7-updates-x86_64 at line 53.
SUCCESS: sle-product-sles15-sp7-updates-x86_64 is fully synchronized.
DEBUG: Found channel 'sle15-sp7-installer-updates-x86_64' at line 57. Checking for completion...
DEBUG: Found 'Sync of channel completed.' for sle15-sp7-installer-updates-x86_64 at line 61.
SUCCESS: sle15-sp7-installer-updates-x86_64 is fully synchronized.
DEBUG: Found channel 'sle-module-basesystem15-sp7-pool-x86_64' at line 65. Checking for completion...
DEBUG: Sync for sle-module-basesystem15-sp7-pool-x86_64 still in progress (no completion message found).
DEBUG: Channel 'sle-module-basesystem15-sp7-updates-x86_64' not found in reposync.log
DEBUG: Channel 'sle-module-python3-15-sp7-pool-x86_64' not found in reposync.log
DEBUG: Channel 'sle-module-python3-15-sp7-updates-x86_64' not found in reposync.log
DEBUG: Channel 'sle-module-server-applications15-sp7-pool-x86_64' not found in reposync.log
DEBUG: Channel 'sle-module-server-applications15-sp7-updates-x86_64' not found in reposync.log
DEBUG: Channel 'sle-module-desktop-applications15-sp7-pool-x86_64' not found in reposync.log
DEBUG: Channel 'sle-module-desktop-applications15-sp7-updates-x86_64' not found in reposync.log
DEBUG: Channel 'sle-module-devtools15-sp7-updates-x86_64' not found in reposync.log
DEBUG: Channel 'sle-module-devtools15-sp7-pool-x86_64' not found in reposync.log
DEBUG: Channel 'sle-module-systems-management-15-sp7-pool-x86_64' not found in reposync.log
DEBUG: Channel 'sle-module-systems-management-15-sp7-updates-x86_64' not found in reposync.log
DEBUG: Channel 'sles15-sp7-devel-uyuni-client-x86_64' not found in reposync.log
DEBUG: Found channel 'sle-module-basesystem15-sp7-pool-x86_64' at line 65. Checking for completion...
DEBUG: Sync for sle-module-basesystem15-sp7-pool-x86_64 still in progress (no completion message found).
DEBUG: Channel 'sle-module-basesystem15-sp7-updates-x86_64' not found in reposync.log
DEBUG: Channel 'sle-module-python3-15-sp7-pool-x86_64' not found in reposync.log
DEBUG: Channel 'sle-module-python3-15-sp7-updates-x86_64' not found in reposync.log
DEBUG: Channel 'sle-module-server-applications15-sp7-pool-x86_64' not found in reposync.log
DEBUG: Channel 'sle-module-server-applications15-sp7-updates-x86_64' not found in reposync.log
DEBUG: Channel 'sle-module-desktop-applications15-sp7-pool-x86_64' not found in reposync.log
DEBUG: Channel 'sle-module-desktop-applications15-sp7-updates-x86_64' not found in reposync.log
DEBUG: Channel 'sle-module-devtools15-sp7-updates-x86_64' not found in reposync.log
DEBUG: Channel 'sle-module-devtools15-sp7-pool-x86_64' not found in reposync.log
DEBUG: Channel 'sle-module-systems-management-15-sp7-pool-x86_64' not found in reposync.log
DEBUG: Channel 'sle-module-systems-management-15-sp7-updates-x86_64' not found in reposync.log
DEBUG: Channel 'sles15-sp7-devel-uyuni-client-x86_64' not found in reposync.log
DEBUG: Found channel 'sle-module-basesystem15-sp7-pool-x86_64' at line 65. Checking for completion...
DEBUG: Sync for sle-module-basesystem15-sp7-pool-x86_64 still in progress (no completion message found).
DEBUG: Channel 'sle-module-basesystem15-sp7-updates-x86_64' not found in reposync.log
DEBUG: Channel 'sle-module-python3-15-sp7-pool-x86_64' not found in reposync.log
DEBUG: Channel 'sle-module-python3-15-sp7-updates-x86_64' not found in reposync.log
DEBUG: Channel 'sle-module-server-applications15-sp7-pool-x86_64' not found in reposync.log
DEBUG: Channel 'sle-module-server-applications15-sp7-updates-x86_64' not found in reposync.log
DEBUG: Channel 'sle-module-desktop-applications15-sp7-pool-x86_64' not found in reposync.log
DEBUG: Channel 'sle-module-desktop-applications15-sp7-updates-x86_64' not found in reposync.log
DEBUG: Channel 'sle-module-devtools15-sp7-updates-x86_64' not found in reposync.log
DEBUG: Channel 'sle-module-devtools15-sp7-pool-x86_64' not found in reposync.log
DEBUG: Channel 'sle-module-systems-management-15-sp7-pool-x86_64' not found in reposync.log
DEBUG: Channel 'sle-module-systems-management-15-sp7-updates-x86_64' not found in reposync.log
DEBUG: Channel 'sles15-sp7-devel-uyuni-client-x86_64' not found in reposync.log
DEBUG: Found channel 'sle-module-basesystem15-sp7-pool-x86_64' at line 65. Checking for completion...
DEBUG: Sync for sle-module-basesystem15-sp7-pool-x86_64 still in progress (no completion message found).
DEBUG: Channel 'sle-module-basesystem15-sp7-updates-x86_64' not found in reposync.log
DEBUG: Channel 'sle-module-python3-15-sp7-pool-x86_64' not found in reposync.log
DEBUG: Channel 'sle-module-python3-15-sp7-updates-x86_64' not found in reposync.log
DEBUG: Channel 'sle-module-server-applications15-sp7-pool-x86_64' not found in reposync.log
DEBUG: Channel 'sle-module-server-applications15-sp7-updates-x86_64' not found in reposync.log
DEBUG: Channel 'sle-module-desktop-applications15-sp7-pool-x86_64' not found in reposync.log
DEBUG: Channel 'sle-module-desktop-applications15-sp7-updates-x86_64' not found in reposync.log
DEBUG: Channel 'sle-module-devtools15-sp7-updates-x86_64' not found in reposync.log
DEBUG: Channel 'sle-module-devtools15-sp7-pool-x86_64' not found in reposync.log
DEBUG: Channel 'sle-module-systems-management-15-sp7-pool-x86_64' not found in reposync.log
DEBUG: Channel 'sle-module-systems-management-15-sp7-updates-x86_64' not found in reposync.log
DEBUG: Channel 'sles15-sp7-devel-uyuni-client-x86_64' not found in reposync.log
DEBUG: Found channel 'sle-module-basesystem15-sp7-pool-x86_64' at line 65. Checking for completion...
DEBUG: Sync for sle-module-basesystem15-sp7-pool-x86_64 still in progress (no completion message found).
DEBUG: Channel 'sle-module-basesystem15-sp7-updates-x86_64' not found in reposync.log
DEBUG: Channel 'sle-module-python3-15-sp7-pool-x86_64' not found in reposync.log
DEBUG: Channel 'sle-module-python3-15-sp7-updates-x86_64' not found in reposync.log
DEBUG: Channel 'sle-module-server-applications15-sp7-pool-x86_64' not found in reposync.log
DEBUG: Channel 'sle-module-server-applications15-sp7-updates-x86_64' not found in reposync.log
DEBUG: Channel 'sle-module-desktop-applications15-sp7-pool-x86_64' not found in reposync.log
DEBUG: Channel 'sle-module-desktop-applications15-sp7-updates-x86_64' not found in reposync.log
DEBUG: Channel 'sle-module-devtools15-sp7-updates-x86_64' not found in reposync.log
DEBUG: Channel 'sle-module-devtools15-sp7-pool-x86_64' not found in reposync.log
DEBUG: Channel 'sle-module-systems-management-15-sp7-pool-x86_64' not found in reposync.log
DEBUG: Channel 'sle-module-systems-management-15-sp7-updates-x86_64' not found in reposync.log
DEBUG: Channel 'sles15-sp7-devel-uyuni-client-x86_64' not found in reposync.log
DEBUG: Found channel 'sle-module-basesystem15-sp7-pool-x86_64' at line 65. Checking for completion...
DEBUG: Found 'Sync of channel completed.' for sle-module-basesystem15-sp7-pool-x86_64 at line 69.
SUCCESS: sle-module-basesystem15-sp7-pool-x86_64 is fully synchronized.
DEBUG: Found channel 'sle-module-basesystem15-sp7-updates-x86_64' at line 73. Checking for completion...
DEBUG: Sync for sle-module-basesystem15-sp7-updates-x86_64 still in progress (no completion message found).
DEBUG: Channel 'sle-module-python3-15-sp7-pool-x86_64' not found in reposync.log
DEBUG: Channel 'sle-module-python3-15-sp7-updates-x86_64' not found in reposync.log
DEBUG: Channel 'sle-module-server-applications15-sp7-pool-x86_64' not found in reposync.log
DEBUG: Channel 'sle-module-server-applications15-sp7-updates-x86_64' not found in reposync.log
DEBUG: Channel 'sle-module-desktop-applications15-sp7-pool-x86_64' not found in reposync.log
DEBUG: Channel 'sle-module-desktop-applications15-sp7-updates-x86_64' not found in reposync.log
DEBUG: Channel 'sle-module-devtools15-sp7-updates-x86_64' not found in reposync.log
DEBUG: Channel 'sle-module-devtools15-sp7-pool-x86_64' not found in reposync.log
DEBUG: Channel 'sle-module-systems-management-15-sp7-pool-x86_64' not found in reposync.log
DEBUG: Channel 'sle-module-systems-management-15-sp7-updates-x86_64' not found in reposync.log
DEBUG: Channel 'sles15-sp7-devel-uyuni-client-x86_64' not found in reposync.log
1m / 64m waiting for product 'sles15-sp7' synchronization
DEBUG: Found channel 'sle-module-basesystem15-sp7-updates-x86_64' at line 73. Checking for completion...
DEBUG: Sync for sle-module-basesystem15-sp7-updates-x86_64 still in progress (no completion message found).
DEBUG: Channel 'sle-module-python3-15-sp7-pool-x86_64' not found in reposync.log
DEBUG: Channel 'sle-module-python3-15-sp7-updates-x86_64' not found in reposync.log
DEBUG: Channel 'sle-module-server-applications15-sp7-pool-x86_64' not found in reposync.log
DEBUG: Channel 'sle-module-server-applications15-sp7-updates-x86_64' not found in reposync.log
DEBUG: Channel 'sle-module-desktop-applications15-sp7-pool-x86_64' not found in reposync.log
DEBUG: Channel 'sle-module-desktop-applications15-sp7-updates-x86_64' not found in reposync.log
DEBUG: Channel 'sle-module-devtools15-sp7-updates-x86_64' not found in reposync.log
DEBUG: Channel 'sle-module-devtools15-sp7-pool-x86_64' not found in reposync.log
DEBUG: Channel 'sle-module-systems-management-15-sp7-pool-x86_64' not found in reposync.log
DEBUG: Channel 'sle-module-systems-management-15-sp7-updates-x86_64' not found in reposync.log
DEBUG: Channel 'sles15-sp7-devel-uyuni-client-x86_64' not found in reposync.log
DEBUG: Found channel 'sle-module-basesystem15-sp7-updates-x86_64' at line 73. Checking for completion...
DEBUG: Sync for sle-module-basesystem15-sp7-updates-x86_64 still in progress (no completion message found).
DEBUG: Channel 'sle-module-python3-15-sp7-pool-x86_64' not found in reposync.log
DEBUG: Channel 'sle-module-python3-15-sp7-updates-x86_64' not found in reposync.log
DEBUG: Channel 'sle-module-server-applications15-sp7-pool-x86_64' not found in reposync.log
DEBUG: Channel 'sle-module-server-applications15-sp7-updates-x86_64' not found in reposync.log
DEBUG: Channel 'sle-module-desktop-applications15-sp7-pool-x86_64' not found in reposync.log
DEBUG: Channel 'sle-module-desktop-applications15-sp7-updates-x86_64' not found in reposync.log
DEBUG: Channel 'sle-module-devtools15-sp7-updates-x86_64' not found in reposync.log
DEBUG: Channel 'sle-module-devtools15-sp7-pool-x86_64' not found in reposync.log
DEBUG: Channel 'sle-module-systems-management-15-sp7-pool-x86_64' not found in reposync.log
DEBUG: Channel 'sle-module-systems-management-15-sp7-updates-x86_64' not found in reposync.log
DEBUG: Channel 'sles15-sp7-devel-uyuni-client-x86_64' not found in reposync.log
DEBUG: Found channel 'sle-module-basesystem15-sp7-updates-x86_64' at line 73. Checking for completion...
DEBUG: Sync for sle-module-basesystem15-sp7-updates-x86_64 still in progress (no completion message found).
DEBUG: Channel 'sle-module-python3-15-sp7-pool-x86_64' not found in reposync.log
DEBUG: Channel 'sle-module-python3-15-sp7-updates-x86_64' not found in reposync.log
DEBUG: Channel 'sle-module-server-applications15-sp7-pool-x86_64' not found in reposync.log
DEBUG: Channel 'sle-module-server-applications15-sp7-updates-x86_64' not found in reposync.log
DEBUG: Channel 'sle-module-desktop-applications15-sp7-pool-x86_64' not found in reposync.log
DEBUG: Channel 'sle-module-desktop-applications15-sp7-updates-x86_64' not found in reposync.log
DEBUG: Channel 'sle-module-devtools15-sp7-updates-x86_64' not found in reposync.log
DEBUG: Channel 'sle-module-devtools15-sp7-pool-x86_64' not found in reposync.log
DEBUG: Channel 'sle-module-systems-management-15-sp7-pool-x86_64' not found in reposync.log
DEBUG: Channel 'sle-module-systems-management-15-sp7-updates-x86_64' not found in reposync.log
DEBUG: Channel 'sles15-sp7-devel-uyuni-client-x86_64' not found in reposync.log
DEBUG: Found channel 'sle-module-basesystem15-sp7-updates-x86_64' at line 73. Checking for completion...
DEBUG: Sync for sle-module-basesystem15-sp7-updates-x86_64 still in progress (no completion message found).
DEBUG: Channel 'sle-module-python3-15-sp7-pool-x86_64' not found in reposync.log
DEBUG: Channel 'sle-module-python3-15-sp7-updates-x86_64' not found in reposync.log
DEBUG: Channel 'sle-module-server-applications15-sp7-pool-x86_64' not found in reposync.log
DEBUG: Channel 'sle-module-server-applications15-sp7-updates-x86_64' not found in reposync.log
DEBUG: Channel 'sle-module-desktop-applications15-sp7-pool-x86_64' not found in reposync.log
DEBUG: Channel 'sle-module-desktop-applications15-sp7-updates-x86_64' not found in reposync.log
DEBUG: Channel 'sle-module-devtools15-sp7-updates-x86_64' not found in reposync.log
DEBUG: Channel 'sle-module-devtools15-sp7-pool-x86_64' not found in reposync.log
DEBUG: Channel 'sle-module-systems-management-15-sp7-pool-x86_64' not found in reposync.log
DEBUG: Channel 'sle-module-systems-management-15-sp7-updates-x86_64' not found in reposync.log
DEBUG: Channel 'sles15-sp7-devel-uyuni-client-x86_64' not found in reposync.log
DEBUG: Found channel 'sle-module-basesystem15-sp7-updates-x86_64' at line 73. Checking for completion...
DEBUG: Sync for sle-module-basesystem15-sp7-updates-x86_64 still in progress (no completion message found).
DEBUG: Channel 'sle-module-python3-15-sp7-pool-x86_64' not found in reposync.log
DEBUG: Channel 'sle-module-python3-15-sp7-updates-x86_64' not found in reposync.log
DEBUG: Channel 'sle-module-server-applications15-sp7-pool-x86_64' not found in reposync.log
DEBUG: Channel 'sle-module-server-applications15-sp7-updates-x86_64' not found in reposync.log
DEBUG: Channel 'sle-module-desktop-applications15-sp7-pool-x86_64' not found in reposync.log
DEBUG: Channel 'sle-module-desktop-applications15-sp7-updates-x86_64' not found in reposync.log
DEBUG: Channel 'sle-module-devtools15-sp7-updates-x86_64' not found in reposync.log
DEBUG: Channel 'sle-module-devtools15-sp7-pool-x86_64' not found in reposync.log
DEBUG: Channel 'sle-module-systems-management-15-sp7-pool-x86_64' not found in reposync.log
DEBUG: Channel 'sle-module-systems-management-15-sp7-updates-x86_64' not found in reposync.log
DEBUG: Channel 'sles15-sp7-devel-uyuni-client-x86_64' not found in reposync.log
DEBUG: Found channel 'sle-module-basesystem15-sp7-updates-x86_64' at line 73. Checking for completion...
DEBUG: Sync for sle-module-basesystem15-sp7-updates-x86_64 still in progress (no completion message found).
DEBUG: Channel 'sle-module-python3-15-sp7-pool-x86_64' not found in reposync.log
DEBUG: Channel 'sle-module-python3-15-sp7-updates-x86_64' not found in reposync.log
DEBUG: Channel 'sle-module-server-applications15-sp7-pool-x86_64' not found in reposync.log
DEBUG: Channel 'sle-module-server-applications15-sp7-updates-x86_64' not found in reposync.log
DEBUG: Channel 'sle-module-desktop-applications15-sp7-pool-x86_64' not found in reposync.log
DEBUG: Channel 'sle-module-desktop-applications15-sp7-updates-x86_64' not found in reposync.log
DEBUG: Channel 'sle-module-devtools15-sp7-updates-x86_64' not found in reposync.log
DEBUG: Channel 'sle-module-devtools15-sp7-pool-x86_64' not found in reposync.log
DEBUG: Channel 'sle-module-systems-management-15-sp7-pool-x86_64' not found in reposync.log
DEBUG: Channel 'sle-module-systems-management-15-sp7-updates-x86_64' not found in reposync.log
DEBUG: Channel 'sles15-sp7-devel-uyuni-client-x86_64' not found in reposync.log
2m / 64m waiting for product 'sles15-sp7' synchronization
DEBUG: Found channel 'sle-module-basesystem15-sp7-updates-x86_64' at line 73. Checking for completion...
DEBUG: Sync for sle-module-basesystem15-sp7-updates-x86_64 still in progress (no completion message found).
DEBUG: Channel 'sle-module-python3-15-sp7-pool-x86_64' not found in reposync.log
DEBUG: Channel 'sle-module-python3-15-sp7-updates-x86_64' not found in reposync.log
DEBUG: Channel 'sle-module-server-applications15-sp7-pool-x86_64' not found in reposync.log
DEBUG: Channel 'sle-module-server-applications15-sp7-updates-x86_64' not found in reposync.log
DEBUG: Channel 'sle-module-desktop-applications15-sp7-pool-x86_64' not found in reposync.log
DEBUG: Channel 'sle-module-desktop-applications15-sp7-updates-x86_64' not found in reposync.log
DEBUG: Channel 'sle-module-devtools15-sp7-updates-x86_64' not found in reposync.log
DEBUG: Channel 'sle-module-devtools15-sp7-pool-x86_64' not found in reposync.log
DEBUG: Channel 'sle-module-systems-management-15-sp7-pool-x86_64' not found in reposync.log
DEBUG: Channel 'sle-module-systems-management-15-sp7-updates-x86_64' not found in reposync.log
DEBUG: Channel 'sles15-sp7-devel-uyuni-client-x86_64' not found in reposync.log
DEBUG: Found channel 'sle-module-basesystem15-sp7-updates-x86_64' at line 73. Checking for completion...
DEBUG: Sync for sle-module-basesystem15-sp7-updates-x86_64 still in progress (no completion message found).
DEBUG: Channel 'sle-module-python3-15-sp7-pool-x86_64' not found in reposync.log
DEBUG: Channel 'sle-module-python3-15-sp7-updates-x86_64' not found in reposync.log
DEBUG: Channel 'sle-module-server-applications15-sp7-pool-x86_64' not found in reposync.log
DEBUG: Channel 'sle-module-server-applications15-sp7-updates-x86_64' not found in reposync.log
DEBUG: Channel 'sle-module-desktop-applications15-sp7-pool-x86_64' not found in reposync.log
DEBUG: Channel 'sle-module-desktop-applications15-sp7-updates-x86_64' not found in reposync.log
DEBUG: Channel 'sle-module-devtools15-sp7-updates-x86_64' not found in reposync.log
DEBUG: Channel 'sle-module-devtools15-sp7-pool-x86_64' not found in reposync.log
DEBUG: Channel 'sle-module-systems-management-15-sp7-pool-x86_64' not found in reposync.log
DEBUG: Channel 'sle-module-systems-management-15-sp7-updates-x86_64' not found in reposync.log
DEBUG: Channel 'sles15-sp7-devel-uyuni-client-x86_64' not found in reposync.log
DEBUG: Found channel 'sle-module-basesystem15-sp7-updates-x86_64' at line 73. Checking for completion...
DEBUG: Sync for sle-module-basesystem15-sp7-updates-x86_64 still in progress (no completion message found).
DEBUG: Channel 'sle-module-python3-15-sp7-pool-x86_64' not found in reposync.log
DEBUG: Channel 'sle-module-python3-15-sp7-updates-x86_64' not found in reposync.log
DEBUG: Channel 'sle-module-server-applications15-sp7-pool-x86_64' not found in reposync.log
DEBUG: Channel 'sle-module-server-applications15-sp7-updates-x86_64' not found in reposync.log
DEBUG: Channel 'sle-module-desktop-applications15-sp7-pool-x86_64' not found in reposync.log
DEBUG: Channel 'sle-module-desktop-applications15-sp7-updates-x86_64' not found in reposync.log
DEBUG: Channel 'sle-module-devtools15-sp7-updates-x86_64' not found in reposync.log
DEBUG: Channel 'sle-module-devtools15-sp7-pool-x86_64' not found in reposync.log
DEBUG: Channel 'sle-module-systems-management-15-sp7-pool-x86_64' not found in reposync.log
DEBUG: Channel 'sle-module-systems-management-15-sp7-updates-x86_64' not found in reposync.log
DEBUG: Channel 'sles15-sp7-devel-uyuni-client-x86_64' not found in reposync.log
DEBUG: Found channel 'sle-module-basesystem15-sp7-updates-x86_64' at line 73. Checking for completion...
DEBUG: Sync for sle-module-basesystem15-sp7-updates-x86_64 still in progress (no completion message found).
DEBUG: Channel 'sle-module-python3-15-sp7-pool-x86_64' not found in reposync.log
DEBUG: Channel 'sle-module-python3-15-sp7-updates-x86_64' not found in reposync.log
DEBUG: Channel 'sle-module-server-applications15-sp7-pool-x86_64' not found in reposync.log
DEBUG: Channel 'sle-module-server-applications15-sp7-updates-x86_64' not found in reposync.log
DEBUG: Channel 'sle-module-desktop-applications15-sp7-pool-x86_64' not found in reposync.log
DEBUG: Channel 'sle-module-desktop-applications15-sp7-updates-x86_64' not found in reposync.log
DEBUG: Channel 'sle-module-devtools15-sp7-updates-x86_64' not found in reposync.log
DEBUG: Channel 'sle-module-devtools15-sp7-pool-x86_64' not found in reposync.log
DEBUG: Channel 'sle-module-systems-management-15-sp7-pool-x86_64' not found in reposync.log
DEBUG: Channel 'sle-module-systems-management-15-sp7-updates-x86_64' not found in reposync.log
DEBUG: Channel 'sles15-sp7-devel-uyuni-client-x86_64' not found in reposync.log
DEBUG: Found channel 'sle-module-basesystem15-sp7-updates-x86_64' at line 73. Checking for completion...
DEBUG: Sync for sle-module-basesystem15-sp7-updates-x86_64 still in progress (no completion message found).
DEBUG: Channel 'sle-module-python3-15-sp7-pool-x86_64' not found in reposync.log
DEBUG: Channel 'sle-module-python3-15-sp7-updates-x86_64' not found in reposync.log
DEBUG: Channel 'sle-module-server-applications15-sp7-pool-x86_64' not found in reposync.log
DEBUG: Channel 'sle-module-server-applications15-sp7-updates-x86_64' not found in reposync.log
DEBUG: Channel 'sle-module-desktop-applications15-sp7-pool-x86_64' not found in reposync.log
DEBUG: Channel 'sle-module-desktop-applications15-sp7-updates-x86_64' not found in reposync.log
DEBUG: Channel 'sle-module-devtools15-sp7-updates-x86_64' not found in reposync.log
DEBUG: Channel 'sle-module-devtools15-sp7-pool-x86_64' not found in reposync.log
DEBUG: Channel 'sle-module-systems-management-15-sp7-pool-x86_64' not found in reposync.log
DEBUG: Channel 'sle-module-systems-management-15-sp7-updates-x86_64' not found in reposync.log
DEBUG: Channel 'sles15-sp7-devel-uyuni-client-x86_64' not found in reposync.log
DEBUG: Found channel 'sle-module-basesystem15-sp7-updates-x86_64' at line 73. Checking for completion...
DEBUG: Sync for sle-module-basesystem15-sp7-updates-x86_64 still in progress (no completion message found).
DEBUG: Channel 'sle-module-python3-15-sp7-pool-x86_64' not found in reposync.log
DEBUG: Channel 'sle-module-python3-15-sp7-updates-x86_64' not found in reposync.log
DEBUG: Channel 'sle-module-server-applications15-sp7-pool-x86_64' not found in reposync.log
DEBUG: Channel 'sle-module-server-applications15-sp7-updates-x86_64' not found in reposync.log
DEBUG: Channel 'sle-module-desktop-applications15-sp7-pool-x86_64' not found in reposync.log
DEBUG: Channel 'sle-module-desktop-applications15-sp7-updates-x86_64' not found in reposync.log
DEBUG: Channel 'sle-module-devtools15-sp7-updates-x86_64' not found in reposync.log
DEBUG: Channel 'sle-module-devtools15-sp7-pool-x86_64' not found in reposync.log
DEBUG: Channel 'sle-module-systems-management-15-sp7-pool-x86_64' not found in reposync.log
DEBUG: Channel 'sle-module-systems-management-15-sp7-updates-x86_64' not found in reposync.log
DEBUG: Channel 'sles15-sp7-devel-uyuni-client-x86_64' not found in reposync.log
3m / 64m waiting for product 'sles15-sp7' synchronization
DEBUG: Found channel 'sle-module-basesystem15-sp7-updates-x86_64' at line 73. Checking for completion...
DEBUG: Found 'Sync of channel completed.' for sle-module-basesystem15-sp7-updates-x86_64 at line 77.
SUCCESS: sle-module-basesystem15-sp7-updates-x86_64 is fully synchronized.
DEBUG: Channel 'sle-module-python3-15-sp7-pool-x86_64' not found in reposync.log
DEBUG: Channel 'sle-module-python3-15-sp7-updates-x86_64' not found in reposync.log
DEBUG: Found channel 'sle-module-server-applications15-sp7-pool-x86_64' at line 81. Checking for completion...
DEBUG: Sync for sle-module-server-applications15-sp7-pool-x86_64 still in progress (no completion message found).
DEBUG: Channel 'sle-module-server-applications15-sp7-updates-x86_64' not found in reposync.log
DEBUG: Channel 'sle-module-desktop-applications15-sp7-pool-x86_64' not found in reposync.log
DEBUG: Channel 'sle-module-desktop-applications15-sp7-updates-x86_64' not found in reposync.log
DEBUG: Channel 'sle-module-devtools15-sp7-updates-x86_64' not found in reposync.log
DEBUG: Channel 'sle-module-devtools15-sp7-pool-x86_64' not found in reposync.log
DEBUG: Channel 'sle-module-systems-management-15-sp7-pool-x86_64' not found in reposync.log
DEBUG: Channel 'sle-module-systems-management-15-sp7-updates-x86_64' not found in reposync.log
DEBUG: Channel 'sles15-sp7-devel-uyuni-client-x86_64' not found in reposync.log
DEBUG: Channel 'sle-module-python3-15-sp7-pool-x86_64' not found in reposync.log
DEBUG: Channel 'sle-module-python3-15-sp7-updates-x86_64' not found in reposync.log
DEBUG: Found channel 'sle-module-server-applications15-sp7-pool-x86_64' at line 81. Checking for completion...
DEBUG: Found 'Sync of channel completed.' for sle-module-server-applications15-sp7-pool-x86_64 at line 85.
SUCCESS: sle-module-server-applications15-sp7-pool-x86_64 is fully synchronized.
DEBUG: Found channel 'sle-module-server-applications15-sp7-updates-x86_64' at line 89. Checking for completion...
DEBUG: Sync for sle-module-server-applications15-sp7-updates-x86_64 still in progress (no completion message found).
DEBUG: Channel 'sle-module-desktop-applications15-sp7-pool-x86_64' not found in reposync.log
DEBUG: Channel 'sle-module-desktop-applications15-sp7-updates-x86_64' not found in reposync.log
DEBUG: Channel 'sle-module-devtools15-sp7-updates-x86_64' not found in reposync.log
DEBUG: Channel 'sle-module-devtools15-sp7-pool-x86_64' not found in reposync.log
DEBUG: Channel 'sle-module-systems-management-15-sp7-pool-x86_64' not found in reposync.log
DEBUG: Channel 'sle-module-systems-management-15-sp7-updates-x86_64' not found in reposync.log
DEBUG: Channel 'sles15-sp7-devel-uyuni-client-x86_64' not found in reposync.log
DEBUG: Channel 'sle-module-python3-15-sp7-pool-x86_64' not found in reposync.log
DEBUG: Channel 'sle-module-python3-15-sp7-updates-x86_64' not found in reposync.log
DEBUG: Found channel 'sle-module-server-applications15-sp7-updates-x86_64' at line 89. Checking for completion...
DEBUG: Sync for sle-module-server-applications15-sp7-updates-x86_64 still in progress (no completion message found).
DEBUG: Channel 'sle-module-desktop-applications15-sp7-pool-x86_64' not found in reposync.log
DEBUG: Channel 'sle-module-desktop-applications15-sp7-updates-x86_64' not found in reposync.log
DEBUG: Channel 'sle-module-devtools15-sp7-updates-x86_64' not found in reposync.log
DEBUG: Channel 'sle-module-devtools15-sp7-pool-x86_64' not found in reposync.log
DEBUG: Channel 'sle-module-systems-management-15-sp7-pool-x86_64' not found in reposync.log
DEBUG: Channel 'sle-module-systems-management-15-sp7-updates-x86_64' not found in reposync.log
DEBUG: Found channel 'sles15-sp7-devel-uyuni-client-x86_64' at line 97. Checking for completion...
DEBUG: Sync for sles15-sp7-devel-uyuni-client-x86_64 still in progress (no completion message found).
DEBUG: Channel 'sle-module-python3-15-sp7-pool-x86_64' not found in reposync.log
DEBUG: Channel 'sle-module-python3-15-sp7-updates-x86_64' not found in reposync.log
DEBUG: Found channel 'sle-module-server-applications15-sp7-updates-x86_64' at line 89. Checking for completion...
DEBUG: Found 'Sync of channel completed.' for sle-module-server-applications15-sp7-updates-x86_64 at line 93.
SUCCESS: sle-module-server-applications15-sp7-updates-x86_64 is fully synchronized.
DEBUG: Channel 'sle-module-desktop-applications15-sp7-pool-x86_64' not found in reposync.log
DEBUG: Channel 'sle-module-desktop-applications15-sp7-updates-x86_64' not found in reposync.log
DEBUG: Channel 'sle-module-devtools15-sp7-updates-x86_64' not found in reposync.log
DEBUG: Channel 'sle-module-devtools15-sp7-pool-x86_64' not found in reposync.log
DEBUG: Channel 'sle-module-systems-management-15-sp7-pool-x86_64' not found in reposync.log
DEBUG: Channel 'sle-module-systems-management-15-sp7-updates-x86_64' not found in reposync.log
DEBUG: Found channel 'sles15-sp7-devel-uyuni-client-x86_64' at line 97. Checking for completion...
DEBUG: Found 'Sync of channel completed.' for sles15-sp7-devel-uyuni-client-x86_64 at line 101.
SUCCESS: sles15-sp7-devel-uyuni-client-x86_64 is fully synchronized.
DEBUG: Channel 'sle-module-python3-15-sp7-pool-x86_64' not found in reposync.log
DEBUG: Found channel 'sle-module-python3-15-sp7-updates-x86_64' at line 105. Checking for completion...
DEBUG: Found 'Sync of channel completed.' for sle-module-python3-15-sp7-updates-x86_64 at line 109.
SUCCESS: sle-module-python3-15-sp7-updates-x86_64 is fully synchronized.
DEBUG: Channel 'sle-module-desktop-applications15-sp7-pool-x86_64' not found in reposync.log
DEBUG: Channel 'sle-module-desktop-applications15-sp7-updates-x86_64' not found in reposync.log
DEBUG: Channel 'sle-module-devtools15-sp7-updates-x86_64' not found in reposync.log
DEBUG: Channel 'sle-module-devtools15-sp7-pool-x86_64' not found in reposync.log
DEBUG: Channel 'sle-module-systems-management-15-sp7-pool-x86_64' not found in reposync.log
DEBUG: Channel 'sle-module-systems-management-15-sp7-updates-x86_64' not found in reposync.log
DEBUG: Found channel 'sle-module-python3-15-sp7-pool-x86_64' at line 113. Checking for completion...
DEBUG: Found 'Sync of channel completed.' for sle-module-python3-15-sp7-pool-x86_64 at line 117.
SUCCESS: sle-module-python3-15-sp7-pool-x86_64 is fully synchronized.
DEBUG: Channel 'sle-module-desktop-applications15-sp7-pool-x86_64' not found in reposync.log
DEBUG: Channel 'sle-module-desktop-applications15-sp7-updates-x86_64' not found in reposync.log
DEBUG: Channel 'sle-module-devtools15-sp7-updates-x86_64' not found in reposync.log
DEBUG: Channel 'sle-module-devtools15-sp7-pool-x86_64' not found in reposync.log
DEBUG: Channel 'sle-module-systems-management-15-sp7-pool-x86_64' not found in reposync.log
DEBUG: Found channel 'sle-module-systems-management-15-sp7-updates-x86_64' at line 121. Checking for completion...
DEBUG: Sync for sle-module-systems-management-15-sp7-updates-x86_64 still in progress (no completion message found).
4m / 64m waiting for product 'sles15-sp7' synchronization
DEBUG: Channel 'sle-module-desktop-applications15-sp7-pool-x86_64' not found in reposync.log
DEBUG: Channel 'sle-module-desktop-applications15-sp7-updates-x86_64' not found in reposync.log
DEBUG: Channel 'sle-module-devtools15-sp7-updates-x86_64' not found in reposync.log
DEBUG: Channel 'sle-module-devtools15-sp7-pool-x86_64' not found in reposync.log
DEBUG: Found channel 'sle-module-systems-management-15-sp7-pool-x86_64' at line 129. Checking for completion...
DEBUG: Sync for sle-module-systems-management-15-sp7-pool-x86_64 still in progress (no completion message found).
DEBUG: Found channel 'sle-module-systems-management-15-sp7-updates-x86_64' at line 121. Checking for completion...
DEBUG: Found 'Sync of channel completed.' for sle-module-systems-management-15-sp7-updates-x86_64 at line 125.
SUCCESS: sle-module-systems-management-15-sp7-updates-x86_64 is fully synchronized.
DEBUG: Channel 'sle-module-desktop-applications15-sp7-pool-x86_64' not found in reposync.log
DEBUG: Channel 'sle-module-desktop-applications15-sp7-updates-x86_64' not found in reposync.log
DEBUG: Channel 'sle-module-devtools15-sp7-updates-x86_64' not found in reposync.log
DEBUG: Channel 'sle-module-devtools15-sp7-pool-x86_64' not found in reposync.log
DEBUG: Found channel 'sle-module-systems-management-15-sp7-pool-x86_64' at line 129. Checking for completion...
DEBUG: Found 'Sync of channel completed.' for sle-module-systems-management-15-sp7-pool-x86_64 at line 133.
SUCCESS: sle-module-systems-management-15-sp7-pool-x86_64 is fully synchronized.
DEBUG: Found channel 'sle-module-desktop-applications15-sp7-pool-x86_64' at line 137. Checking for completion...
DEBUG: Sync for sle-module-desktop-applications15-sp7-pool-x86_64 still in progress (no completion message found).
DEBUG: Channel 'sle-module-desktop-applications15-sp7-updates-x86_64' not found in reposync.log
DEBUG: Channel 'sle-module-devtools15-sp7-updates-x86_64' not found in reposync.log
DEBUG: Channel 'sle-module-devtools15-sp7-pool-x86_64' not found in reposync.log
DEBUG: Found channel 'sle-module-desktop-applications15-sp7-pool-x86_64' at line 137. Checking for completion...
DEBUG: Sync for sle-module-desktop-applications15-sp7-pool-x86_64 still in progress (no completion message found).
DEBUG: Channel 'sle-module-desktop-applications15-sp7-updates-x86_64' not found in reposync.log
DEBUG: Channel 'sle-module-devtools15-sp7-updates-x86_64' not found in reposync.log
DEBUG: Channel 'sle-module-devtools15-sp7-pool-x86_64' not found in reposync.log
DEBUG: Found channel 'sle-module-desktop-applications15-sp7-pool-x86_64' at line 137. Checking for completion...
DEBUG: Sync for sle-module-desktop-applications15-sp7-pool-x86_64 still in progress (no completion message found).
DEBUG: Channel 'sle-module-desktop-applications15-sp7-updates-x86_64' not found in reposync.log
DEBUG: Channel 'sle-module-devtools15-sp7-updates-x86_64' not found in reposync.log
DEBUG: Channel 'sle-module-devtools15-sp7-pool-x86_64' not found in reposync.log
DEBUG: Found channel 'sle-module-desktop-applications15-sp7-pool-x86_64' at line 137. Checking for completion...
DEBUG: Sync for sle-module-desktop-applications15-sp7-pool-x86_64 still in progress (no completion message found).
DEBUG: Channel 'sle-module-desktop-applications15-sp7-updates-x86_64' not found in reposync.log
DEBUG: Channel 'sle-module-devtools15-sp7-updates-x86_64' not found in reposync.log
DEBUG: Channel 'sle-module-devtools15-sp7-pool-x86_64' not found in reposync.log
5m / 64m waiting for product 'sles15-sp7' synchronization
DEBUG: Found channel 'sle-module-desktop-applications15-sp7-pool-x86_64' at line 137. Checking for completion...
DEBUG: Sync for sle-module-desktop-applications15-sp7-pool-x86_64 still in progress (no completion message found).
DEBUG: Channel 'sle-module-desktop-applications15-sp7-updates-x86_64' not found in reposync.log
DEBUG: Channel 'sle-module-devtools15-sp7-updates-x86_64' not found in reposync.log
DEBUG: Channel 'sle-module-devtools15-sp7-pool-x86_64' not found in reposync.log
DEBUG: Found channel 'sle-module-desktop-applications15-sp7-pool-x86_64' at line 137. Checking for completion...
DEBUG: Sync for sle-module-desktop-applications15-sp7-pool-x86_64 still in progress (no completion message found).
DEBUG: Channel 'sle-module-desktop-applications15-sp7-updates-x86_64' not found in reposync.log
DEBUG: Channel 'sle-module-devtools15-sp7-updates-x86_64' not found in reposync.log
DEBUG: Channel 'sle-module-devtools15-sp7-pool-x86_64' not found in reposync.log
DEBUG: Found channel 'sle-module-desktop-applications15-sp7-pool-x86_64' at line 137. Checking for completion...
DEBUG: Sync for sle-module-desktop-applications15-sp7-pool-x86_64 still in progress (no completion message found).
DEBUG: Channel 'sle-module-desktop-applications15-sp7-updates-x86_64' not found in reposync.log
DEBUG: Channel 'sle-module-devtools15-sp7-updates-x86_64' not found in reposync.log
DEBUG: Channel 'sle-module-devtools15-sp7-pool-x86_64' not found in reposync.log
DEBUG: Found channel 'sle-module-desktop-applications15-sp7-pool-x86_64' at line 137. Checking for completion...
DEBUG: Sync for sle-module-desktop-applications15-sp7-pool-x86_64 still in progress (no completion message found).
DEBUG: Channel 'sle-module-desktop-applications15-sp7-updates-x86_64' not found in reposync.log
DEBUG: Channel 'sle-module-devtools15-sp7-updates-x86_64' not found in reposync.log
DEBUG: Channel 'sle-module-devtools15-sp7-pool-x86_64' not found in reposync.log
DEBUG: Found channel 'sle-module-desktop-applications15-sp7-pool-x86_64' at line 137. Checking for completion...
DEBUG: Sync for sle-module-desktop-applications15-sp7-pool-x86_64 still in progress (no completion message found).
DEBUG: Channel 'sle-module-desktop-applications15-sp7-updates-x86_64' not found in reposync.log
DEBUG: Channel 'sle-module-devtools15-sp7-updates-x86_64' not found in reposync.log
DEBUG: Channel 'sle-module-devtools15-sp7-pool-x86_64' not found in reposync.log
DEBUG: Found channel 'sle-module-desktop-applications15-sp7-pool-x86_64' at line 137. Checking for completion...
DEBUG: Sync for sle-module-desktop-applications15-sp7-pool-x86_64 still in progress (no completion message found).
DEBUG: Found channel 'sle-module-desktop-applications15-sp7-updates-x86_64' at line 145. Checking for completion...
DEBUG: Sync for sle-module-desktop-applications15-sp7-updates-x86_64 still in progress (no completion message found).
DEBUG: Channel 'sle-module-devtools15-sp7-updates-x86_64' not found in reposync.log
DEBUG: Channel 'sle-module-devtools15-sp7-pool-x86_64' not found in reposync.log
6m / 64m waiting for product 'sles15-sp7' synchronization
DEBUG: Found channel 'sle-module-desktop-applications15-sp7-pool-x86_64' at line 137. Checking for completion...
DEBUG: Found 'Sync of channel completed.' for sle-module-desktop-applications15-sp7-pool-x86_64 at line 141.
SUCCESS: sle-module-desktop-applications15-sp7-pool-x86_64 is fully synchronized.
DEBUG: Found channel 'sle-module-desktop-applications15-sp7-updates-x86_64' at line 145. Checking for completion...
DEBUG: Sync for sle-module-desktop-applications15-sp7-updates-x86_64 still in progress (no completion message found).
DEBUG: Channel 'sle-module-devtools15-sp7-updates-x86_64' not found in reposync.log
DEBUG: Channel 'sle-module-devtools15-sp7-pool-x86_64' not found in reposync.log
DEBUG: Found channel 'sle-module-desktop-applications15-sp7-updates-x86_64' at line 145. Checking for completion...
DEBUG: Sync for sle-module-desktop-applications15-sp7-updates-x86_64 still in progress (no completion message found).
DEBUG: Channel 'sle-module-devtools15-sp7-updates-x86_64' not found in reposync.log
DEBUG: Channel 'sle-module-devtools15-sp7-pool-x86_64' not found in reposync.log
DEBUG: Found channel 'sle-module-desktop-applications15-sp7-updates-x86_64' at line 145. Checking for completion...
DEBUG: Found 'Sync of channel completed.' for sle-module-desktop-applications15-sp7-updates-x86_64 at line 149.
SUCCESS: sle-module-desktop-applications15-sp7-updates-x86_64 is fully synchronized.
DEBUG: Channel 'sle-module-devtools15-sp7-updates-x86_64' not found in reposync.log
DEBUG: Channel 'sle-module-devtools15-sp7-pool-x86_64' not found in reposync.log
DEBUG: Found channel 'sle-module-devtools15-sp7-updates-x86_64' at line 153. Checking for completion...
DEBUG: Sync for sle-module-devtools15-sp7-updates-x86_64 still in progress (no completion message found).
DEBUG: Channel 'sle-module-devtools15-sp7-pool-x86_64' not found in reposync.log
DEBUG: Found channel 'sle-module-devtools15-sp7-updates-x86_64' at line 153. Checking for completion...
DEBUG: Sync for sle-module-devtools15-sp7-updates-x86_64 still in progress (no completion message found).
DEBUG: Channel 'sle-module-devtools15-sp7-pool-x86_64' not found in reposync.log
DEBUG: Found channel 'sle-module-devtools15-sp7-updates-x86_64' at line 153. Checking for completion...
DEBUG: Sync for sle-module-devtools15-sp7-updates-x86_64 still in progress (no completion message found).
DEBUG: Channel 'sle-module-devtools15-sp7-pool-x86_64' not found in reposync.log
7m / 64m waiting for product 'sles15-sp7' synchronization
DEBUG: Found channel 'sle-module-devtools15-sp7-updates-x86_64' at line 153. Checking for completion...
DEBUG: Sync for sle-module-devtools15-sp7-updates-x86_64 still in progress (no completion message found).
DEBUG: Channel 'sle-module-devtools15-sp7-pool-x86_64' not found in reposync.log
DEBUG: Found channel 'sle-module-devtools15-sp7-updates-x86_64' at line 153. Checking for completion...
DEBUG: Sync for sle-module-devtools15-sp7-updates-x86_64 still in progress (no completion message found).
DEBUG: Channel 'sle-module-devtools15-sp7-pool-x86_64' not found in reposync.log
DEBUG: Found channel 'sle-module-devtools15-sp7-updates-x86_64' at line 153. Checking for completion...
DEBUG: Sync for sle-module-devtools15-sp7-updates-x86_64 still in progress (no completion message found).
DEBUG: Channel 'sle-module-devtools15-sp7-pool-x86_64' not found in reposync.log
DEBUG: Found channel 'sle-module-devtools15-sp7-updates-x86_64' at line 153. Checking for completion...
DEBUG: Sync for sle-module-devtools15-sp7-updates-x86_64 still in progress (no completion message found).
DEBUG: Channel 'sle-module-devtools15-sp7-pool-x86_64' not found in reposync.log
DEBUG: Found channel 'sle-module-devtools15-sp7-updates-x86_64' at line 153. Checking for completion...
DEBUG: Sync for sle-module-devtools15-sp7-updates-x86_64 still in progress (no completion message found).
DEBUG: Channel 'sle-module-devtools15-sp7-pool-x86_64' not found in reposync.log
DEBUG: Found channel 'sle-module-devtools15-sp7-updates-x86_64' at line 153. Checking for completion...
DEBUG: Sync for sle-module-devtools15-sp7-updates-x86_64 still in progress (no completion message found).
DEBUG: Channel 'sle-module-devtools15-sp7-pool-x86_64' not found in reposync.log
8m / 64m waiting for product 'sles15-sp7' synchronization
DEBUG: Found channel 'sle-module-devtools15-sp7-updates-x86_64' at line 153. Checking for completion...
DEBUG: Sync for sle-module-devtools15-sp7-updates-x86_64 still in progress (no completion message found).
DEBUG: Channel 'sle-module-devtools15-sp7-pool-x86_64' not found in reposync.log
DEBUG: Found channel 'sle-module-devtools15-sp7-updates-x86_64' at line 153. Checking for completion...
DEBUG: Sync for sle-module-devtools15-sp7-updates-x86_64 still in progress (no completion message found).
DEBUG: Channel 'sle-module-devtools15-sp7-pool-x86_64' not found in reposync.log
DEBUG: Found channel 'sle-module-devtools15-sp7-updates-x86_64' at line 153. Checking for completion...
DEBUG: Sync for sle-module-devtools15-sp7-updates-x86_64 still in progress (no completion message found).
DEBUG: Channel 'sle-module-devtools15-sp7-pool-x86_64' not found in reposync.log
DEBUG: Found channel 'sle-module-devtools15-sp7-updates-x86_64' at line 153. Checking for completion...
DEBUG: Sync for sle-module-devtools15-sp7-updates-x86_64 still in progress (no completion message found).
DEBUG: Channel 'sle-module-devtools15-sp7-pool-x86_64' not found in reposync.log
DEBUG: Found channel 'sle-module-devtools15-sp7-updates-x86_64' at line 153. Checking for completion...
DEBUG: Sync for sle-module-devtools15-sp7-updates-x86_64 still in progress (no completion message found).
DEBUG: Channel 'sle-module-devtools15-sp7-pool-x86_64' not found in reposync.log
DEBUG: Found channel 'sle-module-devtools15-sp7-updates-x86_64' at line 153. Checking for completion...
DEBUG: Sync for sle-module-devtools15-sp7-updates-x86_64 still in progress (no completion message found).
DEBUG: Channel 'sle-module-devtools15-sp7-pool-x86_64' not found in reposync.log
9m / 64m waiting for product 'sles15-sp7' synchronization
DEBUG: Found channel 'sle-module-devtools15-sp7-updates-x86_64' at line 153. Checking for completion...
DEBUG: Sync for sle-module-devtools15-sp7-updates-x86_64 still in progress (no completion message found).
DEBUG: Channel 'sle-module-devtools15-sp7-pool-x86_64' not found in reposync.log
DEBUG: Found channel 'sle-module-devtools15-sp7-updates-x86_64' at line 153. Checking for completion...
DEBUG: Sync for sle-module-devtools15-sp7-updates-x86_64 still in progress (no completion message found).
DEBUG: Channel 'sle-module-devtools15-sp7-pool-x86_64' not found in reposync.log
DEBUG: Found channel 'sle-module-devtools15-sp7-updates-x86_64' at line 153. Checking for completion...
DEBUG: Sync for sle-module-devtools15-sp7-updates-x86_64 still in progress (no completion message found).
DEBUG: Channel 'sle-module-devtools15-sp7-pool-x86_64' not found in reposync.log
DEBUG: Found channel 'sle-module-devtools15-sp7-updates-x86_64' at line 153. Checking for completion...
DEBUG: Sync for sle-module-devtools15-sp7-updates-x86_64 still in progress (no completion message found).
DEBUG: Channel 'sle-module-devtools15-sp7-pool-x86_64' not found in reposync.log
DEBUG: Found channel 'sle-module-devtools15-sp7-updates-x86_64' at line 153. Checking for completion...
DEBUG: Sync for sle-module-devtools15-sp7-updates-x86_64 still in progress (no completion message found).
DEBUG: Channel 'sle-module-devtools15-sp7-pool-x86_64' not found in reposync.log
DEBUG: Found channel 'sle-module-devtools15-sp7-updates-x86_64' at line 153. Checking for completion...
DEBUG: Sync for sle-module-devtools15-sp7-updates-x86_64 still in progress (no completion message found).
DEBUG: Channel 'sle-module-devtools15-sp7-pool-x86_64' not found in reposync.log
10m / 64m waiting for product 'sles15-sp7' synchronization
DEBUG: Found channel 'sle-module-devtools15-sp7-updates-x86_64' at line 153. Checking for completion...
DEBUG: Sync for sle-module-devtools15-sp7-updates-x86_64 still in progress (no completion message found).
DEBUG: Channel 'sle-module-devtools15-sp7-pool-x86_64' not found in reposync.log
DEBUG: Found channel 'sle-module-devtools15-sp7-updates-x86_64' at line 153. Checking for completion...
DEBUG: Sync for sle-module-devtools15-sp7-updates-x86_64 still in progress (no completion message found).
DEBUG: Channel 'sle-module-devtools15-sp7-pool-x86_64' not found in reposync.log
DEBUG: Found channel 'sle-module-devtools15-sp7-updates-x86_64' at line 153. Checking for completion...
DEBUG: Sync for sle-module-devtools15-sp7-updates-x86_64 still in progress (no completion message found).
DEBUG: Channel 'sle-module-devtools15-sp7-pool-x86_64' not found in reposync.log
DEBUG: Found channel 'sle-module-devtools15-sp7-updates-x86_64' at line 153. Checking for completion...
DEBUG: Sync for sle-module-devtools15-sp7-updates-x86_64 still in progress (no completion message found).
DEBUG: Channel 'sle-module-devtools15-sp7-pool-x86_64' not found in reposync.log
DEBUG: Found channel 'sle-module-devtools15-sp7-updates-x86_64' at line 153. Checking for completion...
DEBUG: Sync for sle-module-devtools15-sp7-updates-x86_64 still in progress (no completion message found).
DEBUG: Channel 'sle-module-devtools15-sp7-pool-x86_64' not found in reposync.log
DEBUG: Found channel 'sle-module-devtools15-sp7-updates-x86_64' at line 153. Checking for completion...
DEBUG: Sync for sle-module-devtools15-sp7-updates-x86_64 still in progress (no completion message found).
DEBUG: Channel 'sle-module-devtools15-sp7-pool-x86_64' not found in reposync.log
11m / 64m waiting for product 'sles15-sp7' synchronization
DEBUG: Found channel 'sle-module-devtools15-sp7-updates-x86_64' at line 153. Checking for completion...
DEBUG: Sync for sle-module-devtools15-sp7-updates-x86_64 still in progress (no completion message found).
DEBUG: Channel 'sle-module-devtools15-sp7-pool-x86_64' not found in reposync.log
DEBUG: Found channel 'sle-module-devtools15-sp7-updates-x86_64' at line 153. Checking for completion...
DEBUG: Sync for sle-module-devtools15-sp7-updates-x86_64 still in progress (no completion message found).
DEBUG: Channel 'sle-module-devtools15-sp7-pool-x86_64' not found in reposync.log
DEBUG: Found channel 'sle-module-devtools15-sp7-updates-x86_64' at line 153. Checking for completion...
DEBUG: Sync for sle-module-devtools15-sp7-updates-x86_64 still in progress (no completion message found).
DEBUG: Channel 'sle-module-devtools15-sp7-pool-x86_64' not found in reposync.log
DEBUG: Found channel 'sle-module-devtools15-sp7-updates-x86_64' at line 153. Checking for completion...
DEBUG: Sync for sle-module-devtools15-sp7-updates-x86_64 still in progress (no completion message found).
DEBUG: Channel 'sle-module-devtools15-sp7-pool-x86_64' not found in reposync.log
DEBUG: Found channel 'sle-module-devtools15-sp7-updates-x86_64' at line 153. Checking for completion...
DEBUG: Sync for sle-module-devtools15-sp7-updates-x86_64 still in progress (no completion message found).
DEBUG: Channel 'sle-module-devtools15-sp7-pool-x86_64' not found in reposync.log
DEBUG: Found channel 'sle-module-devtools15-sp7-updates-x86_64' at line 153. Checking for completion...
DEBUG: Sync for sle-module-devtools15-sp7-updates-x86_64 still in progress (no completion message found).
DEBUG: Channel 'sle-module-devtools15-sp7-pool-x86_64' not found in reposync.log
12m / 64m waiting for product 'sles15-sp7' synchronization
DEBUG: Found channel 'sle-module-devtools15-sp7-updates-x86_64' at line 153. Checking for completion...
DEBUG: Found 'Sync of channel completed.' for sle-module-devtools15-sp7-updates-x86_64 at line 157.
SUCCESS: sle-module-devtools15-sp7-updates-x86_64 is fully synchronized.
DEBUG: Found channel 'sle-module-devtools15-sp7-pool-x86_64' at line 161. Checking for completion...
DEBUG: Sync for sle-module-devtools15-sp7-pool-x86_64 still in progress (no completion message found).
DEBUG: Found channel 'sle-module-devtools15-sp7-pool-x86_64' at line 161. Checking for completion...
DEBUG: Sync for sle-module-devtools15-sp7-pool-x86_64 still in progress (no completion message found).
DEBUG: Found channel 'sle-module-devtools15-sp7-pool-x86_64' at line 161. Checking for completion...
DEBUG: Sync for sle-module-devtools15-sp7-pool-x86_64 still in progress (no completion message found).
DEBUG: Found channel 'sle-module-devtools15-sp7-pool-x86_64' at line 161. Checking for completion...
DEBUG: Sync for sle-module-devtools15-sp7-pool-x86_64 still in progress (no completion message found).
DEBUG: Found channel 'sle-module-devtools15-sp7-pool-x86_64' at line 161. Checking for completion...
DEBUG: Sync for sle-module-devtools15-sp7-pool-x86_64 still in progress (no completion message found).
DEBUG: Found channel 'sle-module-devtools15-sp7-pool-x86_64' at line 161. Checking for completion...
DEBUG: Sync for sle-module-devtools15-sp7-pool-x86_64 still in progress (no completion message found).
13m / 64m waiting for product 'sles15-sp7' synchronization
DEBUG: Found channel 'sle-module-devtools15-sp7-pool-x86_64' at line 161. Checking for completion...
DEBUG: Sync for sle-module-devtools15-sp7-pool-x86_64 still in progress (no completion message found).
DEBUG: Found channel 'sle-module-devtools15-sp7-pool-x86_64' at line 161. Checking for completion...
DEBUG: Sync for sle-module-devtools15-sp7-pool-x86_64 still in progress (no completion message found).
DEBUG: Found channel 'sle-module-devtools15-sp7-pool-x86_64' at line 161. Checking for completion...
DEBUG: Sync for sle-module-devtools15-sp7-pool-x86_64 still in progress (no completion message found).
DEBUG: Found channel 'sle-module-devtools15-sp7-pool-x86_64' at line 161. Checking for completion...
DEBUG: Sync for sle-module-devtools15-sp7-pool-x86_64 still in progress (no completion message found).
DEBUG: Found channel 'sle-module-devtools15-sp7-pool-x86_64' at line 161. Checking for completion...
DEBUG: Found 'Sync of channel completed.' for sle-module-devtools15-sp7-pool-x86_64 at line 165.
SUCCESS: sle-module-devtools15-sp7-pool-x86_64 is fully synchronized.

Given I am authorized for the "Admin" section 447ms

When I follow the left menu "Admin > Setup Wizard > Products" 172ms

And I wait until I do not see "currently running" text 83ms

And I wait until I do not see "Loading" text 746ms

And I enter "SUSE Linux Enterprise Server 15 SP7 x86_64" as the filtered product description 155ms

And I select "SUSE Linux Enterprise Server 15 SP7 x86_64" as a product 75ms

Then I should see the "SUSE Linux Enterprise Server 15 SP7 x86_64" selected 30ms

When I open the sub-list of the product "SUSE Linux Enterprise Server 15 SP7 x86_64" 59ms

And I open the sub-list of the product "Basesystem Module 15 SP7 x86_64" 60ms

And I select "Desktop Applications Module 15 SP7 x86_64" as a product 68ms

Then I should see the "Desktop Applications Module 15 SP7 x86_64" selected 25ms

When I open the sub-list of the product "Desktop Applications Module 15 SP7 x86_64" 55ms

And I select "Development Tools Module 15 SP7 x86_64" as a product 66ms

Then I should see the "Development Tools Module 15 SP7 x86_64" selected 26ms

When I click the Add Product button 60ms

And I wait until I see "Selected channels/products were scheduled successfully for syncing." text 10s 157ms

Then the SLE15 SP7 product should be added 5s 445ms

When I use spacewalk-common-channel to add channel "sles15-sp7-devel-uyuni-client" with arch "x86_64" 12s 996ms

And I wait until I see "SUSE Linux Enterprise Server 15 SP7 x86_64" product has been added 17ms

And I wait until all synchronized channels for "sles15-sp7" have finished 53m 52s 146ms

@proxy @susemanager @transactional_server
Scenario:
Add SL Micro 6.2 as base OS for proxy
< 1ms 14

Given I am authorized for the "Admin" section 0s

When I follow the left menu "Admin > Setup Wizard > Products" 0s

And I wait until I do not see "currently running" text 0s

And I wait until I do not see "Loading" text 0s

And I enter "SUSE Linux Micro 6.2" as the filtered product description 0s

And I select "SUSE Linux Micro 6.2 x86_64" as a product 0s

Then I should see the "SUSE Linux Micro 6.2 x86_64" selected 0s

When I open the sub-list of the product "SUSE Linux Micro 6.2 x86_64" 0s

And I select "SUSE Multi-Linux Manager Client Tools for SLE 16 x86_64" as a product 0s

And I should see the "SUSE Multi-Linux Manager Client Tools for SLE 16 x86_64" selected 0s

And I click the Add Product button 0s

And I wait until I see "Selected channels/products were scheduled successfully for syncing." text 0s

And I wait until I see "SUSE Linux Micro 6.2 x86_64" product has been added 0s

And I wait until all synchronized channels for "sl-micro-6.2" have finished 0s

@proxy @susemanager @skip_if_transactional_server
Scenario:
Add SLES 15 SP7 as base OS for proxy
< 1ms 11

Given I am authorized for the "Admin" section 0s

When I follow the left menu "Admin > Setup Wizard > Products" 0s

And I wait until I do not see "currently running" text 0s

And I wait until I do not see "Loading" text 0s

And I enter "SUSE Linux Enterprise Server 15 SP7" as the filtered product description 0s

And I select "SUSE Linux Enterprise Server 15 SP7" as a product 0s

Then I should see the "SUSE Linux Enterprise Server 15 SP7" selected 0s

When I click the Add Product button 0s

And I wait until I see "Selected channels/products were scheduled successfully for syncing." text 0s

And I wait until I see "SUSE Linux Enterprise Server 15 SP7" product has been added 0s

And I wait until all synchronized channels for "sles15-sp7" have finished 0s

Given I am authorized for the "Admin" section 0s

When I follow the left menu "Admin > Setup Wizard > Products" 0s

And I wait until I do not see "currently running" text 0s

And I wait until I do not see "Loading" text 0s

And I enter "SUSE Linux Micro 6.2" as the filtered product description 0s

When I open the sub-list of the product "SUSE Linux Micro 6.2 x86_64" 0s

And I select "SUSE Linux Micro 6.2 x86_64" as a product 0s

And I select "SUSE Multi-Linux Manager Proxy Extension 5.2 x86_64 (BETA)" as a product 0s

Then I should see the "SUSE Multi-Linux Manager Proxy Extension 5.2 x86_64 (BETA)" selected 0s

When I click the Add Product button 0s

And I wait until I see "Selected channels/products were scheduled successfully for syncing." text 0s

And I wait until I see "SUSE Multi-Linux Manager Proxy Extension 5.2 x86_64 (BETA)" product has been added 0s

And I wait until all synchronized channels for "suse-multi-linux-manager-proxy-52" have finished 0s

Given I am authorized for the "Admin" section 0s

When I follow the left menu "Admin > Setup Wizard > Products" 0s

And I wait until I do not see "currently running" text 0s

And I wait until I do not see "Loading" text 0s

And I enter "SUSE Linux Enterprise Server 15 SP7" as the filtered product description 0s

When I open the sub-list of the product "SUSE Linux Enterprise Server 15 SP7 x86_64" 0s

And I select "SUSE Multi-Linux Manager Proxy Extension 5.1 x86_64" as a product 0s

Then I should see the "SUSE Multi-Linux Manager Proxy Extension 5.1 x86_64" selected 0s

When I click the Add Product button 0s

And I wait until I see "Selected channels/products were scheduled successfully for syncing." text 0s

And I wait until I see "SUSE Multi-Linux Manager Proxy Extension 5.1 x86_64" product has been added 0s

And I wait until all synchronized channels for "suse-multi-linux-manager-proxy-51-sp7" have finished 0s

Given I am authorized for the "Admin" section 0s

When I follow the left menu "Admin > Setup Wizard > Products" 0s

And I wait until I do not see "currently running" text 0s

And I wait until I do not see "Loading" text 0s

And I enter "SUSE Linux Micro 6.2" as the filtered product description 0s

When I open the sub-list of the product "SUSE Linux Micro 6.2 x86_64" 0s

And I select "SUSE Linux Micro 6.2 x86_64" as a product 0s

And I select "SUSE Multi-Linux Manager Retail Branch Server Extension 5.2 x86_64 (BETA)" as a product 0s

Then I should see the "SUSE Multi-Linux Manager Retail Branch Server Extension 5.2 x86_64 (BETA)" selected 0s

When I click the Add Product button 0s

And I wait until I see "Selected channels/products were scheduled successfully for syncing." text 0s

And I wait until I see "SUSE Multi-Linux Manager Retail Branch Server Extension 5.2 x86_64 (BETA)" product has been added 0s

And I wait until all synchronized channels for "suse-multi-linux-manager-retail-branch-server-52" have finished 0s

Given I am authorized for the "Admin" section 0s

When I follow the left menu "Admin > Setup Wizard > Products" 0s

And I wait until I do not see "currently running" text 0s

And I wait until I do not see "Loading" text 0s

And I enter "SUSE Linux Enterprise Server 15 SP7" as the filtered product description 0s

When I open the sub-list of the product "SUSE Linux Enterprise Server 15 SP7 x86_64" 0s

And I select "SUSE Multi-Linux Manager Retail Branch Server Extension 5.1 x86_64" as a product 0s

Then I should see the "SUSE Multi-Linux Manager Retail Branch Server Extension 5.1 x86_64" selected 0s

When I click the Add Product button 0s

And I wait until I see "Selected channels/products were scheduled successfully for syncing." text 0s

And I wait until I see "SUSE Multi-Linux Manager Retail Branch Server Extension 5.1 x86_64" product has been added 0s

And I wait until all synchronized channels for "suma-retail-branch-server-extension-51-sp7" have finished 0s

When I execute mgr-sync "list channels" with user "admin" and password "admin" 0s

And I should get " [I] SLE15-SP7-Installer-Updates for x86_64 SUSE Linux Enterprise Server 15 SP7 x86_64 [sle15-sp7-installer-updates-x86_64]" 0s

INFO: Channel opensuse_tumbleweed-x86_64 synchronization took 1 seconds.
SUCCESS: Channel opensuse_tumbleweed-uyuni-client-x86_64 initialized. No '.new' files and repo size > 0.
INFO: Channel opensuse_tumbleweed-uyuni-client-x86_64 synchronization took 13 seconds.
SUCCESS: Channel opensuse_tumbleweed-uyuni-client-devel-x86_64 initialized. No '.new' files and repo size > 0.
INFO: Channel opensuse_tumbleweed-uyuni-client-devel-x86_64 synchronization took 12 seconds.
INFO: Channel opensuse_tumbleweed-x86_64 synchronization took 1 seconds.
SUCCESS: Channel opensuse_tumbleweed-uyuni-client-devel-x86_64 initialized. No '.new' files and repo size > 0.
INFO: Channel opensuse_tumbleweed-uyuni-client-devel-x86_64 synchronization took 12 seconds.
SUCCESS: Channel uyuni-proxy-devel-tumbleweed-x86_64 initialized. No '.new' files and repo size > 0.
INFO: Channel uyuni-proxy-devel-tumbleweed-x86_64 synchronization took 9 seconds.
SUCCESS: Channel sle-product-sles15-sp7-pool-x86_64 initialized. No '.new' files and repo size > 0.
INFO: Channel sle-product-sles15-sp7-pool-x86_64 synchronization took 10 seconds.
SUCCESS: Channel sle-product-sles15-sp7-updates-x86_64 initialized. No '.new' files and repo size > 0.
INFO: Channel sle-product-sles15-sp7-updates-x86_64 synchronization took 7 seconds.
SUCCESS: Channel sle15-sp7-installer-updates-x86_64 initialized. No '.new' files and repo size > 0.
INFO: Channel sle15-sp7-installer-updates-x86_64 synchronization took 6 seconds.
SUCCESS: Channel sle-module-basesystem15-sp7-pool-x86_64 initialized. No '.new' files and repo size > 0.
INFO: Channel sle-module-basesystem15-sp7-pool-x86_64 synchronization took 355 seconds.
SUCCESS: Channel sle-module-basesystem15-sp7-updates-x86_64 initialized. No '.new' files and repo size > 0.
INFO: Channel sle-module-basesystem15-sp7-updates-x86_64 synchronization took 1072 seconds.
SUCCESS: Channel sle-module-python3-15-sp7-pool-x86_64 initialized. No '.new' files and repo size > 0.
INFO: Channel sle-module-python3-15-sp7-pool-x86_64 synchronization took 50 seconds.
SUCCESS: Channel sle-module-python3-15-sp7-updates-x86_64 initialized. No '.new' files and repo size > 0.
INFO: Channel sle-module-python3-15-sp7-updates-x86_64 synchronization took 43 seconds.
SUCCESS: Channel sle-module-server-applications15-sp7-pool-x86_64 initialized. No '.new' files and repo size > 0.
INFO: Channel sle-module-server-applications15-sp7-pool-x86_64 synchronization took 60 seconds.
SUCCESS: Channel sle-module-server-applications15-sp7-updates-x86_64 initialized. No '.new' files and repo size > 0.
INFO: Channel sle-module-server-applications15-sp7-updates-x86_64 synchronization took 123 seconds.
SUCCESS: Channel sle-module-desktop-applications15-sp7-pool-x86_64 initialized. No '.new' files and repo size > 0.
INFO: Channel sle-module-desktop-applications15-sp7-pool-x86_64 synchronization took 312 seconds.
SUCCESS: Channel sle-module-desktop-applications15-sp7-updates-x86_64 initialized. No '.new' files and repo size > 0.
INFO: Channel sle-module-desktop-applications15-sp7-updates-x86_64 synchronization took 79 seconds.
SUCCESS: Channel sle-module-devtools15-sp7-updates-x86_64 initialized. No '.new' files and repo size > 0.
INFO: Channel sle-module-devtools15-sp7-updates-x86_64 synchronization took 715 seconds.
SUCCESS: Channel sle-module-devtools15-sp7-pool-x86_64 initialized. No '.new' files and repo size > 0.
INFO: Channel sle-module-devtools15-sp7-pool-x86_64 synchronization took 178 seconds.
SUCCESS: Channel sle-module-systems-management-15-sp7-pool-x86_64 initialized. No '.new' files and repo size > 0.
INFO: Channel sle-module-systems-management-15-sp7-pool-x86_64 synchronization took 26 seconds.
SUCCESS: Channel sle-module-systems-management-15-sp7-updates-x86_64 initialized. No '.new' files and repo size > 0.
INFO: Channel sle-module-systems-management-15-sp7-updates-x86_64 synchronization took 35 seconds.
SUCCESS: Channel sles15-sp7-devel-uyuni-client-x86_64 initialized. No '.new' files and repo size > 0.
INFO: Channel sles15-sp7-devel-uyuni-client-x86_64 synchronization took 29 seconds.

When I wait until all synchronized channels have solved their dependencies 4m 56s 753ms

Then all channels have been synced without errors < 1ms

@scc_credentials @skip_if_github_validation
Scenario:
Detect product loading issues from the UI
43s 464ms 7

Given I am authorized for the "Admin" section 1s 149ms

When I follow the left menu "Admin > Setup Wizard > Products" 214ms

And I wait until I see "Setup Wizard" text 84ms

And I wait until I do not see "Loading" text 745ms

Then I should not see a "Operation not successful" text 124ms

And I select "250" from "pageSize" 1s 139ms

And I should only see success signs in the product list 40s 7ms

When I report the synchronization duration for "sles15-sp7" < 1ms

In Order to distribute software to the clients
As an authorized user
I want to create fake channels for each distribution

Given I am authorized for the "Admin" section 492ms

When I follow the left menu "Software > Manage > Channels" 196ms

And I follow "Create Channel" 315ms

And I enter "Fake-Base-Channel-SUSE-like" as "Channel Name" 101ms

And I enter "fake-base-channel-suse-like" as "Channel Label" 87ms

And I select "None" from "Parent Channel" 60ms

And I select "x86_64" from "Architecture:" 50ms

And I enter "Base channel for testing" as "Channel Summary" 88ms

And I enter "No more description for base channel." as "Channel Description" 97ms

And I click on "Create Channel" 628ms

Then I should see a "Channel Fake-Base-Channel-SUSE-like created." text 77ms

When I follow the left menu "Software > Manage > Channels" 76ms

And I follow "Create Channel" 302ms

And I enter "Fake-Child-Channel-SUSE-like" as "Channel Name" 79ms

And I enter "fake-child-channel-suse-like" as "Channel Label" 80ms

And I select "Fake-Base-Channel-SUSE-like" from "Parent Channel" 75ms

And I select "x86_64" from "Architecture:" 37ms

And I enter "Child channel for testing" as "Channel Summary" 80ms

And I enter "Description for Fake Child Channel SUSE like." as "Channel Description" 94ms

And I click on "Create Channel" 56ms

Then I should see a "Channel Fake-Child-Channel-SUSE-like created." text 82ms

When I follow the left menu "Software > Manage > Channels" 76ms

And I follow "Create Channel" 319ms

And I enter "Fake-RPM-SUSE-Channel" as "Channel Name" 74ms

And I enter "fake-rpm-suse-channel" as "Channel Label" 81ms

And I select the parent channel for the "sle_minion" from "Parent Channel" 48ms

And I select "x86_64" from "Architecture:" 37ms

And I enter "Fake-RPM-SUSE-Channel for testing" as "Channel Summary" 87ms

And I enter "Description for Fake-RPM-SUSE-Channel Child Channel." as "Channel Description" 101ms

And I click on "Create Channel" 55ms

Then I should see a "Channel Fake-RPM-SUSE-Channel created." text 85ms

When I follow the left menu "Software > Manage > Channels" 70ms

And I follow "Create Channel" 322ms

And I enter "Fake-Base-Channel-i586" as "Channel Name" 76ms

And I enter "fake-base-channel-i586" as "Channel Label" 73ms

And I select "None" from "Parent Channel" 39ms

And I select "IA-32" from "Architecture:" 68ms

And I enter "Fake-Base-Channel-i586 channel for testing" as "Channel Summary" 105ms

And I enter "No more description for base channel." as "Channel Description" 84ms

And I click on "Create Channel" 477ms

Then I should see a "Channel Fake-Base-Channel-i586 created." text 76ms

When I follow the left menu "Software > Manage > Channels" 70ms

And I follow "Create Channel" 360ms

And I enter "Fake-Child-Channel-i586" as "Channel Name" 74ms

And I enter "fake-child-channel-i586" as "Channel Label" 72ms

And I select "Fake-Base-Channel-i586" from "Parent Channel" 64ms

And I select "IA-32" from "Architecture:" 37ms

And I enter "Fake Child Channel i586 for testing" as "Channel Summary" 87ms

And I enter "Description for Fake Child Channel i586." as "Channel Description" 83ms

And I click on "Create Channel" 562ms

Then I should see a "Channel Fake-Child-Channel-i586 created." text 74ms

When I follow the left menu "Software > Manage > Channels" 72ms

And I follow "Create Channel" 434ms

And I enter "Test-Base-Channel-x86_64" as "Channel Name" 78ms

And I enter "test-base-channel-x86_64" as "Channel Label" 75ms

And I select "None" from "Parent Channel" 41ms

And I select "x86_64" from "Architecture:" 36ms

And I enter "Test-Base-Channel-x86_64 channel for testing" as "Channel Summary" 97ms

And I enter "No more description for base channel." as "Channel Description" 89ms

And I click on "Create Channel" 608ms

Then I should see a "Channel Test-Base-Channel-x86_64 created." text 77ms

When I follow the left menu "Software > Manage > Channels" 72ms

And I follow "Create Channel" 340ms

And I enter "Test-Child-Channel-x86_64" as "Channel Name" 76ms

And I enter "test-child-channel-x86_64" as "Channel Label" 75ms

And I select "Test-Base-Channel-x86_64" from "Parent Channel" 60ms

And I select "x86_64" from "Architecture:" 37ms

And I enter "Test-Child-Channel-x86_64 channel for testing" as "Channel Summary" 97ms

And I enter "Description for Test-Child-Channel-x86_64 Channel." as "Channel Description" 97ms

And I click on "Create Channel" 500ms

Then I should see a "Channel Test-Child-Channel-x86_64 created." text 78ms

When I follow the left menu "Software > Manage > Channels" 0s

And I follow "Create Channel" 0s

And I enter "Fake-RPM-Terminal-Channel" as "Channel Name" 0s

And I enter "fake-rpm-terminal-channel" as "Channel Label" 0s

And I select the parent channel for the "pxeboot_minion" from "Parent Channel" 0s

And I select "x86_64" from "Architecture:" 0s

And I enter "Fake-RPM-Terminal-Channel for testing" as "Channel Summary" 0s

And I enter "Description for Fake-RPM-Terminal-Channel Child Channel." as "Channel Description" 0s

And I click on "Create Channel" 0s

Then I should see a "Channel Fake-RPM-Terminal-Channel created." text 0s

When I follow the left menu "Software > Manage > Channels" 75ms

And I follow "Create Channel" 267ms

And I enter "Fake-Base-Channel-Debian-like" as "Channel Name" 79ms

And I enter "fake-base-channel-debian-like" as "Channel Label" 79ms

And I select "None" from "Parent Channel" 40ms

And I select "AMD64 Debian" from "Architecture:" 59ms

And I enter "Fake-Base-Channel-Debian-like for testing" as "Channel Summary" 92ms

And I enter "No more description for base channel." as "Channel Description" 84ms

And I uncheck "gpg_check" 10s 88ms

And I click on "Create Channel" 619ms

Then I should see a "Channel Fake-Base-Channel-Debian-like created." text 82ms

When I follow the left menu "Software > Manage > Channels" 72ms

And I follow "Create Channel" 431ms

And I enter "Fake-Base-Channel-RH-like" as "Channel Name" 81ms

And I enter "fake-base-channel-rh-like" as "Channel Label" 73ms

And I select "None" from "Parent Channel" 41ms

And I select "x86_64" from "Architecture:" 44ms

And I enter "Fake-Base-Channel-RH-like for testing" as "Channel Summary" 88ms

And I enter "No more description for base channel." as "Channel Description" 88ms

And I click on "Create Channel" 627ms

Then I should see a "Channel Fake-Base-Channel-RH-like created." text 76ms

When I follow the left menu "Software > Manage > Channels" 72ms

And I follow "Create Channel" 354ms

And I enter "Fake-Base-Channel-AppStream" as "Channel Name" 81ms

And I enter "fake-base-channel-appstream" as "Channel Label" 79ms

And I select "None" from "Parent Channel" 40ms

And I select "x86_64" from "Architecture:" 38ms

And I enter "Fake-Base-Channel-AppStream for testing" as "Channel Summary" 94ms

And I enter "Description for Fake-Base-Channel-AppStream." as "Channel Description" 93ms

And I click on "Create Channel" 599ms

Then I should see a "Channel Fake-Base-Channel-AppStream created." text 75ms

In order to distribute software to the clients
As an authorized user
I want to create a fake repository per fake child channel

Given I am authorized for the "Admin" section 821ms

When I follow the left menu "Software > Manage > Repositories" 175ms

And I follow "Create Repository" 398ms

And I enter "fake-rpm-repo" as "label" 61ms

And I enter "http://localhost/pub/TestRepoRpmUpdates/" as "url" 93ms

And I click on "Create Repository" 61ms

Then I should see a "Repository created successfully" text 67ms

And I should see "metadataSigned" as checked 19ms

When I follow the left menu "Software > Manage > Repositories" 73ms

And I follow "fake-rpm-repo" 288ms

And I uncheck "metadataSigned" 10s 58ms

And I click on "Update Repository" 558ms

Then I should see a "Repository updated successfully" text 64ms

And I should see "metadataSigned" as unchecked 16ms

When I follow the left menu "Software > Manage > Repositories" 73ms

And I follow "Create Repository" 308ms

And I enter "fake-appstream-repo" as "label" 65ms

And I enter "http://localhost/pub/TestRepoAppStream/" as "url" 86ms

And I click on "Create Repository" 416ms

Then I should see a "Repository created successfully" text 65ms

And I should see "metadataSigned" as checked 16ms

When I follow the left menu "Software > Manage > Repositories" 76ms

And I follow "fake-appstream-repo" 318ms

And I uncheck "metadataSigned" 10s 75ms

And I click on "Update Repository" 1s 178ms

Then I should see a "Repository updated successfully" text 65ms

And I should see "metadataSigned" as unchecked 17ms

When I follow the left menu "Software > Manage > Channels" 83ms

And I follow "Fake-RPM-SUSE-Channel" 458ms

And I enter "file:///etc/pki/rpm-gpg/uyuni-tools-gpg-pubkey-0d20833e.key" as "GPG key URL" 122ms

And I click on "Update Channel" 581ms

Then I should see a "Channel Fake-RPM-SUSE-Channel updated" text 76ms

When I follow "Repositories" in the content area 73ms

And I select the "fake-rpm-repo" repo 57ms

And I click on "Save Repositories" 658ms

Then I should see a "Fake-RPM-SUSE-Channel repository information was successfully updated" text 70ms

When I follow the left menu "Software > Manage > Channels" 71ms

And I follow "Test-Child-Channel-x86_64" 443ms

And I enter "file:///etc/pki/rpm-gpg/uyuni-tools-gpg-pubkey-0d20833e.key" as "GPG key URL" 109ms

And I click on "Update Channel" 518ms

Then I should see a "Channel Test-Child-Channel-x86_64 updated" text 79ms

When I follow "Repositories" in the content area 65ms

And I select the "fake-rpm-repo" repo 52ms

And I click on "Save Repositories" 967ms

Then I should see a "Test-Child-Channel-x86_64 repository information was successfully updated" text 69ms

When I follow the left menu "Software > Manage > Channels" 68ms

And I follow "Fake-Base-Channel-RH-like" 349ms

And I enter "file:///etc/pki/rpm-gpg/uyuni-tools-gpg-pubkey-0d20833e.key" as "GPG key URL" 110ms

And I click on "Update Channel" 56ms

Then I should see a "Channel Fake-Base-Channel-RH-like updated" text 73ms

When I follow "Repositories" in the content area 69ms

And I select the "fake-rpm-repo" repo 51ms

And I click on "Save Repositories" 1s 128ms

Then I should see a "Fake-Base-Channel-RH-like repository information was successfully updated" text 72ms

When I follow the left menu "Software > Manage > Channels" 68ms

And I follow "Fake-Base-Channel-AppStream" 433ms

And I enter "file:///etc/pki/rpm-gpg/uyuni-tools-gpg-pubkey-0d20833e.key" as "GPG key URL" 109ms

And I click on "Update Channel" 624ms

Then I should see a "Channel Fake-Base-Channel-AppStream updated" text 77ms

When I follow "Repositories" in the content area 61ms

And I select the "fake-appstream-repo" repo 56ms

And I click on "Save Repositories" 952ms

Then I should see a "Fake-Base-Channel-AppStream repository information was successfully updated" text 69ms

When I follow the left menu "Software > Manage > Repositories" 75ms

And I follow "Create Repository" 538ms

And I enter "fake-i586-repo" as "label" 62ms

And I enter "file:///srv/www/htdocs/pub/TestRepoRpmUpdates/" as "url" 95ms

And I uncheck "metadataSigned" 10s 83ms

And I click on "Create Repository" 517ms

Then I should see a "Repository created successfully" text 62ms

When I follow the left menu "Software > Manage > Channels" 74ms

And I follow "Fake-Child-Channel-i586" 366ms

And I enter "file:///etc/pki/rpm-gpg/uyuni-tools-gpg-pubkey-0d20833e.key" as "GPG key URL" 118ms

And I click on "Update Channel" 560ms

Then I should see a "Channel Fake-Child-Channel-i586 updated" text 81ms

When I follow "Repositories" in the content area 73ms

And I select the "fake-i586-repo" repo 56ms

And I click on "Save Repositories" 491ms

Then I should see a "Fake-Child-Channel-i586 repository information was successfully updated" text 77ms

When I follow the left menu "Software > Manage > Channels" 69ms

And I follow "Fake-Child-Channel-SUSE-like" 962ms

And I follow "Repositories" in the content area 59ms

And I select the "fake-rpm-repo" repo 56ms

And I click on "Save Repositories" 1s 222ms

Then I should see a "Fake-Child-Channel-SUSE-like repository information was successfully updated" text 75ms

When I follow the left menu "Software > Manage > Repositories" 76ms

And I follow "Create Repository" 323ms

And I enter "fake-debian-repo" as "label" 63ms

And I select "deb" from "contenttype" 68ms

And I enter "http://localhost/pub/TestRepoDebUpdates/" as "url" 91ms

And I click on "Create Repository" 504ms

Then I should see a "Repository created successfully" text 63ms

When I follow the left menu "Software > Manage > Channels" 72ms

And I follow "Fake-Base-Channel-Debian-like" 360ms

And I follow "Repositories" in the content area 68ms

And I select the "fake-debian-repo" repo 53ms

And I click on "Save Repositories" 571ms

Then I should see a "Fake-Base-Channel-Debian-like repository information was successfully updated" text 75ms

When I follow the left menu "Software > Manage > Channels" 0s

And I follow "Fake-RPM-Terminal-Channel" 0s

And I enter "file:///etc/pki/rpm-gpg/uyuni-tools-gpg-pubkey-0d20833e.key" as "GPG key URL" 0s

And I click on "Update Channel" 0s

Then I should see a "Channel Fake-RPM-Terminal-Channel updated" text 0s

When I follow "Repositories" in the content area 0s

And I select the "fake-rpm-repo" repo 0s

And I click on "Save Repositories" 0s

Then I should see a "Fake-RPM-Terminal-Channel repository information was successfully updated" text 0s

In Order to use product packages in development to the clients
As an authorized user
I want to create custom channels for each distribution

Given I am authorized for the "Admin" section 502ms

When I follow the left menu "Software > Manage > Channels" 177ms

And I follow "Create Channel" 367ms

And I enter "Devel-SUSE-Channel" as "Channel Name" 77ms

And I enter "devel-suse-channel" as "Channel Label" 76ms

And I select the parent channel for the "sle_minion" from "Parent Channel" 61ms

And I select "x86_64" from "Architecture:" 50ms

And I enter "Devel-SUSE-Channel for development repositories" as "Channel Summary" 106ms

And I enter "Channel containing development repositories" as "Channel Description" 96ms

And I click on "Create Channel" 654ms

Then I should see a "Channel Devel-SUSE-Channel created." text 76ms

When I prepare the development repositories of "sle_minion" as part of "devel-suse-channel" channel 9s 518ms

When I follow the left menu "Software > Manage > Channels" 79ms

And I follow "Create Channel" 349ms

And I enter "Devel-Build-Host-Channel" as "Channel Name" 76ms

And I enter "devel-build-host-channel" as "Channel Label" 74ms

And I select the parent channel for the "build_host" from "Parent Channel" 48ms

And I select "x86_64" from "Architecture:" 40ms

And I enter "Devel-Build-Host-Channel for development repositories" as "Channel Summary" 107ms

And I enter "Channel containing development repositories" as "Channel Description" 93ms

And I click on "Create Channel" 612ms

Then I should see a "Channel Devel-Build-Host-Channel created." text 76ms

When I prepare the development repositories of "build_host" as part of "devel-build-host-channel" channel 4s 340ms

When I follow the left menu "Software > Manage > Channels" 71ms

And I follow "Create Channel" 277ms

And I enter "Devel-Debian-like-Channel" as "Channel Name" 78ms

And I enter "devel-debian-like-channel" as "Channel Label" 75ms

And I select "Fake-Base-Channel-Debian-like" from "Parent Channel" 67ms

And I select "AMD64 Debian" from "Architecture:" 46ms

And I enter "Devel-Debian-like-Channel for development repositories" as "Channel Summary" 113ms

And I enter "Channel containing development repositories" as "Channel Description" 89ms

And I click on "Create Channel" 545ms

Then I should see a "Channel Devel-Debian-like-Channel created." text 76ms

When I prepare the development repositories of "deblike_minion" as part of "devel-debian-like-channel" channel 7s 924ms

When I follow the left menu "Software > Manage > Channels" 71ms

And I follow "Create Channel" 461ms

And I enter "Devel-RH-like-Channel" as "Channel Name" 74ms

And I enter "devel-rh-like-channel" as "Channel Label" 71ms

And I select "Fake-Base-Channel-RH-like" from "Parent Channel" 60ms

And I select "x86_64" from "Architecture:" 40ms

And I enter "Devel-RH-like-Channel for development repositories" as "Channel Summary" 99ms

And I enter "Channel containing development repositories" as "Channel Description" 89ms

And I click on "Create Channel" 53ms

Then I should see a "Channel Devel-RH-like-Channel created." text 821ms

When I prepare the development repositories of "rhlike_minion" as part of "devel-rh-like-channel" channel 5s 265ms

In order to use the content provided inside the repositories of the fake channels
As admin
I want to synchronize the fake channels

Given I am authorized for the "Admin" section 511ms

And I enable source package syncing 3s 206ms

DEBUG: Found channel 'fake-rpm-suse-channel' at line 225. Checking for completion...
DEBUG: Sync for fake-rpm-suse-channel still in progress (no completion message found).
DEBUG: Found channel 'fake-rpm-suse-channel' at line 225. Checking for completion...
DEBUG: Found 'Sync of channel completed.' for fake-rpm-suse-channel at line 229.
SUCCESS: fake-rpm-suse-channel is fully synchronized.

Given I am authorized for the "Admin" section 468ms

When I follow the left menu "Software > Manage > Channels" 165ms

And I follow "Fake-RPM-SUSE-Channel" 470ms

And I follow "Repositories" in the content area 68ms

And I follow "Sync" 781ms

And I wait at most 60 seconds until I do not see "Repository sync is running." text, refreshing the page 78ms

And I click on "Sync Now" 1s 574ms

Then I should see a "Repository sync scheduled for Fake-RPM-SUSE-Channel." text 65ms

And I wait until the channel "fake-rpm-suse-channel" has been synced 18s 643ms

Then "orion-dummy-1.1-1.1.x86_64.rpm" package should have been stored 6s 292ms

And solver file for "fake-rpm-suse-channel" should reference "orion-dummy-1.1-1.1.x86_64.rpm" 2s 921ms

DEBUG: Found channel 'fake-child-channel-i586' at line 233. Checking for completion...
DEBUG: Sync for fake-child-channel-i586 still in progress (no completion message found).
DEBUG: Found channel 'fake-child-channel-i586' at line 233. Checking for completion...
DEBUG: Found 'Sync of channel completed.' for fake-child-channel-i586 at line 237.
SUCCESS: fake-child-channel-i586 is fully synchronized.

Given I am authorized for the "Admin" section 432ms

When I follow the left menu "Software > Manage > Channels" 161ms

And I follow "Fake-Child-Channel-i586" 570ms

And I follow "Repositories" in the content area 60ms

And I follow "Sync" 509ms

And I wait at most 60 seconds until I do not see "Repository sync is running." text, refreshing the page 70ms

And I click on "Sync Now" 1s 789ms

Then I should see a "Repository sync scheduled for Fake-Child-Channel-i586." text 65ms

And I wait until the channel "fake-child-channel-i586" has been synced 18s 633ms

DEBUG: Found channel 'test-child-channel-x86_64' at line 241. Checking for completion...
DEBUG: Sync for test-child-channel-x86_64 still in progress (no completion message found).
DEBUG: Found channel 'test-child-channel-x86_64' at line 241. Checking for completion...
DEBUG: Found 'Sync of channel completed.' for test-child-channel-x86_64 at line 245.
SUCCESS: test-child-channel-x86_64 is fully synchronized.

Given I am authorized for the "Admin" section 440ms

When I follow the left menu "Software > Manage > Channels" 154ms

And I follow "Test-Child-Channel-x86_64" 377ms

And I follow "Repositories" in the content area 55ms

And I follow "Sync" 329ms

And I wait at most 60 seconds until I do not see "Repository sync is running." text, refreshing the page 64ms

And I click on "Sync Now" 1s 795ms

Then I should see a "Repository sync scheduled for Test-Child-Channel-x86_64." text 65ms

And I wait until the channel "test-child-channel-x86_64" has been synced 17s 662ms

DEBUG: Found channel 'fake-child-channel-suse-like' at line 249. Checking for completion...
DEBUG: Sync for fake-child-channel-suse-like still in progress (no completion message found).
DEBUG: Found channel 'fake-child-channel-suse-like' at line 249. Checking for completion...
DEBUG: Found 'Sync of channel completed.' for fake-child-channel-suse-like at line 253.
SUCCESS: fake-child-channel-suse-like is fully synchronized.

Given I am authorized for the "Admin" section 545ms

When I follow the left menu "Software > Manage > Channels" 160ms

And I follow "Fake-Child-Channel-SUSE-like" 372ms

And I follow "Repositories" in the content area 56ms

And I follow "Sync" 340ms

And I wait at most 60 seconds until I do not see "Repository sync is running." text, refreshing the page 69ms

And I click on "Sync Now" 1s 944ms

Then I should see a "Repository sync scheduled for Fake-Child-Channel-SUSE-like." text 66ms

And I wait until the channel "fake-child-channel-suse-like" has been synced 19s 302ms

DEBUG: Found channel 'fake-base-channel-debian-like' at line 257. Checking for completion...
DEBUG: Found 'Sync of channel completed.' for fake-base-channel-debian-like at line 261.
SUCCESS: fake-base-channel-debian-like is fully synchronized.

Given I am authorized for the "Admin" section 437ms

When I follow the left menu "Software > Manage > Channels" 160ms

And I follow "Fake-Base-Channel-Debian-like" 377ms

And I follow "Repositories" in the content area 58ms

And I follow "Sync" 427ms

And I wait at most 60 seconds until I do not see "Repository sync is running." text, refreshing the page 64ms

And I click on "Sync Now" 1s 776ms

Then I should see a "Repository sync scheduled for Fake-Base-Channel-Debian-like." text 70ms

And I wait until the channel "fake-base-channel-debian-like" has been synced 3s 321ms

DEBUG: Found channel 'fake-base-channel-rh-like' at line 265. Checking for completion...
DEBUG: Sync for fake-base-channel-rh-like still in progress (no completion message found).
DEBUG: Found channel 'fake-base-channel-rh-like' at line 265. Checking for completion...
DEBUG: Found 'Sync of channel completed.' for fake-base-channel-rh-like at line 269.
SUCCESS: fake-base-channel-rh-like is fully synchronized.

Given I am authorized for the "Admin" section 452ms

When I follow the left menu "Software > Manage > Channels" 159ms

And I follow "Fake-Base-Channel-RH-like" 375ms

And I follow "Repositories" in the content area 60ms

And I follow "Sync" 500ms

And I wait at most 60 seconds until I do not see "Repository sync is running." text, refreshing the page 66ms

And I click on "Sync Now" 1s 769ms

Then I should see a "Repository sync scheduled for Fake-Base-Channel-RH-like." text 66ms

And I wait until the channel "fake-base-channel-rh-like" has been synced 18s 383ms

DEBUG: Found channel 'fake-base-channel-appstream' at line 273. Checking for completion...
DEBUG: Sync for fake-base-channel-appstream still in progress (no completion message found).
DEBUG: Found channel 'fake-base-channel-appstream' at line 273. Checking for completion...
DEBUG: Found 'Sync of channel completed.' for fake-base-channel-appstream at line 277.
SUCCESS: fake-base-channel-appstream is fully synchronized.

Given I am authorized for the "Admin" section 459ms

When I follow the left menu "Software > Manage > Channels" 158ms

And I follow "Fake-Base-Channel-AppStream" 381ms

And I follow "Repositories" in the content area 54ms

And I follow "Sync" 419ms

And I wait at most 60 seconds until I do not see "Repository sync is running." text, refreshing the page 68ms

And I click on "Sync Now" 1s 772ms

Then I should see a "Repository sync scheduled for Fake-Base-Channel-AppStream." text 65ms

And I wait until the channel "fake-base-channel-appstream" has been synced 17s 656ms

Given I am authorized for the "Admin" section 0s

And I follow the left menu "Software > Manage > Channels" 0s

And I follow "Fake-RPM-Terminal-Channel" 0s

And I follow "Repositories" in the content area 0s

And I follow "Sync" 0s

And I wait at most 60 seconds until I do not see "Repository sync is running." text, refreshing the page 0s

And I click on "Sync Now" 0s

Then I should see a "Repository sync scheduled for Fake-RPM-Terminal-Channel." text 0s

And I wait until the channel "fake-rpm-terminal-channel" has been synced 0s

Then "orion-dummy-1.1-1.1.x86_64.rpm" package should have been stored 0s

And solver file for "fake-rpm-terminal-channel" should reference "orion-dummy-1.1-1.1.x86_64.rpm" 0s

When I follow the left menu "Admin > Task Schedules" 115ms

And I follow "errata-cache-default" 1s 334ms

And I follow "errata-cache-bunch" 1s 541ms

And I click on "Single Run Schedule" 1s 218ms

Then I should see a "bunch was scheduled" text 269ms

And I wait until the table contains "FINISHED" or "SKIPPED" followed by "FINISHED" in its first rows 2s 122ms

When I follow the left menu "Admin > Task Schedules" 81ms

And I follow "channel-repodata-default" 1s 194ms

And I follow "channel-repodata-bunch" 1s 350ms

And I click on "Single Run Schedule" 1s 320ms

Then I should see a "bunch was scheduled" text 232ms

And I wait until the table contains "FINISHED" or "SKIPPED" followed by "FINISHED" in its first rows 2s 48ms

Then I disable source package syncing 2s 891ms

In order to use the content provided inside the repositories of the dev channels
As admin
I want to synchronize the dev channels
DEBUG: Found channel 'devel-suse-channel' at line 281. Checking for completion...
DEBUG: Sync for devel-suse-channel still in progress (no completion message found).
DEBUG: Found channel 'devel-suse-channel' at line 281. Checking for completion...
DEBUG: Found 'Sync of channel completed.' for devel-suse-channel at line 285.
SUCCESS: devel-suse-channel is fully synchronized.

Given I am authorized for the "Admin" section 423ms

When I follow the left menu "Software > Manage > Channels" 184ms

And I follow "Devel-SUSE-Channel" 476ms

And I follow "Repositories" in the content area 69ms

And I follow "Sync" 428ms

And I wait at most 60 seconds until I do not see "Repository sync is running." text, refreshing the page 66ms

And I click on "Sync Now" 1s 810ms

Then I should see a "Repository sync scheduled for Devel-SUSE-Channel." text 71ms

And I wait until the channel "devel-suse-channel" has been synced 18s 207ms

DEBUG: Found channel 'devel-debian-like-channel' at line 289. Checking for completion...
DEBUG: Sync for devel-debian-like-channel still in progress (no completion message found).
DEBUG: Found channel 'devel-debian-like-channel' at line 289. Checking for completion...
DEBUG: Found 'Sync of channel completed.' for devel-debian-like-channel at line 293.
SUCCESS: devel-debian-like-channel is fully synchronized.

Given I am authorized for the "Admin" section 452ms

When I follow the left menu "Software > Manage > Channels" 157ms

And I follow "Devel-Debian-like-Channel" 378ms

And I follow "Repositories" in the content area 57ms

And I follow "Sync" 342ms

And I wait at most 60 seconds until I do not see "Repository sync is running." text, refreshing the page 70ms

And I click on "Sync Now" 1s 730ms

Then I should see a "Repository sync scheduled for Devel-Debian-like-Channel." text 68ms

And I wait until the channel "devel-debian-like-channel" has been synced 17s 602ms

DEBUG: Found channel 'devel-rh-like-channel' at line 297. Checking for completion...
DEBUG: Sync for devel-rh-like-channel still in progress (no completion message found).
DEBUG: Found channel 'devel-rh-like-channel' at line 297. Checking for completion...
DEBUG: Sync for devel-rh-like-channel still in progress (no completion message found).
DEBUG: Found channel 'devel-rh-like-channel' at line 297. Checking for completion...
DEBUG: Found 'Sync of channel completed.' for devel-rh-like-channel at line 301.
SUCCESS: devel-rh-like-channel is fully synchronized.

Given I am authorized for the "Admin" section 426ms

When I follow the left menu "Software > Manage > Channels" 164ms

And I follow "Devel-RH-like-Channel" 380ms

And I follow "Repositories" in the content area 57ms

And I follow "Sync" 717ms

And I wait at most 60 seconds until I do not see "Repository sync is running." text, refreshing the page 66ms

And I click on "Sync Now" 2s 602ms

Then I should see a "Repository sync scheduled for Devel-RH-like-Channel." text 68ms

And I wait until the channel "devel-rh-like-channel" has been synced 34s 897ms

DEBUG: Found channel 'devel-build-host-channel' at line 305. Checking for completion...
DEBUG: Sync for devel-build-host-channel still in progress (no completion message found).
DEBUG: Found channel 'devel-build-host-channel' at line 305. Checking for completion...
DEBUG: Found 'Sync of channel completed.' for devel-build-host-channel at line 309.
SUCCESS: devel-build-host-channel is fully synchronized.

Given I am authorized for the "Admin" section 523ms

When I follow the left menu "Software > Manage > Channels" 159ms

And I follow "Devel-Build-Host-Channel" 472ms

And I follow "Repositories" in the content area 56ms

And I follow "Sync" 440ms

And I wait at most 60 seconds until I do not see "Repository sync is running." text, refreshing the page 66ms

And I click on "Sync Now" 1s 779ms

Then I should see a "Repository sync scheduled for Devel-Build-Host-Channel." text 65ms

And I wait until the channel "devel-build-host-channel" has been synced 17s 677ms

In order to register systems to the server
As the testing user
I want to use activation keys

Given I am authorized for the "Admin" section 433ms

When I create an activation key with id "SUSE-KEY-x86_64", description "SUSE Test Key x86_64", limit of 20 and contact method "default" 1s 582ms

Then I should get the new activation key "1-SUSE-KEY-x86_64" 408ms

When I create an activation key with id "RH-LIKE-KEY", description "RedHat like Test Key", base channel "fake-base-channel-rh-like", limit of 20 and contact method "default" 1s 882ms

Then I should get the new activation key "1-RH-LIKE-KEY" 1s 153ms

When I create an activation key with id "DEBLIKE-KEY", description "Debian-like Test Key", base channel "fake-base-channel-debian-like", limit of 20 and contact method "default" 1s 20ms

Then I should get the new activation key "1-DEBLIKE-KEY" 415ms

When I create an activation key with id "SUSE-SSH-KEY-x86_64", description "SUSE SSH Test Key x86_64", limit of 20 and contact method "ssh-push" 883ms

Then I should get the new activation key "1-SUSE-SSH-KEY-x86_64" 361ms

When I create an activation key with id "SUSE-SSH-TUNNEL-KEY-x86_64", description "SUSE SSH Tunnel Test Key x86_64", limit of 20 and contact method "ssh-push-tunnel" 904ms

Then I should get the new activation key "1-SUSE-SSH-TUNNEL-KEY-x86_64" 407ms

When I create an activation key with id "PROXY-KEY-x86_64", description "Proxy Key x86_64", limit of 1 872ms

Then I should get the new activation key "1-PROXY-KEY-x86_64" 372ms

When I create an activation key with id "BUILD-HOST-KEY-x86_64", description "Build host Key x86_64" 801ms

And I set the entitlements of the activation key "1-BUILD-HOST-KEY-x86_64" to "container_build_host, osimage_build_host" 397ms

Then I should get the new activation key "1-BUILD-HOST-KEY-x86_64" 356ms

When I create an activation key with id "TERMINAL-KEY-x86_64", description "Terminal Key x86_64" 816ms

Then I should get the new activation key "1-TERMINAL-KEY-x86_64" 353ms

In order to register systems to the spacewalk server
As admin
I want to update activation keys to use synchronized base products

Given I am authorized for the "Admin" section 437ms

When I follow the left menu "Systems > Activation Keys" 0s

And I follow "SUSE Test Key x86_64" in the content area 0s

And I wait for child channels to appear 0s

And I select the parent channel for the "sle_minion" from "selectedBaseChannel" 0s

And I wait for child channels to appear 0s

And I include the recommended child channels 0s

And I wait until "SLE-Module-Basesystem15-SP7-Pool for x86_64" has been checked 0s

And I wait until "SLE-Module-Basesystem15-SP7-Updates for x86_64" has been checked 0s

And I wait until "SLE-Module-Server-Applications15-SP7-Pool for x86_64" has been checked 0s

And I wait until "SLE-Module-Server-Applications15-SP7-Updates for x86_64" has been checked 0s

And I check "SLE-Module-DevTools15-SP7-Pool for x86_64" 0s

And I wait until "SLE-Module-DevTools15-SP7-Updates for x86_64" has been checked 0s

And I wait until "SLE-Module-Desktop-Applications15-SP7-Pool for x86_64" has been checked 0s

And I wait until "SLE-Module-Desktop-Applications15-SP7-Updates for x86_64" has been checked 0s

And I check "SLE-Module-Containers15-SP7-Pool for x86_64" 0s

And I wait until "SLE-Module-Containers15-SP7-Updates for x86_64" has been checked 0s

And I check "Fake-RPM-SUSE-Channel" 0s

And I wait until "Fake-RPM-SUSE-Channel" has been checked 0s

And I click on "Update Activation Key" 0s

Then I should see a "Activation key SUSE Test Key x86_64 has been modified" text 0s

When I follow the left menu "Systems > Activation Keys" 126ms

And I follow "SUSE Test Key x86_64" in the content area 68ms

And I wait until I do not see "Loading..." text 407ms

And I select the parent channel for the "sle_minion" from "selectedBaseChannel" 61ms

And I wait until I do not see "Loading..." text 72ms

And I check "Uyuni Client Tools for openSUSE Tumbleweed (x86_64) (Development)" 674ms

And I check "Fake-RPM-SUSE-Channel" 99ms

And I wait until "Fake-RPM-SUSE-Channel" has been checked 16ms

And I click on "Update Activation Key" 550ms

Then I should see a "Activation key SUSE Test Key x86_64 has been modified" text 77ms

@scc_credentials @susemanager @ssh_minion
Scenario:
Update SLE SSH key with synced base product
< 1ms 14

When I follow the left menu "Systems > Activation Keys" 0s

And I follow "SUSE SSH Test Key x86_64" in the content area 0s

And I wait for child channels to appear 0s

And I select the parent channel for the "sle_minion" from "selectedBaseChannel" 0s

And I wait for child channels to appear 0s

And I include the recommended child channels 0s

And I check "SLE-Module-DevTools15-SP7-Pool for x86_64" 0s

And I wait until "SLE-Module-DevTools15-SP7-Updates for x86_64" has been checked 0s

And I wait until "SLE-Module-Desktop-Applications15-SP7-Pool for x86_64" has been checked 0s

And I wait until "SLE-Module-Desktop-Applications15-SP7-Updates for x86_64" has been checked 0s

And I check "Fake-RPM-SUSE-Channel" 0s

And I wait until "Fake-RPM-SUSE-Channel" has been checked 0s

And I click on "Update Activation Key" 0s

Then I should see a "Activation key SUSE SSH Test Key x86_64 has been modified" text 0s

When I follow the left menu "Systems > Activation Keys" 62ms

And I follow "SUSE SSH Test Key x86_64" in the content area 70ms

And I wait until I do not see "Loading..." text 559ms

And I select the parent channel for the "sle_minion" from "selectedBaseChannel" 41ms

And I wait until I do not see "Loading..." text 75ms

And I check "Uyuni Client Tools for openSUSE Tumbleweed (x86_64) (Development)" 914ms

And I check "Fake-RPM-SUSE-Channel" 76ms

And I wait until "Fake-RPM-SUSE-Channel" has been checked 25ms

And I click on "Update Activation Key" 609ms

Then I should see a "Activation key SUSE SSH Test Key x86_64 has been modified" text 79ms

When I follow the left menu "Systems > Activation Keys" 0s

And I follow "SUSE SSH Tunnel Test Key x86_64" in the content area 0s

And I wait for child channels to appear 0s

And I select the parent channel for the "sle_minion" from "selectedBaseChannel" 0s

And I wait for child channels to appear 0s

And I include the recommended child channels 0s

And I check "SLE-Module-DevTools15-SP7-Pool for x86_64" 0s

And I wait until "SLE-Module-DevTools15-SP7-Updates for x86_64" has been checked 0s

And I wait until "SLE-Module-Desktop-Applications15-SP7-Pool for x86_64" has been checked 0s

And I wait until "SLE-Module-Desktop-Applications15-SP7-Updates for x86_64" has been checked 0s

And I check "Fake-RPM-SUSE-Channel" 0s

And I wait until "Fake-RPM-SUSE-Channel" has been checked 0s

And I click on "Update Activation Key" 0s

Then I should see a "Activation key SUSE SSH Tunnel Test Key x86_64 has been modified" text 0s

When I follow the left menu "Systems > Activation Keys" 68ms

And I follow "SUSE SSH Tunnel Test Key x86_64" in the content area 70ms

And I wait until I do not see "Loading..." text 406ms

And I select the parent channel for the "sle_minion" from "selectedBaseChannel" 45ms

And I wait until I do not see "Loading..." text 76ms

And I check "Uyuni Client Tools for openSUSE Tumbleweed (x86_64) (Development)" 651ms

And I check "Fake-RPM-SUSE-Channel" 92ms

And I wait until "Fake-RPM-SUSE-Channel" has been checked 17ms

And I click on "Update Activation Key" 454ms

Then I should see a "Activation key SUSE SSH Tunnel Test Key x86_64 has been modified" text 74ms

@scc_credentials @susemanager @proxy @containerized_server @transactional_server
Scenario:
Update the SLE Micro proxy key with synced base product
< 1ms 11

When I follow the left menu "Systems > Activation Keys" 0s

And I follow "Proxy Key x86_64" in the content area 0s

And I wait for child channels to appear 0s

And I select the parent channel for the "proxy_container" from "selectedBaseChannel" 0s

And I wait for child channels to appear 0s

And I include the recommended child channels 0s

And I wait until "Multi-Linux-ManagerTools-SLE-16 for x86_64 6.2" has been checked 0s

And I check "SUSE-Multi-Linux-Manager-Proxy-5.2 for x86_64" 0s

And I check "SUSE-Multi-Linux-Manager-Retail-Branch-Server-5.2 for x86_64" 0s

And I click on "Update Activation Key" 0s

Then I should see a "Activation key Proxy Key x86_64 has been modified" text 0s

@scc_credentials @susemanager @proxy @containerized_server @skip_if_transactional_server
Scenario:
Update the SLES proxy key with synced base product
< 1ms 11

When I follow the left menu "Systems > Activation Keys" 0s

And I follow "Proxy Key x86_64" in the content area 0s

And I wait for child channels to appear 0s

And I select the parent channel for the "proxy_nontransactional" from "selectedBaseChannel" 0s

And I wait for child channels to appear 0s

And I include the recommended child channels 0s

And I wait until "ManagerTools-SLE15-Pool for x86_64 SP7" has been checked 0s

And I check "SUSE-Manager-Proxy-5.1-Pool for x86_64" 0s

And I check "SUSE-Manager-Proxy-5.1-Updates for x86_64" 0s

And I click on "Update Activation Key" 0s

Then I should see a "Activation key Proxy Key x86_64 has been modified" text 0s

When I follow the left menu "Systems > Activation Keys" 0s

And I follow "Proxy Key x86_64" in the content area 0s

And I wait for child channels to appear 0s

And I select the parent channel for the "proxy_container" from "selectedBaseChannel" 0s

And I wait for child channels to appear 0s

And I check "Uyuni Client Tools for openSUSE Tumbleweed (x86_64) (Development)" 0s

And I click on "Update Activation Key" 0s

Then I should see a "Activation key Proxy Key x86_64 has been modified" text 0s

When I follow the left menu "Systems > Activation Keys" 69ms

And I follow "Build host Key x86_64" in the content area 71ms

And I wait for child channels to appear 1s 303ms

And I select the parent channel for the "build_host" from "selectedBaseChannel" 50ms

And I wait for child channels to appear 521ms

And I include the recommended child channels 171ms

And I wait until "SLE-Module-Basesystem15-SP7-Pool for x86_64" has been checked 20ms

And I wait until "SLE-Module-Basesystem15-SP7-Updates for x86_64" has been checked 19ms

And I wait until "SLE-Module-Server-Applications15-SP7-Pool for x86_64" has been checked 19ms

And I wait until "SLE-Module-Server-Applications15-SP7-Updates for x86_64" has been checked 19ms

And I check "SLE-Module-DevTools15-SP7-Pool for x86_64" 80ms

And I wait until "SLE-Module-DevTools15-SP7-Updates for x86_64" has been checked 19ms

And I wait until "SLE-Module-Desktop-Applications15-SP7-Pool for x86_64" has been checked 19ms

And I wait until "SLE-Module-Desktop-Applications15-SP7-Updates for x86_64" has been checked 19ms

And I wait until "SLE-Module-Systems-Management-15-SP7-Pool for x86_64" has been checked 19ms

And I wait until "SLE-Module-Systems-Management-15-SP7-Updates for x86_64" has been checked 19ms

And I wait until "SLE-Module-Python3-15-SP7-Pool for x86_64" has been checked 19ms

And I wait until "SLE-Module-Python3-15-SP7-Updates for x86_64" has been checked 19ms

And I click on "Update Activation Key" 466ms

Then I should see a "Activation key Build host Key x86_64 has been modified" text 75ms

When I follow the left menu "Systems > Activation Keys" 70ms

And I follow "Build host Key x86_64" in the content area 61ms

And I wait for child channels to appear 855ms

And I select the parent channel for the "build_host" from "selectedBaseChannel" 24ms

And I wait for child channels to appear 304ms

And I check "Uyuni Client Tools for SLES15 SP7 x86_64 (Development)" 107ms

And I wait until "Uyuni Client Tools for SLES15 SP7 x86_64 (Development)" has been checked 16ms

And I click on "Update Activation Key" 525ms

Then I should see a "Activation key Build host Key x86_64 has been modified" text 71ms

@skip_if_github_validation @scc_credentials @uyuni @build_host
Scenario:
Update build host key with dev child channel
2s 59ms 9

When I follow the left menu "Systems > Activation Keys" 64ms

And I follow "Build host Key x86_64" in the content area 86ms

And I wait for child channels to appear 923ms

And I select the parent channel for the "build_host" from "selectedBaseChannel" 26ms

And I wait for child channels to appear 307ms

And I check "Devel-Build-Host-Channel" 81ms

And I wait until "Devel-Build-Host-Channel" has been checked 16ms

And I click on "Update Activation Key" 479ms

Then I should see a "Activation key Build host Key x86_64 has been modified" text 73ms

When I follow the left menu "Systems > Activation Keys" 70ms

And I follow "Terminal Key x86_64" in the content area 83ms

And I wait for child channels to appear 1s 739ms

And I select the parent channel for the "pxeboot_minion" from "selectedBaseChannel" 48ms

And I wait for child channels to appear 517ms

And I include the recommended child channels 159ms

And I wait until "SLE-Module-Basesystem15-SP7-Pool for x86_64" has been checked 25ms

And I wait until "SLE-Module-Basesystem15-SP7-Updates for x86_64" has been checked 16ms

And I wait until "SLE-Module-Server-Applications15-SP7-Pool for x86_64" has been checked 15ms

And I wait until "SLE-Module-Server-Applications15-SP7-Updates for x86_64" has been checked 15ms

And I check "SLE-Module-DevTools15-SP7-Pool for x86_64" 71ms

And I wait until "SLE-Module-DevTools15-SP7-Updates for x86_64" has been checked 15ms

And I wait until "SLE-Module-Desktop-Applications15-SP7-Pool for x86_64" has been checked 15ms

And I wait until "SLE-Module-Desktop-Applications15-SP7-Updates for x86_64" has been checked 16ms

And I click on "Update Activation Key" 481ms

Then I should see a "Activation key Terminal Key x86_64 has been modified" text 73ms

When I follow the left menu "Systems > Activation Keys" 0s

And I follow "Terminal Key x86_64" in the content area 0s

And I wait for child channels to appear 0s

And I check "SLE-Module-Containers15-SP7-Pool for x86_64" 0s

And I wait until "SLE-Module-Containers15-SP7-Updates for x86_64" has been checked 0s

And I check "Fake-RPM-SUSE-Channel" 0s

And I wait until "Fake-RPM-SUSE-Channel" has been checked 0s

And I click on "Update Activation Key" 0s

Then I should see a "Activation key Terminal Key x86_64 has been modified" text 0s

@pxeboot_minion @uyuni @scc_credentials @build_host
Scenario:
Update terminal key with specific fake channel
< 1ms 9

When I follow the left menu "Systems > Activation Keys" 0s

And I follow "Terminal Key x86_64" in the content area 0s

And I wait for child channels to appear 0s

And I check "Fake-RPM-Terminal-Channel" 0s

And I wait until "Fake-RPM-Terminal-Channel" has been checked 0s

And I check "Uyuni Client Tools for SLES15 SP7 x86_64 (Development)" 0s

And I wait until "Uyuni Client Tools for SLES15 SP7 x86_64 (Development)" has been checked 0s

And I click on "Update Activation Key" 0s

Then I should see a "Activation key Terminal Key x86_64 has been modified" text 0s

When I follow the left menu "Systems > Activation Keys" 64ms

And I follow "SUSE Test Key x86_64" in the content area 67ms

And I wait for child channels to appear 739ms

And I check "Devel-SUSE-Channel" 99ms

And I click on "Update Activation Key" 443ms

Then I should see a "Activation key SUSE Test Key x86_64 has been modified" text 76ms

When I follow the left menu "Systems > Activation Keys" 71ms

And I follow "Debian-like Test Key" in the content area 69ms

And I wait for child channels to appear 731ms

And I check "Devel-Debian-like-Channel" 95ms

And I click on "Update Activation Key" 421ms

Then I should see a "Activation key Debian-like Test Key has been modified" text 76ms

When I follow the left menu "Systems > Activation Keys" 70ms

And I follow "RedHat like Test Key" in the content area 69ms

And I wait for child channels to appear 905ms

And I check "Devel-RH-like-Channel" 99ms

And I click on "Update Activation Key" 504ms

Then I should see a "Activation key RedHat like Test Key has been modified" text 75ms

In order to be able to enroll clients with MU repositories
As the system administrator
I create all bootstrap repos with --with-custom-channels option

When I create the bootstrap repositories including custom channels 7s 402ms

base_channel: openSUSE Tumbleweed (x86_64)
channel: openSUSE-Tumbleweed-x86_64-uyuni
parent_channel:
Creating the bootstrap repository on the server:
mgr-create-bootstrap-repo --create openSUSE-Tumbleweed-x86_64-uyuni --with-custom-channels

When I create the bootstrap repository for "sle_minion" on the server 6s 166ms

base_channel: openSUSE Tumbleweed (x86_64)
channel: openSUSE-Tumbleweed-x86_64-uyuni
parent_channel:
Creating the bootstrap repository on the server:
mgr-create-bootstrap-repo --create openSUSE-Tumbleweed-x86_64-uyuni --with-custom-channels

When I create the bootstrap repository for "proxy" on the server 5s 776ms

base_channel: SLE-Product-SLES15-SP7-Pool for x86_64
channel: SLE-15-SP7-x86_64
parent_channel: sle-product-sles15-sp7-pool-x86_64
Creating the bootstrap repository on the server:
mgr-create-bootstrap-repo --create SLE-15-SP7-x86_64 --with-parent-channel sle-product-sles15-sp7-pool-x86_64 --with-custom-channels

When I create the bootstrap repository for "build_host" on the server 8s 762ms

@containerized_server @scope_containerized_proxy @proxy
Feature:Setup containerized proxy 3m 45s 593ms 10 2

In order to use a containerized proxy with the server
As the system administrator
I want to register the containerized proxy on the server

When I perform a full salt minion cleanup on "proxy" 6s 924ms

When I reboot the "proxy" host through SSH, waiting until it comes back 0s

Given I am authorized for the "Admin" section 37s 714ms

The hostname of proxy is uyuni-master-proxy.sumaci.aws

When I follow the left menu "Systems > Bootstrapping" 136ms

Then I should see a "Bootstrap Minions" text 94ms

When I enter the hostname of "proxy" as "hostname" 117ms

And I enter "22" as "port" 52ms

And I enter "root" as "user" 57ms

And I enter "linux" as "password" 56ms

And I select "1-PROXY-KEY-x86_64" from "activationKeys" 74ms

And I click on "Bootstrap" 63ms

And I wait until I see "Bootstrap process initiated." text 38s 905ms

@skip_if_cloud @transactional_server
Scenario:
Reboot the proxy host
< 1ms 1

When I reboot the "proxy" host through SSH, waiting until it comes back 0s

When I wait until onboarding is completed for "proxy" 1m 23s 272ms

When I generate the configuration "/tmp/proxy_container_config.tar.gz" of containerized proxy on the server 11s 634ms

And I copy the configuration "/tmp/proxy_container_config.tar.gz" of containerized proxy from the server to the proxy 2s 919ms

Record not added - avahi domain was not detected

When I add avahi hosts in containerized proxy configuration < 1ms

When I run "mgrpxy install podman /tmp/proxy_container_config.tar.gz" on "proxy" 18s 933ms

And I wait until "uyuni-proxy-pod" service is active on "proxy" 460ms

And I wait until "uyuni-proxy-httpd" service is active on "proxy" 2s 771ms

And I wait until "uyuni-proxy-salt-broker" service is active on "proxy" 7s 458ms

And I wait until "uyuni-proxy-squid" service is active on "proxy" 284ms

And I wait until "uyuni-proxy-ssh" service is active on "proxy" 284ms

And I wait until "uyuni-proxy-tftpd" service is active on "proxy" 283ms

And I wait until port "8022" is listening on "proxy" container 302ms

And I wait until port "80" is listening on "proxy" container 302ms

And I wait until port "443" is listening on "proxy" container 295ms

And I visit "Proxy" endpoint of this "proxy" 362ms

When I follow the left menu "Systems" 58ms

And I wait until I see the name of "proxy", refreshing the page 675ms

Given I am on the Systems overview page of this "proxy" 1s 7ms

When I follow "Properties" in the content area 75ms

Then the "monitoring_entitled" checkbox should be disabled 10s 12ms

@containerized_server @scope_containerized_proxy @proxy @private_net
Feature:Prepare the containerized branch server for PXE booting < 1ms 3

In order to use a containerized proxy as a Retail Branch server
As the system administrator
I make sure the network setup is as expected

When I rename the proxy for Retail 0s

And I connect the second interface of the proxy to the private network 0s

And I restart all proxy containers 0s

Then the "dhcp_dns" host should be present on private network 0s

And name resolution should work on private network 0s

Given I am authorized for the "Admin" section 0s

When I am on the Systems overview page of this "proxy" 0s

And I follow "Details" in the content area 0s

And I follow "Hardware" in the content area 0s

And I click on "Schedule Hardware Refresh" 0s

Then I should see a "You have successfully scheduled a hardware profile refresh" text 0s

When I wait until event "Hardware List Refresh scheduled by admin" is completed 0s

And I wait until there is no Salt job calling the module "hardware.profileupdate" on "proxy" 0s

And I follow "Details" in the content area 0s

And I follow "Hardware" in the content area 0s

Then I should see a "proxy.example.org" text 0s

When I perform a full salt minion cleanup on "build_host" 8s 780ms

Given I am authorized for the "Admin" section 38s 347ms

The hostname of build_host is uyuni-master-build-host.sumaci.aws

When I follow the left menu "Systems > Bootstrapping" 281ms

Then I should see a "Bootstrap Minions" text 140ms

When I enter the hostname of "build_host" as "hostname" 248ms

And I enter "22" as "port" 98ms

And I enter "root" as "user" 130ms

And I enter "linux" as "password" 139ms

And I select "1-BUILD-HOST-KEY-x86_64" from "activationKeys" 148ms

And I select the hostname of "proxy" from "proxies" if present 2s 859ms

And I click on "Bootstrap" 159ms

And I wait until I see "Bootstrap process initiated." text 45s 450ms

It took 5 seconds to contact the minion

When I follow the left menu "Salt > Keys" 284ms

Then I should see a "accepted" text 726ms

When I follow the left menu "Systems > System List > All" 304ms

And I wait at most 500 seconds until I see the name of "build_host", refreshing the page 28s 821ms

And I wait at most 500 seconds until onboarding is completed for "build_host" 2m 43s 105ms

Then the Salt master can reach "build_host" 4s 872ms

Given I am on the Systems overview page of this "build_host" 1s 213ms

When I follow "Details" in the content area 85ms

And I follow "Connection" in the content area 69ms

Then I should see "proxy" short hostname 64ms

Given I am on the Systems overview page of this "proxy" 1s 61ms

When I follow "Details" in the content area 62ms

And I follow "Proxy" in the content area 68ms

Then I should see "build_host" hostname 96ms

* Mon Apr 27 2026 marek.czernek@suse.com
- BDSA-2025-60810: Harden Tornado from invalid HTTP reason phrases
- Read full URI from ldap pillar config (bsc#1254900)
- Added:
* bdsa-2025-60810-harden-against-invalid-http-reason-p.patch
* read-full-uri-from-ldap-pillar-config-753.patch

* Tue Apr 14 2026 marek.czernek@suse.com
- Fix testsuite failures
- Added:
* fix-test-failures-754.patch

* Tue Mar 17 2026 vzhestkov@suse.com
- Backport security patch for Salt vendored tornado (bsc#1259554):
* CVE-2026-31958: Add limits on multipart form data parsing

When I query latest Salt changes on "build_host" 546ms

Given I am on the Systems overview page of this "build_host" 1s 40ms

Then I should see a "[Container Build Host]" text 96ms

Then I should see a "[OS Image Build Host]" text 91ms

Given I am on the Systems overview page of this "build_host" 991ms

Then I check for failed events on history event page 1m 21s 12ms

Given I am authorized for the "Admin" section 38s 126ms

The hostname of deblike_minion is uyuni-master-deblike-minion
* Tue Apr 14 2026 Marek Czernek
- Fix testsuite failures
- Added:
* fix-test-failures-754.patch
* Tue Mar 17 2026 Victor Zhestkov
- Backport security patch for Salt vendored tornado (bsc#1259554):
* CVE-2026-31958: Add limits on multipart form data parsing
- Added:
* backport-of-the-cve-2026-31958-fix-bsc-1259554.patch
* Fri Mar 13 2026 Victor Zhestkov
- Add x86_64_v2 as a possible rpm package architecture
- Make users with backslash working for salt-ssh (bsc#1254629)
- Fix ansible.playbooks extra-vars quoting (bsc#1257831)
- Fix virtualenv call in test helper to use proper python version
- Added:

When I follow the left menu "Systems > Bootstrapping" 180ms

Then I should see a "Bootstrap Minions" text 97ms

When I enter the hostname of "deblike_minion" as "hostname" 4s 520ms

And I enter "22" as "port" 79ms

And I enter "root" as "user" 101ms

And I enter "linux" as "password" 102ms

And I select "1-DEBLIKE-KEY" from "activationKeys" 125ms

And I select the hostname of "proxy" from "proxies" if present 2s 888ms

And I click on "Bootstrap" 117ms

And I wait until I see "Bootstrap process initiated." text 37s 113ms

And I follow the left menu "Systems > System List > All" 279ms

And I wait until I see the name of "deblike_minion", refreshing the page 45s 452ms

And I wait until onboarding is completed for "deblike_minion" 36s 472ms

And I query latest Salt changes on Debian-like system "deblike_minion" 900ms

Given I am on the Systems overview page of this "deblike_minion" 1s 144ms

When I follow "Details" in the content area 101ms

And I follow "Connection" in the content area 81ms

Then I should see "proxy" short hostname 101ms

Given I am on the Systems overview page of this "proxy" 1s 907ms

When I follow "Details" in the content area 76ms

And I follow "Proxy" in the content area 147ms

Then I should see "deblike_minion" hostname 170ms

Warning: Radio button 'Fake-Base-Channel-Debian-like' is already checked

Given I am on the Systems overview page of this "deblike_minion" 1s 330ms

When I follow "Software" in the content area 170ms

And I follow "Software Channels" in the content area 101ms

And I wait until I do not see "Loading..." text 104ms

And I check radio button "Fake-Base-Channel-Debian-like" 230ms

And I wait until I do not see "Loading..." text 363ms

And I click on "Next" 152ms

Then I should see a "Confirm Software Channel Change" text 96ms

When I click on "Confirm" 76ms

Then I should see a "Changing the channels has been scheduled." text 403ms

And I wait until event "Subscribe channels scheduled by admin" is completed 23s 35ms

* Tue Apr 14 2026 Marek Czernek
- Fix testsuite failures
- Added:
* fix-test-failures-754.patch
* Tue Mar 17 2026 Victor Zhestkov
- Backport security patch for Salt vendored tornado (bsc#1259554):
* CVE-2026-31958: Add limits on multipart form data parsing
- Added:
* backport-of-the-cve-2026-31958-fix-bsc-1259554.patch
* Fri Mar 13 2026 Victor Zhestkov
- Add x86_64_v2 as a possible rpm package architecture
- Make users with backslash working for salt-ssh (bsc#1254629)
- Fix ansible.playbooks extra-vars quoting (bsc#1257831)
- Fix virtualenv call in test helper to use proper python version
- Added:

When I query latest Salt changes on Debian-like system "deblike_minion" 442ms

Given I am on the Systems overview page of this "deblike_minion" 1s 774ms

Then I check for failed events on history event page 51s 363ms

Given I am authorized for the "Admin" section 37s 864ms

The hostname of rhlike_minion is uyuni-master-rhlike-minion.sumaci.aws

When I follow the left menu "Systems > Bootstrapping" 166ms

Then I should see a "Bootstrap Minions" text 176ms

When I enter the hostname of "rhlike_minion" as "hostname" 2s 30ms

And I enter "22" as "port" 230ms

And I enter "root" as "user" 150ms

And I enter "linux" as "password" 83ms

And I select "1-RH-LIKE-KEY" from "activationKeys" 163ms

And I select the hostname of "proxy" from "proxies" if present 3s 373ms

And I click on "Bootstrap" 73ms

And I wait until I see "Bootstrap process initiated." text 35s 389ms

And I follow the left menu "Systems > System List > All" 292ms

And I wait until I see the name of "rhlike_minion", refreshing the page 59s 44ms

And I wait until onboarding is completed for "rhlike_minion" 15s 724ms

Given I am on the Systems overview page of this "rhlike_minion" 2s 730ms

When I follow "Details" in the content area 81ms

And I follow "Connection" in the content area 112ms

Then I should see "proxy" short hostname 86ms

Given I am on the Systems overview page of this "proxy" 2s 155ms

When I follow "Details" in the content area 81ms

And I follow "Proxy" in the content area 80ms

Then I should see "rhlike_minion" hostname 112ms

Warning: Radio button 'Fake-Base-Channel-RH-like' is already checked

Given I am on the Systems overview page of this "rhlike_minion" 1s 119ms

When I follow "Software" in the content area 144ms

And I follow "Software Channels" in the content area 130ms

And I wait until I do not see "Loading..." text 175ms

And I check radio button "Fake-Base-Channel-RH-like" 395ms

And I wait until I do not see "Loading..." text 492ms

And I click on "Next" 117ms

Then I should see a "Confirm Software Channel Change" text 89ms

When I click on "Confirm" 121ms

Then I should see a "Changing the channels has been scheduled." text 494ms

And I wait until event "Subscribe channels scheduled by admin" is completed 21s 156ms

* Tue Apr 14 2026 Marek Czernek
- Fix testsuite failures
- Added:
* fix-test-failures-754.patch

* Tue Mar 17 2026 Victor Zhestkov
- Backport security patch for Salt vendored tornado (bsc#1259554):
* CVE-2026-31958: Add limits on multipart form data parsing
- Added:
* backport-of-the-cve-2026-31958-fix-bsc-1259554.patch

* Fri Mar 13 2026 Victor Zhestkov
- Add x86_64_v2 as a possible rpm package architecture
- Make users with backslash working for salt-ssh (bsc#1254629)
- Fix ansible.playbooks extra-vars quoting (bsc#1257831)

When I query latest Salt changes on "rhlike_minion" 358ms

Given I am on the Systems overview page of this "rhlike_minion" 1s 392ms

Then I check for failed events on history event page 51s 243ms

When I perform a full salt minion cleanup on "sle_minion" 10s 759ms

Given I am authorized for the "Admin" section 39s 487ms

The hostname of sle_minion is uyuni-master-suse-minion.sumaci.aws

When I follow the left menu "Systems > Bootstrapping" 317ms

Then I should see a "Bootstrap Minions" text 182ms

When I enter the hostname of "sle_minion" as "hostname" 299ms

And I enter "22" as "port" 130ms

And I enter "root" as "user" 116ms

And I enter "linux" as "password" 138ms

And I select "1-SUSE-KEY-x86_64" from "activationKeys" 136ms

And I select the hostname of "proxy" from "proxies" if present 2s 814ms

And I click on "Bootstrap" 189ms

And I wait until I see "Bootstrap process initiated." text 43s 3ms

And I report the bootstrap duration for "sle_minion" < 1ms

It took 4 seconds to contact the minion

When I follow the left menu "Salt > Keys" 244ms

And I wait until I do not see "Loading..." text 689ms

Then I should see a "accepted" text 95ms

When I follow the left menu "Systems > System List > All" 300ms

And I wait until I see the name of "sle_minion", refreshing the page 31s 839ms

And I wait until onboarding is completed for "sle_minion" 1m 1s 352ms

Then the Salt master can reach "sle_minion" 3s 819ms

And I report the onboarding duration for "sle_minion" < 1ms

When I remove package "kernel-default-base" from this "sle_minion" 0s

And I install package "kernel-default" on this "sle_minion" 0s

When I reboot the "sle_minion" host through SSH, waiting until it comes back 0s

Given I am on the Systems overview page of this "sle_minion" 1s 183ms

When I follow "Details" in the content area 107ms

And I follow "Connection" in the content area 77ms

Then I should see "proxy" short hostname 78ms

Given I am on the Systems overview page of this "proxy" 1s 662ms

When I follow "Details" in the content area 121ms

And I follow "Proxy" in the content area 89ms

Then I should see "sle_minion" hostname 133ms

When I perform a full salt minion cleanup on "ssh_minion" 9s 751ms

Given I am authorized for the "Admin" section 38s 243ms

The hostname of ssh_minion is uyuni-master-suse-sshminion.sumaci.aws

When I follow the left menu "Systems > Bootstrapping" 183ms

Then I should see a "Bootstrap Minions" text 124ms

When I check "manageWithSSH" 164ms

And I enter the hostname of "ssh_minion" as "hostname" 254ms

And I enter "linux" as "password" 88ms

And I select the hostname of "proxy" from "proxies" if present 3s 107ms

And I click on "Bootstrap" 97ms

And I wait until I see "Bootstrap process initiated." text 58s 265ms

And I follow the left menu "Systems > System List > All" 281ms

And I wait until I see the name of "ssh_minion", refreshing the page 31s 791ms

And I wait until onboarding is completed for "ssh_minion" 1m 7s 204ms

When I remove package "kernel-default-base" from this "ssh_minion" 0s

And I install package "kernel-default" on this "ssh_minion" 0s

When I reboot the "ssh_minion" host through SSH, waiting until it comes back 0s

Given I am on the Systems overview page of this "ssh_minion" 1s 274ms

When I follow "Details" in the content area 102ms

And I follow "Connection" in the content area 116ms

Then I should see "proxy" short hostname 127ms

Given I am on the Systems overview page of this "proxy" 1s 584ms

When I follow "Details" in the content area 104ms

And I follow "Proxy" in the content area 129ms

Then I should see "ssh_minion" hostname 139ms

Error: 302 302

When I connect to the server insecurely 1ms

Then the connection should redirect to the secured channel < 1ms

When I connect to the server securely 123ms

Then the connection should be secured < 1ms

And the page title should contain "Sign In" text < 1ms

ssl_ca_cert_file: /etc/ssl/certs/uyuni-master-server.sumaci.aws.pem

When I connect to the server securely while using CA certificate file 116ms

Then the connection should be secured < 1ms

And the page title should contain "Sign In" text < 1ms

When I connect to the server securely while using incorrect certificate as a CA certificate file 105ms

Then the secure connection should fail due to unverified certificate signature < 1ms

In order to use software channels
As root user
I want to list available products from command line

When I execute mgr-sync "list products" with user "admin" and password "admin" 0s

Then I should get "[ ] SUSE Linux Enterprise Desktop 15 SP3 x86_64" 0s

When I execute mgr-sync "list products" with user "admin" and password "admin" 6s 364ms

Then I should get "[ ] openSUSE Leap 15.6 x86_64" < 1ms Show Error +
                                            
'[ ] openSUSE Leap 15.6 x86_64' not found in output 'Available Products: (R) - recommended extension Status: - [I] - product is installed - [ ] - product is not installed, but is available - [U] - product is unavailable [ ] RHEL and Liberty 8 Base [ ] RHEL and Liberty 9 Base [ ] RHEL7 Base x86_64 [ ] SUSE Linux Enterprise Desktop 15 SP4 x86_64 [ ] SUSE Linux Enterprise Micro 5.2 x86_64 [ ] SUSE Linux Enterprise Micro 5.3 x86_64 [ ] SUSE Linux Enterprise Server 15 SP4 x86_64 [ ] SUSE Linux Enterprise Server 15 SP5 x86_64 [ ] SUSE Linux Enterprise Server 15 SP6 x86_64 [I] SUSE Linux Enterprise Server 15 SP7 x86_64 [I] (R) Basesystem Module 15 SP7 x86_64 [ ] Containers Module 15 SP7 x86_64 [I] Desktop Applications Module 15 SP7 x86_64 [I] Development Tools Module 15 SP7 x86_64 [ ] Public Cloud Module 15 SP7 x86_64 [I] (R) Python 3 Module 15 SP7 x86_64 [I] (R) Server Applications Module 15 SP7 x86_64 [I] (R) Systems Management Module 15 SP7 x86_64 [ ] Web and Scripting Module 15 SP7 x86_64 [ ] SUSE Linux Enterprise Live Patching 15 SP7 x86_64 ' (ScriptError) ./features/step_definitions/command_steps.rb:206:in `/^I should get "([^"]*)"$/' features/secondary/srv_mgr_sync_list_products.feature:17:in `I should get "[ ] openSUSE Leap 15.6 x86_64"'

When I execute mgr-sync "list products -e" 0s

Then I should get "[ ] SUSE Linux Enterprise Desktop 15 SP3 x86_64" 0s

And I should get " [ ] (R) Basesystem Module 15 SP3 x86_64" 0s

And I should get " [ ] Desktop Applications Module 15 SP3 x86_64" 0s

@skip_if_containerized_server @skip_if_github_validation @scope_monitoring
Feature:Disable and re-enable monitoring of the server < 1ms 7

Given I am authorized for the "Admin" section 0s

When I follow the left menu "Admin > Manager Configuration > Monitoring" 0s

And I wait until I see "Server self monitoring" text 0s

And I click on "Disable" 0s

And I wait until button "Disable" becomes enabled 0s

Then I should see a "Monitoring disabled successfully." text 0s

And I should see a list item with text "System" and a failing bullet 0s

And I should see a list item with text "PostgreSQL database" and a failing bullet 0s

And I should see a list item with text "Server self monitoring" and a warning bullet 0s

And I should see a list item with text "Taskomatic (Java JMX)" and a warning bullet 0s

And I should see a list item with text "Tomcat (Java JMX)" and a warning bullet 0s

And I should see a "Restarting Tomcat and Taskomatic is needed for the configuration changes to take effect." text 0s

Given I am authorized for the "Admin" section 0s

When I follow the left menu "Admin > Manager Configuration > Monitoring" 0s

And I wait until I see "Server self monitoring" text 0s

Then I should see a "Enable" button 0s

And I should see a "Disable" button 0s

And I should see a list item with text "System" and a failing bullet 0s

And I should see a list item with text "PostgreSQL database" and a failing bullet 0s

And I should see a list item with text "Server self monitoring" and a failing bullet 0s

And I should see a list item with text "Taskomatic (Java JMX)" and a failing bullet 0s

And I should see a list item with text "Tomcat (Java JMX)" and a failing bullet 0s

And I should not see a "Restarting Tomcat and Taskomatic is needed for the configuration changes to take effect." text 0s

And file "/etc/rhn/rhn.conf" should contain "prometheus_monitoring_enabled = 0" on server 0s

And file "/etc/tomcat/conf.d/tomcat_jmx.conf" should not exist on server 0s

And file "/etc/rhn/taskomatic.conf.d/taskomatic_jmx.conf" should not exist on server 0s

And port "3333" should be closed 0s

And port "3334" should be closed 0s

And port "5556" should be closed 0s

And port "5557" should be closed 0s

When I follow the left menu "Admin > Manager Configuration > Monitoring" 0s

And I wait until I see "Server self monitoring" text 0s

And I click on "Enable" 0s

And I wait until button "Enable" becomes enabled 0s

Then I should see a "Monitoring enabled successfully." text 0s

And I should see a list item with text "System" and a success bullet 0s

And I should see a list item with text "PostgreSQL database" and a success bullet 0s

And I should see a list item with text "Server self monitoring" and a pending bullet 0s

And I should see a list item with text "Taskomatic (Java JMX)" and a pending bullet 0s

And I should see a list item with text "Tomcat (Java JMX)" and a pending bullet 0s

And I should see a "Restarting Tomcat and Taskomatic is needed for the configuration changes to take effect." text 0s

Given I am authorized for the "Admin" section 0s

When I follow the left menu "Admin > Manager Configuration > Monitoring" 0s

And I wait until I see "Server self monitoring" text 0s

Then I should see a "Enable" button 0s

And I should see a "Disable" button 0s

And I should see a list item with text "System" and a success bullet 0s

And I should see a list item with text "PostgreSQL database" and a success bullet 0s

And I should see a list item with text "Server self monitoring" and a success bullet 0s

And I should see a list item with text "Taskomatic (Java JMX)" and a success bullet 0s

And I should see a list item with text "Tomcat (Java JMX)" and a success bullet 0s

And I should not see a "Restarting Tomcat and Taskomatic is needed for the configuration changes to take effect." text 0s

And file "/etc/rhn/rhn.conf" should contain "prometheus_monitoring_enabled = 1" on server 0s

And file "/etc/tomcat/conf.d/tomcat_jmx.conf" should contain "jmx_prometheus_javaagent.jar=5556" on server 0s

And file "/etc/rhn/taskomatic.conf.d/taskomatic_jmx.conf" should contain "jmx_prometheus_javaagent.jar=5557" on server 0s

And port "3333" should be closed 0s

And port "3334" should be closed 0s

And port "5556" should be open 0s

And port "5557" should be open 0s

@skip_if_github_validation @skip_if_cloud @scope_virtual_host_manager
Feature:Virtual host manager web UI < 1ms 9

When I follow the left menu "Systems > Virtual Host Managers" 0s

Then I should see a "Virtual Host Managers" text 0s

And I should see a "No Virtual Host Managers." text 0s

When I click on "Create" 0s

And I follow "VMWare-based" 0s

Then I should see a "Add a VMWare-based Virtual Host Manager" text 0s

And I should see a "Label" text 0s

And I should see a "Hostname" text 0s

And I should see a "Port" text 0s

And I should see a "Username" text 0s

And I should see a "Password" text 0s

When I follow the left menu "Systems > Virtual Host Managers" 0s

And I copy vCenter configuration file on server 0s

And I click on "Create" 0s

When I follow "File-based" 0s

Then I should see a "Add a File-based Virtual Host Manager" text 0s

When I enter "file-vmware" as "label" 0s

And I enter "file:///var/tmp/vCenter.json" as "module_url" 0s

And I click on "Create" 0s

Then I should see a "file-vmware" link 0s

When I follow the left menu "Systems > Virtual Host Managers" 0s

And I follow "file-vmware" 0s

Then I should see a "file:///var/tmp/vCenter.json" text 0s

And I should see a "SUSE Test" text 0s

When I click on "Refresh Data" 0s

Then I should see a "Refreshing the data for this Virtual Host Manager has been triggered." text 0s

Given I am on the Systems page 0s

And I wait until I see "10.162.186.111" text, refreshing the page 0s

When I follow "10.162.186.111" 0s

Then I should see a "OS: VMware ESXi" text 0s

When I follow the left menu "Systems > System List > Virtual Systems" 0s

Then I should see a "vCenter" text 0s

And I should see a "NSX-l3gateway" text 0s

When I follow the left menu "Systems > Virtual Host Managers" 0s

And I follow "file-vmware" 0s

Then I should see a "file:///var/tmp/vCenter.json" text 0s

When I click on "Delete" in element "virtual-host-managers" 0s

And I click on "Delete" in "Delete Virtual Host Manager" modal 0s

And I wait until I see "Virtual Host Manager has been deleted." text 0s

Then I should see a "No Virtual Host Managers." text 0s

Given I am on the Systems page 0s

When I follow "10.162.186.111" 0s

And I follow "Delete System" 0s

And I click on "Delete Profile" 0s

And I wait until I see "has been deleted" text 0s

Given I am on the Systems page 0s

When I follow "10.162.186.112" 0s

And I follow "Delete System" 0s

And I click on "Delete Profile" 0s

And I wait until I see "has been deleted" text 0s

@skip_if_github_validation @scope_power_management @scope_cobbler @sle_minion
Feature:IPMI Power management 2m 31s 487ms 12

When the server starts mocking an IPMI host 11s 286ms

Given I am authorized for the "Admin" section 37s 924ms

When I start local monitoring of Cobbler 13s 256ms

Given I am on the Systems overview page of this "sle_minion" 5s 248ms

When I follow "Provisioning" in the content area 86ms

And I follow "Power Management" in the content area 72ms

Then I should see a "Power Management Settings" text 67ms

And I should see a "IPMI" text 67ms

And I should see a "Save" button 29ms

When I enter "fakeipmi" as "powerAddress" 56ms

And I enter "ipmiusr" as "powerUsername" 57ms

And I enter "test" as "powerPassword" 55ms

And I click on "Save" 604ms

Then I should see a "Power settings saved" text 73ms

And the cobbler report should contain "Power Management Address : fakeipmi" for "sle_minion" 4s 873ms

And the cobbler report should contain "Power Management Username : ipmiusr" for "sle_minion" 3s 282ms

And the cobbler report should contain "Power Management Password : test" for "sle_minion" 3s 345ms

And the cobbler report should contain "Power Management Type : ipmilan" for "sle_minion" 3s 300ms

When I follow "Provisioning" in the content area 65ms

And I follow "Power Management" in the content area 60ms

And I click on "Power On" 2s 855ms

And I click on "Get status" 1s 165ms

Then I should see the power is "On" 24ms

When I click on "Power Off" 3s 301ms

Then I should see a "system has been powered off" text 71ms

And I should see the power is "Unknown" 21ms

When I click on "Get status" 645ms

Then I should see the power is "Off" 19ms

When I click on "Power On" 2s 795ms

Then I should see a "system has been powered on" text 72ms

When I click on "Get status" 711ms

Then I should see the power is "On" 20ms

When I click on "Reboot" 10s 113ms

Then I should see a "system has been rebooted" text 73ms

When I click on "Get status" 682ms

Then I should see the power is "On" 19ms

When I follow the left menu "Systems > System List > All" 167ms

And I click on the clear SSM button 121ms

And I check the "sle_minion" client 436ms

And I follow the left menu "Systems > System Set Manager > Overview" 556ms

And I follow "Configure power management" in the content area 71ms

Then I should see "sle_minion" as link 30ms

And I should see a "Change Power Management Configuration" text 75ms

And I should see a "Type" text 71ms

And I should see a "Network address" text 77ms

And I should see a "Username" text 73ms

And I should see a "Password" text 73ms

And I should see a "System identifier" text 74ms

And I should see a "Update" button 18ms

When I enter "testing" as "powerUsername" 49ms

And I enter "qwertz" as "powerPassword" 51ms

And I click on "Update" 422ms

Then I should see a "Configuration successfully saved for 1 system(s)" text 78ms

And the cobbler report should contain "Power Management Username : testing" for "sle_minion" 3s 573ms

And the cobbler report should contain "Power Management Password : qwertz" for "sle_minion" 3s 320ms

And the cobbler report should contain "Power Management Address : fakeipmi" for "sle_minion" 4s 759ms

And the cobbler report should contain "Power Management Type : ipmilan" for "sle_minion" 3s 172ms

And I follow the left menu "Systems > System Set Manager > Overview" 73ms

When I follow "power management operations" in the content area 68ms

Then I should see "sle_minion" as link 11ms

And I should see a "Power On" button 17ms

And I should see a "Power Off" button 16ms

And I should see a "Reboot" button 17ms

Given I want to operate on this "sle_minion" 428ms

When I set power management value "" for "powerAddress" 460ms

And I set power management value "" for "powerUsername" 963ms

And I set power management value "" for "powerPassword" 436ms

Then the cobbler report should contain "Power Management Address :" for "sle_minion" 3s 173ms

And the cobbler report should contain "Power Management Username :" for "sle_minion" 4s 798ms

And the cobbler report should contain "Power Management Password :" for "sle_minion" 3s 179ms

And the cobbler report should contain "Power Management Type : ipmilan" for "sle_minion" 3s 297ms

When the server stops mocking an IPMI host 474ms

Then the local logs for Cobbler should not contain errors 10s 329ms

@skip_if_github_validation @scope_api @sle_minion
Feature:IPMI Power management API 51s 566ms 6

When the server starts mocking an IPMI host 2s 492ms

And I want to operate on this "sle_minion" 439ms

When I fetch power management values 481ms

Then power management results should have "ipmilan" for "powerType" < 1ms

When I set power management value "fakeipmi" for "powerAddress" 414ms

And I set power management value "ipmiusr" for "powerUsername" 440ms

And I set power management value "test" for "powerPassword" 412ms

And I set power management value "ipmilan" for "powerType" 391ms

Then the cobbler report should contain "Power Management Address : fakeipmi" for "sle_minion" 3s 339ms

And the cobbler report should contain "Power Management Username : ipmiusr" for "sle_minion" 3s 205ms

And the cobbler report should contain "Power Management Password : test" for "sle_minion" 3s 161ms

And the cobbler report should contain "Power Management Type : ipmilan" for "sle_minion" 3s 177ms

When I turn power on 4s 176ms

Then the power status is "on" 545ms

When I turn power off 2s 635ms

Then the power status is "off" 528ms

When I do power management reboot 7s 874ms

Then the power status is "on" 639ms

When I set power management value "" for "powerAddress" 459ms

And I set power management value "" for "powerUsername" 449ms

And I set power management value "" for "powerPassword" 432ms

Then the cobbler report should contain "Power Management Address :" for "sle_minion" 3s 648ms

And the cobbler report should contain "Power Management Username :" for "sle_minion" 3s 210ms

And the cobbler report should contain "Power Management Password :" for "sle_minion" 3s 268ms

And the cobbler report should contain "Power Management Type : ipmilan" for "sle_minion" 5s 243ms

When the server stops mocking an IPMI host 497ms

@skip_if_github_validation @scope_power_management @scope_cobbler @sle_minion
Feature:Redfish Power management 1m 40s 655ms 11

When the controller starts mocking a Redfish host 13s 241ms

Given I am authorized for the "Admin" section 492ms

When I start local monitoring of Cobbler 13s 319ms

Given I am on the Systems overview page of this "sle_minion" 1s 80ms

When I follow "Provisioning" in the content area 73ms

And I follow "Power Management" in the content area 66ms

And I enter the controller hostname as the redfish server address 100ms

And I enter "ipmiusr" as "powerUsername" 51ms

And I enter "test" as "powerPassword" 51ms

And I select "Redfish" from "powerType" 78ms

And I click on "Save" 467ms

Then I should see a "Power settings saved" text 72ms

And the cobbler report should contain ":8443" for "sle_minion" 3s 320ms

And the cobbler report should contain "Power Management Username : ipmiusr" for "sle_minion" 3s 251ms

And the cobbler report should contain "Power Management Password : test" for "sle_minion" 5s 34ms

And the cobbler report should contain "Power Management Type : redfish" for "sle_minion" 3s 210ms

When I follow "Provisioning" in the content area 65ms

And I follow "Power Management" in the content area 62ms

And I click on "Power On" 825ms

And I click on "Get status" 839ms

Then I should see the power is "On" 23ms

When I click on "Power Off" 927ms

Then I should see a "system has been powered off" text 72ms

And I should see the power is "Unknown" 20ms

When I click on "Get status" 780ms

Then I should see the power is "Off" 20ms

When I click on "Power On" 895ms

Then I should see a "system has been powered on" text 75ms

When I click on "Get status" 803ms

Then I should see the power is "On" 21ms

When I click on "Reboot" 6s 312ms

Then I should see a "system has been rebooted" text 69ms

When I click on "Get status" 849ms

Then I should see the power is "On" 19ms

When I follow the left menu "Systems > System List > All" 139ms

And I click on the clear SSM button 51ms

And I check the "sle_minion" client 457ms

And I follow the left menu "Systems > System Set Manager > Overview" 466ms

And I follow "Configure power management" in the content area 62ms

Then I should see "sle_minion" as link 14ms

And I should see a "Change Power Management Configuration" text 74ms

And I should see a "Type" text 73ms

And I should see a "Network address" text 74ms

And I should see a "Username" text 73ms

And I should see a "Password" text 73ms

And I should see a "System identifier" text 77ms

And I should see a "Update" button 17ms

When I enter "testing" as "powerUsername" 48ms

And I enter "qwertz" as "powerPassword" 48ms

And I click on "Update" 57ms

Then I should see a "Configuration successfully saved for 1 system(s)" text 77ms

And the cobbler report should contain "Power Management Username : testing" for "sle_minion" 3s 733ms

And the cobbler report should contain "Power Management Password : qwertz" for "sle_minion" 3s 325ms

And the cobbler report should contain ":8443" for "sle_minion" 4s 466ms

And the cobbler report should contain "Power Management Type : redfish" for "sle_minion" 3s 208ms

And I follow the left menu "Systems > System Set Manager > Overview" 117ms

When I follow "power management operations" in the content area 69ms

Then I should see "sle_minion" as link 11ms

And I should see a "Power On" button 16ms

And I should see a "Power Off" button 16ms

And I should see a "Reboot" button 16ms

Given I want to operate on this "sle_minion" 428ms

When I set power management value "" for "powerAddress" 453ms

And I set power management value "" for "powerUsername" 460ms

And I set power management value "" for "powerPassword" 531ms

And I set power management value "ipmilan" for "powerType" 446ms

Then the cobbler report should contain "Power Management Address :" for "sle_minion" 3s 206ms

And the cobbler report should contain "Power Management Username :" for "sle_minion" 3s 221ms

And the cobbler report should contain "Power Management Password :" for "sle_minion" 5s 11ms

And the cobbler report should contain "Power Management Type : ipmilan" for "sle_minion" 3s 511ms

When the controller stops mocking a Redfish host 49ms

Then the local logs for Cobbler should not contain errors 9s 801ms

Using the UI, we cannot delete a channel if it has a child
or a clone created from it

Given I am authorized 1s 742ms

When I follow the left menu "Software > Manage > Channels" 183ms

And I follow "Clone Channel" 360ms

And I select "Fake-Base-Channel-SUSE-like" as the origin channel 68ms

And I click on "Clone Channel" 408ms

Then I should see a "Create Software Channel" text 79ms

And I should see a "Current state of the channel" text 80ms

When I click on "Clone Channel" 665ms

Then I should see a "Clone of Fake-Base-Channel-SUSE-like" text 79ms

When I follow the left menu "Software > Manage > Channels" 77ms

And I follow "Clone Channel" 373ms

And I select "Clone of Fake-Base-Channel-SUSE-like" as the origin channel 45ms

And I click on "Clone Channel" 390ms

Then I should see a "Create Software Channel" text 75ms

And I should see a "Current state of the channel" text 74ms

When I click on "Clone Channel" 2s 291ms

Then I should see a "Clone of Clone of Fake-Base-Channel-SUSE-like" text 75ms

When I follow the left menu "Software > Manage > Channels" 78ms

And I follow "Clone of Fake-Base-Channel-SUSE-like" 490ms

And I follow "Delete Channel" 402ms

And I check "unsubscribeSystems" 83ms

And I click on "Delete Channel" 426ms

Then I should see a "Clone of Fake-Base-Channel-SUSE-like" text 61ms

And I should see a "Unable to delete channel" text 59ms

When I follow the left menu "Software > Manage > Channels" 72ms

And I follow "Clone of Clone of Fake-Base-Channel-SUSE-like" 468ms

And I follow "Delete Channel" 325ms

And I check "unsubscribeSystems" 66ms

And I click on "Delete Channel" 541ms

Then I should see a "Clone of Clone of Fake-Base-Channel-SUSE-like" text 87ms

And I should see a "has been deleted" text 83ms

When I follow the left menu "Software > Manage > Channels" 73ms

And I follow "Clone Channel" 377ms

And I select "Fake-RPM-SUSE-Channel" as the origin channel 68ms

And I click on "Clone Channel" 381ms

Then I should see a "Create Software Channel" text 78ms

And I should see a "Current state of the channel" text 76ms

When I select "Clone of Fake-Base-Channel-SUSE-like" from "Parent Channel" 64ms

And I click on "Clone Channel" 1s 72ms

Then I should see a "Clone of Fake-RPM-SUSE-Channel" text 73ms

When I follow the left menu "Software > Manage > Channels" 75ms

And I follow "Clone of Fake-Base-Channel-SUSE-like" 470ms

And I follow "Delete Channel" 331ms

And I check "unsubscribeSystems" 66ms

And I click on "Delete Channel" 430ms

Then I should see a "Clone of Fake-Base-Channel-SUSE-like" text 61ms

And I should see a "channel has child channels associated" text 59ms

And I should see a "must delete those channels first before deleting the parent." text 57ms

When I follow the left menu "Software > Manage > Channels" 72ms

And I follow "Clone of Fake-RPM-SUSE-Channel" 488ms

And I follow "Delete Channel" 387ms

And I check "unsubscribeSystems" 66ms

And I click on "Delete Channel" 730ms

Then I should see a "Clone of Fake-RPM-SUSE-Channel" text 62ms

And I should see a "has been deleted." text 67ms

When I follow the left menu "Software > Manage > Channels" 85ms

And I follow "Clone of Fake-Base-Channel-SUSE-like" 556ms

And I follow "Delete Channel" 394ms

And I check "unsubscribeSystems" 70ms

And I click on "Delete Channel" 641ms

Then I should see a "Clone of Fake-Base-Channel-SUSE-like" text 87ms

And I should see a "has been deleted." text 85ms

Using the tool spacewalk-remove-channel, we cannot delete a channel if it has a child
or a clone created from it

Given I am authorized 1s 940ms

When I follow the left menu "Software > Manage > Channels" 185ms

And I follow "Clone Channel" 367ms

And I select "Fake-RPM-SUSE-Channel" as the origin channel 52ms

And I click on "Clone Channel" 395ms

Then I should see a "Create Software Channel" text 81ms

And I should see a "Current state of the channel" text 75ms

When I click on "Clone Channel" 746ms

Then I should see a "Clone of Fake-RPM-SUSE-Channel" text 78ms

When I follow the left menu "Software > Manage > Channels" 73ms

And I follow "Clone Channel" 471ms

And I select "Clone of Fake-RPM-SUSE-Channel" as the origin channel 71ms

And I click on "Clone Channel" 417ms

Then I should see a "Create Software Channel" text 81ms

And I should see a "Current state of the channel" text 73ms

When I click on "Clone Channel" 863ms

Then I should see a "Clone of Clone of Fake-RPM-SUSE-Channel" text 71ms

When I list channels with spacewalk-remove-channel 4s 984ms

Then I should get "clone-fake-rpm-suse-channel" < 1ms

And I should get "clone-clone-fake-rpm-suse-channel" < 1ms

When I delete these channels with spacewalk-remove-channel: 3s 289ms
clone-fake-rpm-suse-channel

Then I should get "Error: cannot remove channel" < 1ms

And I should get "clone channel(s) exist" < 1ms

And I should get "clone-fake-rpm-suse-channel" < 1ms

And I should get "clone-clone-fake-rpm-suse-channel" < 1ms

When I delete these channels with spacewalk-remove-channel: 2s 937ms
clone-fake-rpm-suse-channel
clone-clone-fake-rpm-suse-channel

And I list channels with spacewalk-remove-channel 2s 961ms

Then I shouldn't get "clone-fake-rpm-suse-channel" < 1ms

And I shouldn't get "clone-clone-fake-rpm-suse-channel" < 1ms

@skip_if_github_validation @scope_maintenance_windows @sle_minion @rhlike_minion
Feature:Maintenance windows 11m 22s 770ms 13 1 1

Given I am authorized 1s 915ms

URL: https://uyuni-master-server.sumaci.aws/pub/maintenance-windows-exchange.ics

When I follow the left menu "Schedule > Maintenance Windows > Calendars" 1s 447ms

And I wait for "1" second 1s

Then I should see a "No calendars created" text 57ms

When I click on "Create" in element "maintenance-windows" 79ms

Then I should see a "Calendar Name" text 52ms

When I enter "singlecalendar" as "name" 76ms

And I add "maintenance-windows-exchange.ics" calendar file as url 4s 47ms

And I click on "Create Calendar" 68ms

Then I should see a "Calendar successfully created" text 261ms

URL: https://uyuni-master-server.sumaci.aws/pub/maintenance-windows-multi-exchange-1.ics

When I follow the left menu "Schedule > Maintenance Windows > Calendars" 92ms

And I wait for "1" second 1s

Then I should see a "Items 1 - 1 of 1" text 59ms

When I click on "Create" in element "maintenance-windows" 64ms

Then I should see a "Calendar Name" text 54ms

When I enter "multicalendar" as "name" 71ms

And I add "maintenance-windows-multi-exchange-1.ics" calendar file as url 5s 823ms

And I click on "Create Calendar" 53ms

Then I should see a "Calendar successfully created" text 279ms

When I follow the left menu "Schedule > Maintenance Windows > Schedules" 76ms

And I wait for "1" second 1s

Then I should see a "No schedules created" text 53ms

When I click on "Create" in element "maintenance-windows" 66ms

Then I should see a "Schedule Name" text 58ms

When I enter "singleschedule" as "name" 73ms

And I choose "SINGLE" 57ms

And I click on "Add Calendar" 80ms

And I select "singlecalendar" from "calendarSelect" 1s 129ms

And I click on "Create Schedule" 64ms

Then I should see a "Schedule successfully created" text 179ms

When I follow the left menu "Schedule > Maintenance Windows > Schedules" 89ms

And I wait for "1" second 1s

Then I should see a "Items 1 - 1 of 1" text 59ms

When I click on "Create" in element "maintenance-windows" 65ms

Then I should see a "Schedule Name" text 57ms

When I enter "SAP Maintenance Window" as "name" 89ms

And I choose "MULTI" 57ms

And I click on "Add Calendar" 60ms

And I select "multicalendar" from "calendarSelect" 1s 114ms

And I click on "Create Schedule" 57ms

Then I should see a "Schedule successfully created" text 180ms

When I follow the left menu "Schedule > Maintenance Windows > Schedules" 100ms

And I wait for "1" second 1s

Then I should see a "Items 1 - 2 of 2" text 63ms

When I click on "Create" 61ms

And I enter "Core Server Window" as "name" 80ms

And I choose "MULTI" 51ms

And I click on "Add Calendar" 59ms

And I select "multicalendar" from "calendarSelect" 1s 103ms

And I click on "Create Schedule" 54ms

Then I should see a "Schedule successfully created" text 183ms

Given I am on the Systems overview page of this "sle_minion" 2s 518ms

When I follow "Properties" in the content area 75ms

And I select "singleschedule" from "maintenance-schedule" 66ms

And I click on "Update Properties" 938ms

Then I should see a "System properties changed" text 82ms

When I follow the left menu "Systems > System List > All" 142ms

And I click on the clear SSM button 61ms

And I check the "rhlike_minion" client 1s 955ms

And I follow the left menu "Systems > System Set Manager > Overview" 464ms

And I follow "Assign" in the content area 73ms

And I select "SAP Maintenance Window" from "scheduleId" 1s 128ms

And I check "cancelActions" 87ms

And I click on "Assign All" 69ms

And I click on "Confirm" 71ms

Then I should see a "Maintenance schedule has been assigned" text 174ms

Given I am on the Systems overview page of this "sle_minion" 0s

When I follow "Software" in the content area 0s

And I follow "Software Channels" in the content area 0s

And I wait until I do not see "Loading..." text 0s

Then radio button "SLE-Product-SLES15-SP7-Pool for x86_64" should be checked 0s

When I wait until I do not see "Loading..." text 0s

Then I should see "SLE15-SP7-Installer-Updates for x86_64" as unchecked 0s

When I check "SLE15-SP7-Installer-Updates for x86_64" 0s

And I click on "Next" 0s

Then I should see a "Confirm Software Channel Change" text 0s

When I pick "17:30" as time 0s

And I click on "Confirm" 0s

Then I should see a "Changing the channels has been scheduled." text 0s

When I remove package "virgo-dummy" from this "rhlike_minion" without error control 1s 561ms

And I refresh packages list via spacecmd on "rhlike_minion" 7s 984ms

And I wait until refresh package list on "rhlike_minion" is finished 10m 7s 645ms Show Error +
                                            
execution expired (Timeout::Error) ./features/support/commonlib.rb:89:in `repeat_until_timeout' ./features/step_definitions/command_steps.rb:1283:in `/^I wait until refresh package list on "(.*?)" is finished$/' features/secondary/srv_maintenance_windows.feature:115:in `I wait until refresh package list on "rhlike_minion" is finished'

19s 414ms Show Info +
12:42:51:000 - 12:53:08:000 | Current URL: https://uyuni-master-server.sumaci.aws/rhn/manager/systems/ssm/maintenance
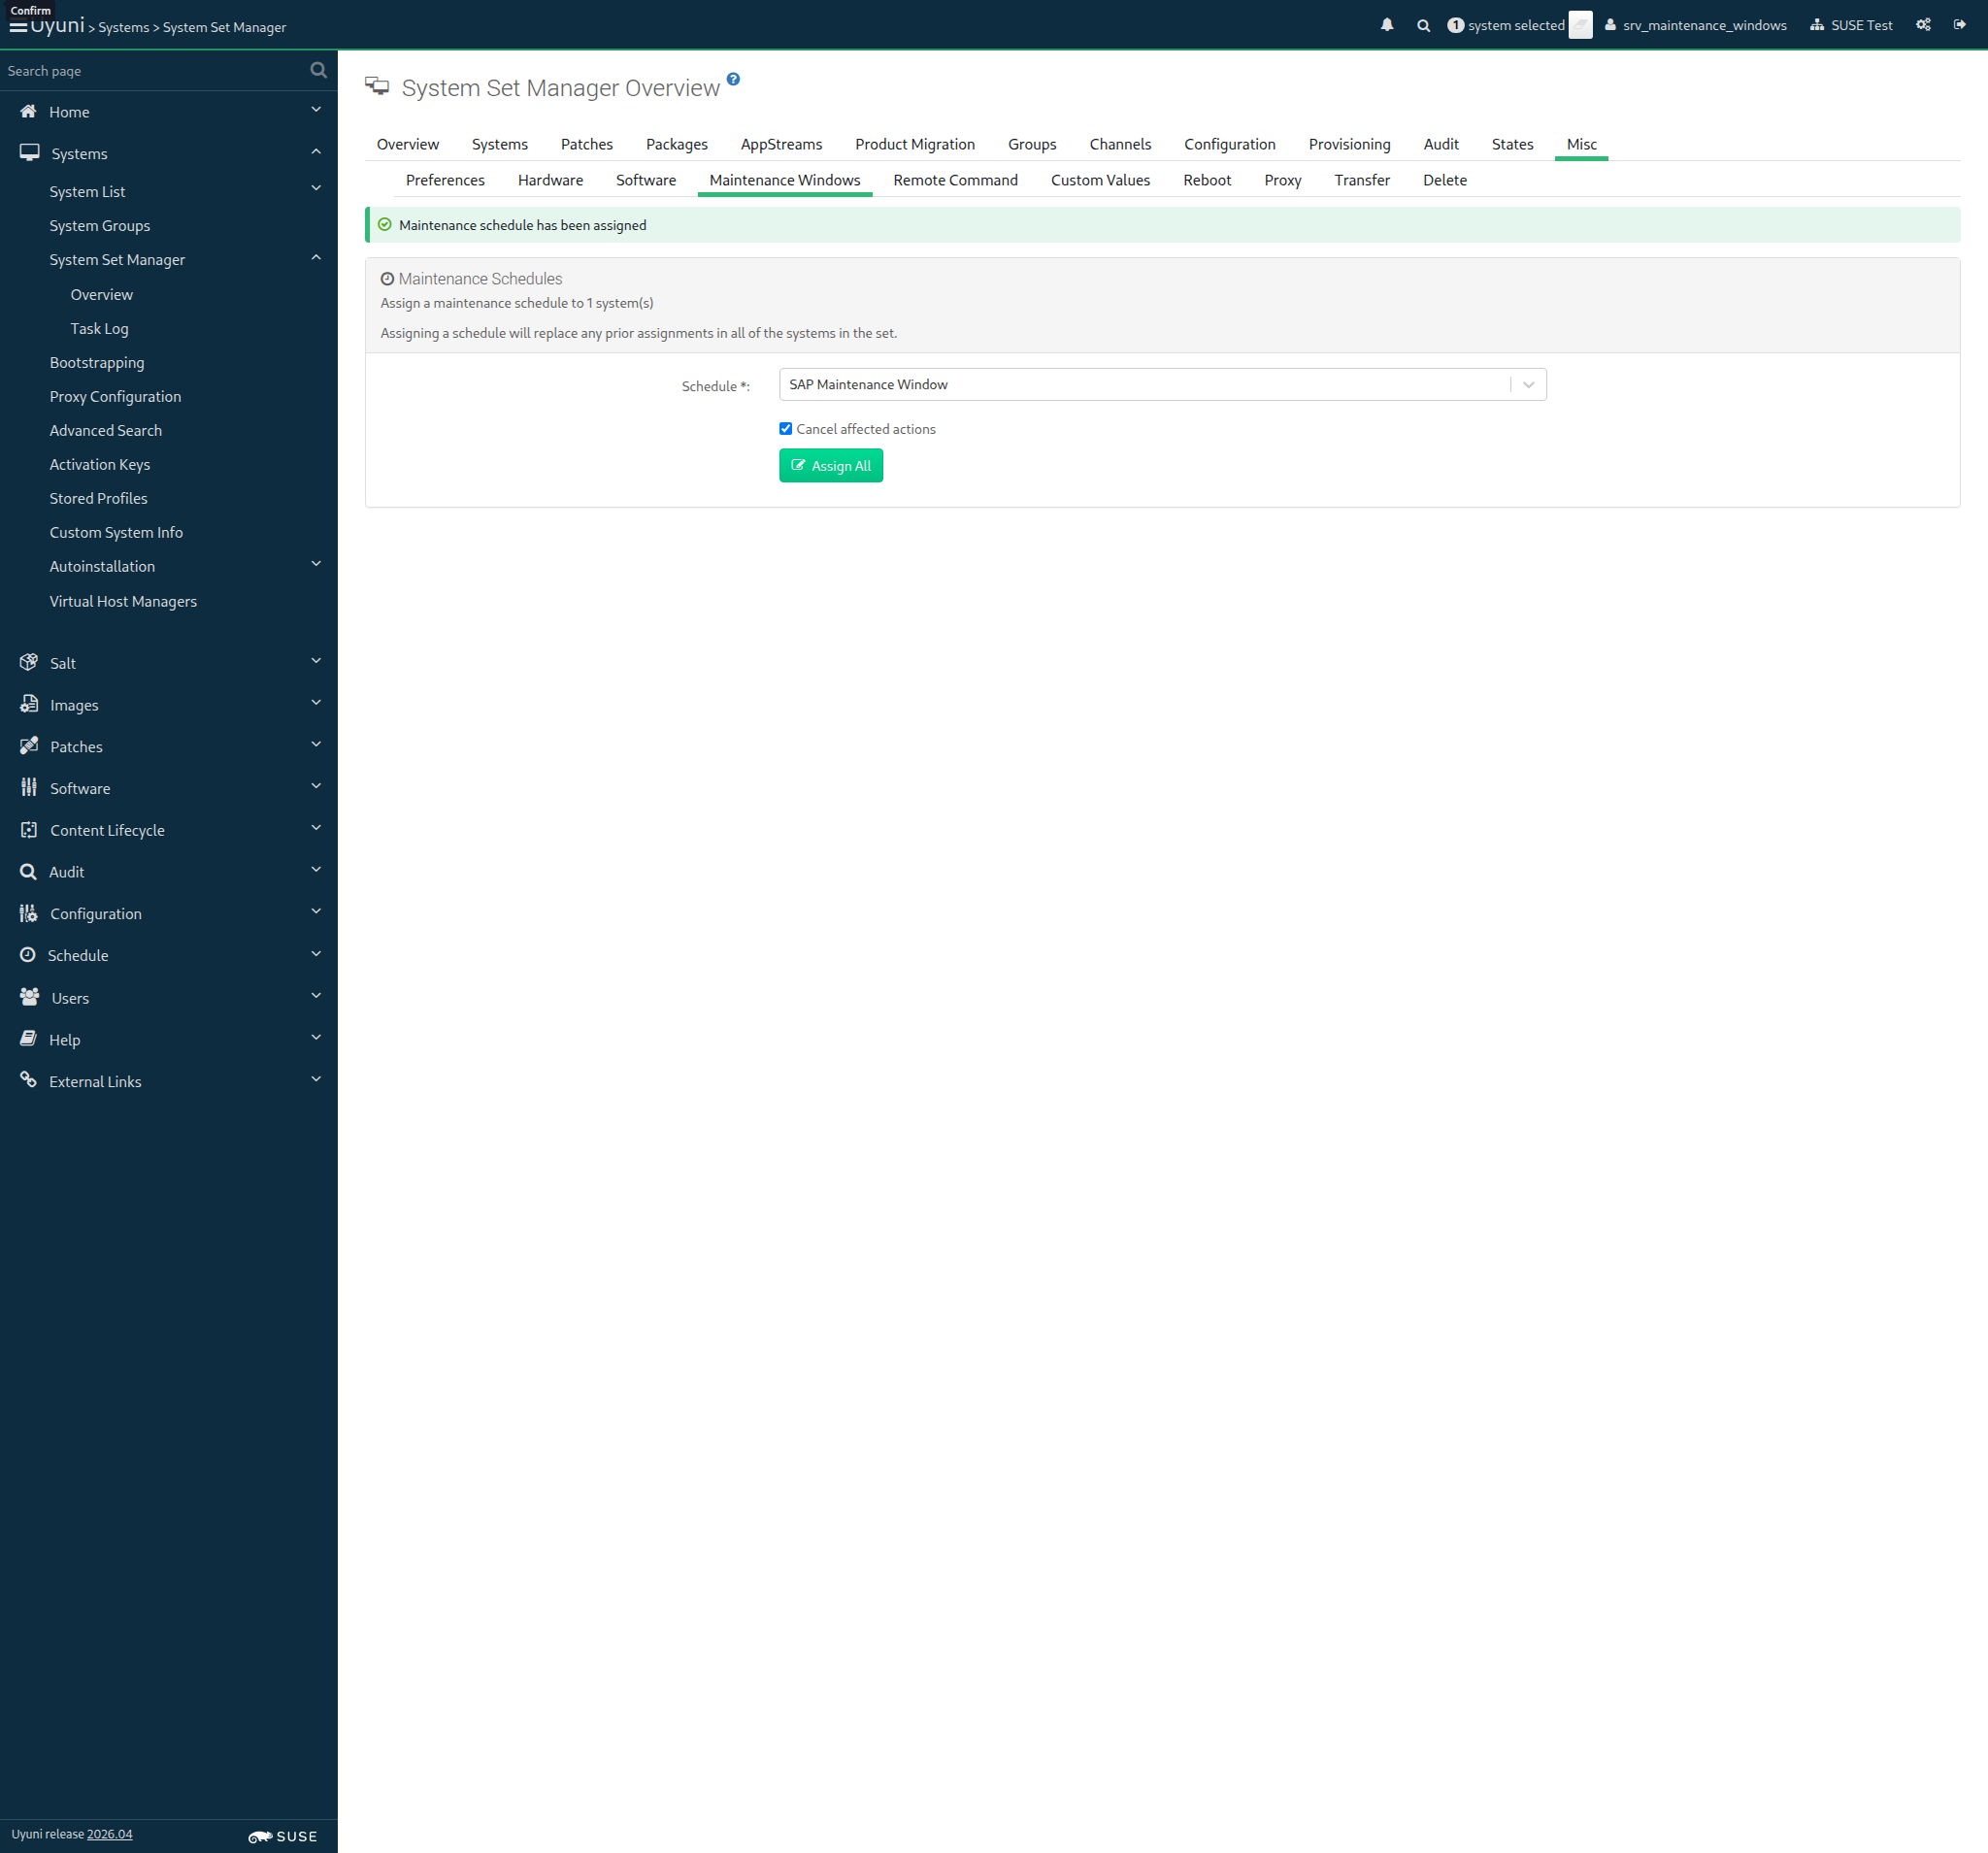
Screenshot +


Given I am on the Systems overview page of this "rhlike_minion" 1s 119ms

When I follow "Software" in the content area 68ms

And I follow "Install" 648ms

And I enter "virgo-dummy" as the filtered package name 45ms

And I click on the filter button 597ms

And I check "virgo-dummy" in the list 58ms

And I click on "Install Packages" 1s 311ms

And I select the next maintenance window 18ms

And I click on "Confirm" 1s 46ms

Then I should see a "1 package install has been scheduled for" text 59ms

When I follow the left menu "Systems > System List > All" 131ms

And I click on the clear SSM button 53ms

And I check the "sle_minion" client 389ms

And I follow the left menu "Systems > System Set Manager > Overview" 523ms

And I follow "Assign" in the content area 66ms

And I select "None - clear schedule" from "scheduleId" 1s 118ms

And I click on "Clear All" 63ms

Then I should see a "Maintenance schedule has been cleared" text 754ms

- Try to cancel "Package Install/Upgrade scheduled by srv_maintenance_windows" action
- Removed "Package Install/Upgrade scheduled by srv_maintenance_windows" action

When I cancel all scheduled actions via API 2s 74ms

When I follow the left menu "Schedule > Maintenance Windows > Schedules" 523ms

And I click the "Core Server Window" item delete button 330ms

Then I should see a "Delete maintenance schedule" text 69ms

When I click on the red confirmation button 65ms

And I wait until I see "Schedule 'Core Server Window' has been deleted." text 184ms

And I click the "SAP Maintenance Window" item delete button 156ms

Then I should see a "Delete maintenance schedule" text 62ms

When I click on the red confirmation button 57ms

And I wait until I see "Schedule 'SAP Maintenance Window' has been deleted." text 191ms

And I click the "singleschedule" item delete button 127ms

Then I should see a "Delete maintenance schedule" text 59ms

When I click on the red confirmation button 57ms

And I wait until I see "Schedule 'singleschedule' has been deleted." text 171ms

When I follow the left menu "Schedule > Maintenance Windows > Calendars" 88ms

And I click the "singlecalendar" item delete button 226ms

Then I should see a "Delete maintenance calendar" text 70ms

When I click on the red confirmation button 61ms

And I wait until I see "Calendar 'singlecalendar' has been deleted." text 300ms

And I click the "multicalendar" item delete button 66ms

Then I should see a "Delete maintenance calendar" text 62ms

When I click on the red confirmation button 59ms

And I wait until I see "Calendar 'multicalendar' has been deleted." text 170ms

Given I am authorized 3s 314ms

When I manually install the "uyuni-config" formula on the server 0s

When I apply "setup_users_configuration" local salt state on "server" 17s 331ms

Given I am authorized as "my_org_user" with password "my_org_user" 2s 96ms

When I follow the left menu "Home > My Organization" 70ms

Then I should see a "my_org" text in the content area 25ms

When I follow the left menu "Home > My Organization > Organization Trusts" 74ms

Then I should see a "my_org2" text in the content area 22ms

Given I am authorized as "my_org_user2" with password "my_org_user2" 1s 814ms

When I follow the left menu "Home > My Organization" 59ms

Then I should see a "my_org2" text in the content area 51ms

When I follow the left menu "Home > My Organization > Organization Trusts" 67ms

Then I should see a "my_org" text in the content area 23ms

Given I am authorized for the "Admin" section 1s 873ms

When I follow the left menu "Systems > System Groups" 122ms

When I follow "minions_group" 524ms

Then I should see a "minions_group" text 65ms

And I should see a "System Group Status" text 62ms

Given I am authorized as "user2" with password "user2" 1s 691ms

When I follow the left menu "Systems > System Groups" 119ms

And I follow "minions_group" 346ms

Then I should see a "minions_group" text 57ms

And I should see a "System Group Status" text 56ms

Given I am authorized as "user2" with password "user2" 337ms

When I follow the left menu "Software > Channel List > All" 185ms

And I follow "Show All Child Channels" 62ms

And I follow "Fake-RPM-SUSE-Channel" 420ms

And I follow "Managers" 2s 663ms

Given I am authorized for the "Admin" section 1s 337ms

When I follow the left menu "Users > User List > Active" 180ms

And I follow "user2" 314ms

Then I should see a "User Details" text 79ms

And I should see "role_activation_key_admin" as checked 20ms

And I should see "role_image_admin" as unchecked 17ms

And I should see "role_config_admin" as checked 17ms

And I should see "role_channel_admin" as unchecked 18ms

And I should see "role_system_group_admin" as unchecked 17ms

When I follow the left menu "Systems > Activation Keys" 111ms

And I follow "My Activation Key created via Salt" 262ms

Then I should see "10" in field identified by "usageLimit" 24ms

And I should see "virtualization_host" as checked 18ms

And I should see a "Push via SSH" text 73ms

And I should see "enable-config-auto-deploy" as checked 19ms

When I apply "teardown_users_configuration" local salt state on "server" 10s 459ms

And I manually uninstall the "uyuni-config" formula from the server 0s

When I follow the left menu "Admin > Organizations" 121ms

Then I should not see a "my_org" text 70ms

And I should not see a "my_org2" text 62ms

When I follow the left menu "Users > User List > Active" 160ms

Then I should not see a "user2" text 101ms

When I follow the left menu "Systems > Activation Keys" 118ms

Then I should not see a "My Activation Key created via Salt" text 87ms

* Related GitHub Card: https://github.com/SUSE/spacewalk/issues/23113
Distribute software between servers
Run export and import with ISS v2

When I install packages "inter-server-sync" on this "server" 4s 136ms

Then "inter-server-sync" should be installed on "server" 4s 406ms

Given I am authorized 2s 602ms

When I follow the left menu "Software > Manage > Channels" 182ms

And I follow "Clone Channel" 368ms

And I select "Fake-RPM-SUSE-Channel" as the origin channel 73ms

And I choose "current" 52ms

And I click on "Clone Channel" 388ms

And I should see a "Create Software Channel" text 80ms

And I should see a "Current state of the channel" text 73ms

And I click on "Clone Channel" 805ms

Then I should see a "Clone of Fake-RPM-SUSE-Channel" text 72ms

When I follow the left menu "Software > Manage > Channels" 75ms

And I follow "Clone of Fake-RPM-SUSE-Channel" 484ms

And I follow "Patches" in the content area 69ms

And I follow "List/Remove Patches" 523ms

Then I should see a "CL-hoag-dummy-7890" link 11ms

And I should see a "CL-virgo-dummy-3456" link 11ms

And I should see a "CL-milkyway-dummy-2345" link 11ms

And I should see a "CL-andromeda-dummy-6789" link 11ms

When I ensure folder "/tmp/export_iss_v2" doesn't exist on "server" 2s 550ms

When I export software channels "clone-fake-rpm-suse-channel" with ISS v2 to "/tmp/export_iss_v2" 18s 228ms

Then "/tmp/export_iss_v2" folder on server is ISS v2 export directory 4s 477ms

When I follow the left menu "Software > Manage > Channels" 73ms

And I follow "Clone of Fake-RPM-SUSE-Channel" 451ms

And I follow "Delete Channel" 393ms

And I check "unsubscribeSystems" 85ms

And I click on "Delete Channel" 60ms

Then I should see a "Clone of Fake-RPM-SUSE-Channel" text 69ms

When I import data with ISS v2 from "/tmp/export_iss_v2" 14s 39ms

When I follow the left menu "Software > Manage > Channels" 74ms

And I follow "Clone of Fake-RPM-SUSE-Channel" 473ms

And I follow "Patches" in the content area 68ms

And I follow "List/Remove Patches" 508ms

Then I should see a "CL-hoag-dummy-7890" link 11ms

And I should see a "CL-virgo-dummy-3456" link 10ms

And I should see a "CL-milkyway-dummy-2345" link 10ms

And I should see a "CL-andromeda-dummy-6789" link 11ms

When I follow the left menu "Software > Manage > Channels" 68ms

When I follow "Clone of Fake-RPM-SUSE-Channel" 382ms

And I follow "Delete Channel" 383ms

And I check "unsubscribeSystems" 66ms

And I click on "Delete Channel" 752ms

Then I should see a "Clone of Fake-RPM-SUSE-Channel" text 61ms

When I ensure folder "/tmp/export_iss_v2" doesn't exist on "server" 5s 254ms

Distribute configuration between servers
Run export and import with ISS v2

When I install packages "inter-server-sync" on this "server" 2s 797ms

Then "inter-server-sync" should be installed on "server" 2s 557ms

Given I am authorized 1s 860ms

When I follow the left menu "Configuration > Channels" 121ms

And I follow "Create Config Channel" 303ms

And I enter "Test Config Channel" as "cofName" 66ms

And I enter "testconfigchannel" as "cofLabel" 62ms

And I enter "This is a test configuration channel" as "cofDescription" 78ms

And I click on "Create Config Channel" 68ms

Then I should see a "Test Config Channel" text 67ms

When I follow the left menu "Configuration > Channels" 65ms

And I follow "Test Config Channel" 407ms

And I follow "Create Configuration File or Directory" 380ms

And I enter "/etc/s-mgr/config" as "cffPath" 67ms

And I enter "COLOR=white" in the editor 4ms

And I click on "Create Configuration File" 743ms

Then I should see a "Revision 1 of /etc/s-mgr/config from channel Test Config Channel" text 95ms

And file "/srv/susemanager/salt/manager_org_1/testconfigchannel/init.sls" should exist on server 4s 489ms

And file "/srv/susemanager/salt/manager_org_1/testconfigchannel/etc/s-mgr/config" should exist on server 2s 530ms

When I ensure folder "/tmp/export_iss_v2" doesn't exist on "server" 2s 514ms

When I export config channels "testconfigchannel" with ISS v2 to "/tmp/export_iss_v2" 8s 26ms

Then "/tmp/export_iss_v2" folder on server is ISS v2 export directory 2s 550ms

When I follow the left menu "Configuration > Channels" 61ms

And I follow "Test Config Channel" 415ms

And I follow "Delete Channel" 358ms

And I click on "Delete Config Channel" 555ms

Then file "/srv/susemanager/salt/manager_org_1/testconfigchannel/init.sls" should not exist on server 2s 574ms

And I should not see a "Test Config Channel" link 8ms

When I import data with ISS v2 from "/tmp/export_iss_v2" 3s 156ms

When I follow the left menu "Configuration > Channels" 61ms

Then I should see a "Test Config Channel" link 9ms

And file "/srv/susemanager/salt/manager_org_1/testconfigchannel/init.sls" should exist on server 4s 638ms

And file "/srv/susemanager/salt/manager_org_1/testconfigchannel/etc/s-mgr/config" should exist on server 2s 561ms

When I follow the left menu "Configuration > Channels" 56ms

And I follow "Test Config Channel" 400ms

And I follow "Delete Channel" 345ms

And I click on "Delete Config Channel" 51ms

Then file "/srv/susemanager/salt/manager_org_1/testconfigchannel/init.sls" should not exist on server 2s 576ms

And I should not see a "Test Config Channel" link 5ms

When I ensure folder "/tmp/export_iss_v2" doesn't exist on "server" 5s 160ms

@skip_if_github_validation @sle_minion @scope_salt @test_issue
Feature:Salt master integration with Git pillar 1m 52s 686ms 3 3

* Related GitHub Card: https://github.com/SUSE/spacewalk/issues/28578

When I add repository "SLE-Module-Basesystem15-SP7-Updates" with url "http://minima-mirror-ci-bv.mgr.suse.de/SUSE/Updates/SLE-Module-Basesystem/15-SP7/x86_64/update/" on "server" without error control 2s 607ms

And I add repository "SLE-Module-Basesystem15-SP7-Pool" with url "http://minima-mirror-ci-bv.mgr.suse.de/SUSE/Products/SLE-Module-Basesystem/15-SP7/x86_64/product/" on "server" without error control 2s 650ms

When I setup a git_pillar environment on the Salt master 7s 532ms Show Error +
                                            
FAIL: mgrctl exec -i 'sh /tmp/salt_git_pillar_setup.sh setup' returned status code = 106. Output: Setting up git_pillar environment and restarting Salt master and Salt API Warning: Skipping repository 'SLE-Module-Basesystem15-SP7-Pool' because of the above error. Warning: Skipping repository 'SLE-Module-Basesystem15-SP7-Updates' because of the above error. Loading repository data... Reading installed packages... Resolving package dependencies... The following 2 NEW packages are going to be installed: git-core libsha1detectcoll1 The following 2 packages are not supported by their vendor: git-core libsha1detectcoll1 2 new packages to install. Package download size: 6.0 MiB Package install size change: | 33.9 MiB required by packages that will be installed 33.9 MiB | - 0 B released by packages that will be removed Backend: classic_rpmtrans Continue? [y/n/v/...? shows all options] (y): y Retrieving: libsha1detectcoll1-1.0.3-2.18.x86_64 (SLE_BCI) (1/2), 23.2 KiB Retrieving: libsha1detectcoll1-1.0.3-2.18.x86_64.rpm [...done] Retrieving: git-core-2.51.0-150600.3.12.1.x86_64 (SLE_BCI) (2/2), 6.0 MiB Retrieving: git-core-2.51.0-150600.3.12.1.x86_64.rpm [......done (5.1 MiB/s)] Checking for file conflicts: [...done] (1/2) Installing: libsha1detectcoll1-1.0.3-2.18.x86_64 [..done] (2/2) Installing: git-core-2.51.0-150600.3.12.1.x86_64 [...........done] Warning: Skipping repository 'SLE-Module-Basesystem15-SP7-Pool' because of the above error. Warning: Skipping repository 'SLE-Module-Basesystem15-SP7-Updates' because of the above error. Loading repository data... Reading installed packages... Resolving package dependencies... The following 3 NEW packages are going to be installed: git perl-Error perl-Git The following 3 packages are not supported by their vendor: git perl-Error perl-Git 3 new packages to install. Package download size: 344.6 KiB Package install size change: | 306.7 KiB required by packages that will be installed 306.7 KiB | - 0 B released by packages that will be removed Backend: classic_rpmtrans Continue? [y/n/v/...? shows all options] (y): y Retrieving: perl-Error-0.17025-1.20.noarch (SLE_BCI) (1/3), 40.5 KiB Retrieving: perl-Error-0.17025-1.20.noarch.rpm [..done] Retrieving: perl-Git-2.51.0-150600.3.12.1.x86_64 (SLE_BCI) (2/3), 184.6 KiB Retrieving: perl-Git-2.51.0-150600.3.12.1.x86_64.rpm [..done] Retrieving: git-2.51.0-150600.3.12.1.x86_64 (SLE_BCI) (3/3), 119.5 KiB Retrieving: git-2.51.0-150600.3.12.1.x86_64.rpm [.done] Checking for file conflicts: [...done] (1/3) Installing: perl-Error-0.17025-1.20.noarch [..done] (2/3) Installing: perl-Git-2.51.0-150600.3.12.1.x86_64 [..done] (3/3) Installing: git-2.51.0-150600.3.12.1.x86_64 [..done] (ScriptError) ./features/support/remote_node.rb:172:in `run_local' ./features/support/remote_node.rb:120:in `run' ./features/step_definitions/salt_steps.rb:83:in `/^I setup a git_pillar environment on the Salt master$/' features/secondary/srv_salt_git_pillar.feature:17:in `I setup a git_pillar environment on the Salt master'

And I wait until Salt master can reach "sle_minion" 0s

Then file "/etc/salt/master.d/zz-testing-gitpillar.conf" should exist on server 0s

19s 607ms Show Info +
12:57:12:000 - 12:57:19:000 | Current URL: https://uyuni-master-server.sumaci.aws/rhn/configuration/GlobalConfigChannelList.do
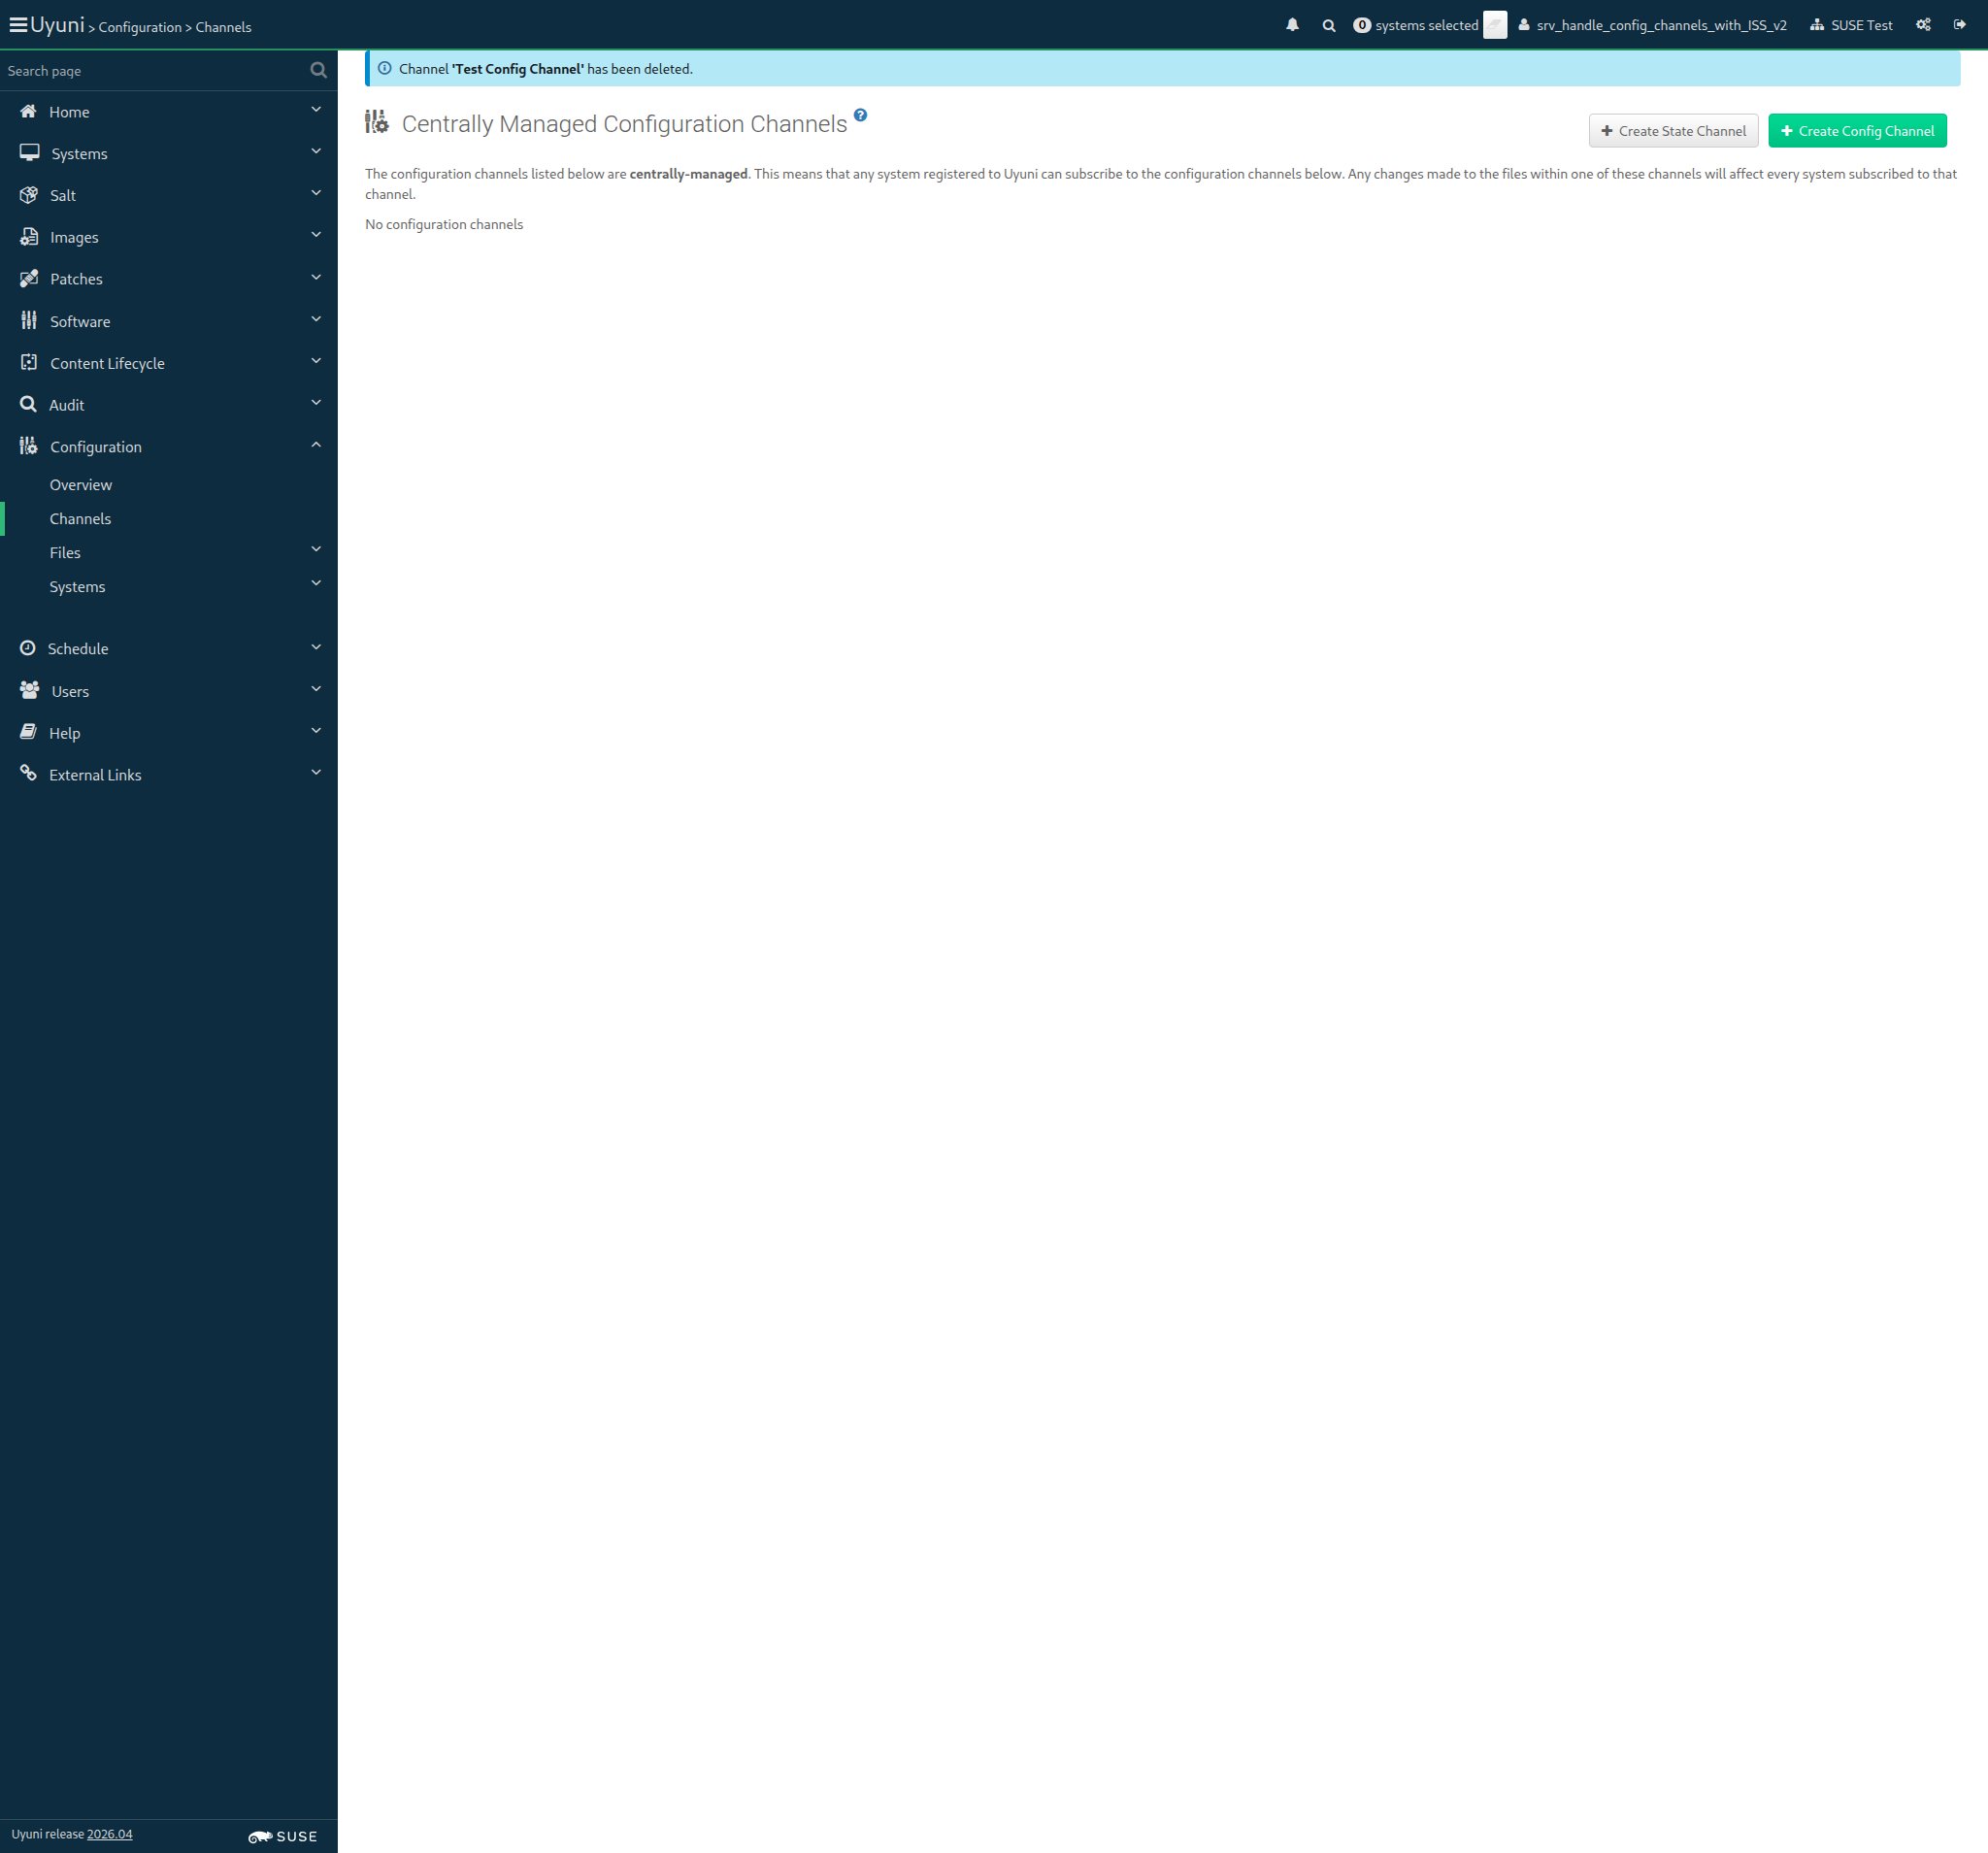
Screenshot +


When I refresh the pillar data 3s 866ms

And I wait until there is no pillar refresh salt job active 6s 39ms

Then the pillar data for "org_id" should be "1" on "sle_minion" 3s 392ms

And the pillar data for "git_pillar_foobar" should be "12345" on "sle_minion" 3s 413ms Show Error +
                                            
Output value wasn't found: uyuni-master-suse-minion.sumaci.aws: (ScriptError) ./features/step_definitions/salt_steps.rb:378:in `/^the pillar data for "([^"]*)" should be "([^"]*)" on "([^"]*)"$/' features/secondary/srv_salt_git_pillar.feature:26:in `the pillar data for "git_pillar_foobar" should be "12345" on "sle_minion"'

And the pillar data for "git_pillar_foobar" should be "12345" on the Salt master 0s

18s 418ms Show Info +
12:57:39:000 - 12:57:55:000 | Current URL: https://uyuni-master-server.sumaci.aws/rhn/configuration/GlobalConfigChannelList.do
Screenshot +


When I clean up the git_pillar environment on the Salt master 2s 540ms Show Error +
                                            
FAIL: mgrctl exec -i 'sh /tmp/salt_git_pillar_setup.sh clean' returned status code = 1. Output: Cleaning git_pillar environment and restarting Salt master and Salt API (ScriptError) ./features/support/remote_node.rb:172:in `run_local' ./features/support/remote_node.rb:120:in `run' ./features/step_definitions/salt_steps.rb:90:in `/^I clean up the git_pillar environment on the Salt master$/' features/secondary/srv_salt_git_pillar.feature:30:in `I clean up the git_pillar environment on the Salt master'

And I wait until Salt master can reach "sle_minion" 0s

Then file "/etc/salt/master.d/zz-testing-gitpillar.conf" should not exist on server 0s

20s 9ms Show Info +
12:58:14:000 - 12:58:16:000 | Current URL: https://uyuni-master-server.sumaci.aws/rhn/configuration/GlobalConfigChannelList.do
Screenshot +


When I refresh the pillar data 4s 23ms

Then the pillar data for "git_pillar_foobar" should be empty on "sle_minion" 3s 403ms

And the pillar data for "org_id" should be "1" on "sle_minion" 4s 651ms

And the pillar data for "git_pillar_foobar" should be empty on the Salt master 5s 501ms

When I remove repository "SLE-Module-Basesystem15-SP7-Updates" on "server" without error control 2s 506ms

And I remove repository "SLE-Module-Basesystem15-SP7-Pool" on "server" without error control 2s 520ms

@skip_if_github_validation @skip_if_cloud @build_host @scope_retail @scope_building_container_images @scc_credentials
Feature:Build OS images < 1ms 9

When I follow the left menu "Images > Profiles" 0s

And I follow "Create" 0s

And I enter "suse_os_image" as "label" 0s

And I select "Kiwi" from "imageType" 0s

And I select "1-TERMINAL-KEY-x86_64" from "activationKey" 0s

And I enter the image filename for "pxeboot_minion" relative to profiles as "path" 0s

And I click on "create-btn" 0s

And I wait until no Salt job is running on "build_host" 0s

Given I am authorized for the "Images" section 0s

When I follow the left menu "Images > Build" 0s

And I select "suse_os_image" from "profileId" 0s

And I select the hostname of "build_host" from "buildHostId" 0s

And I click on "submit-btn" 0s

Given I am authorized for the "Admin" section 0s

Given I am on the Systems overview page of this "build_host" 0s

Then I should see a "[OS Image Build Host]" text 0s

When I wait until the image build "suse_os_image" is completed 0s

And I wait until the image inspection for "pxeboot_minion" is completed 0s

And I wait until no Salt job is running on "build_host" 0s

And I follow the left menu "Images > Image List" 0s

Then I should see the image for "pxeboot_minion" is built 0s

When I open the details page of the image for "pxeboot_minion" 0s

Then I should see a link to download the image for "pxeboot_minion" 0s

When I go to the home page 0s

And I click on the clear SSM button 0s

When I follow the left menu "Images > Profiles" 0s

And I check "suse_os_image" in the list 0s

And I click on "Delete" 0s

And I should see a "Are you sure you want to delete the selected profile?" text 0s

And I click on the red confirmation button 0s

And I wait until I see "Image profile has been deleted" text 0s

When I wait until no Salt job is running on "build_host" 0s

@skip_if_github_validation @scope_onboarding
Feature:Reboot systems managed by Uyuni 15m 51s 742ms 5

Given I am authorized 1s 737ms

Given I am on the Systems overview page of this "ssh_minion" 4s 972ms

When I follow first "Schedule System Reboot" 652ms

Then I should see a "System Reboot Confirmation" text 70ms

And I should see a "Reboot system" button 17ms

When I click on "Reboot system" 1s 63ms

Then I wait and check that "ssh_minion" has rebooted 3m 51s 838ms

2026-04-28 13:05:57 +0200 Still waiting for action to complete...

Given I am on the Systems overview page of this "sle_minion" 950ms

When I follow first "Schedule System Reboot" 482ms

Then I should see a "System Reboot Confirmation" text 73ms

And I should see a "Reboot system" button 15ms

And I click on "Reboot system" 864ms

Then I should see a "Reboot scheduled for system" text 88ms

When I wait at most 600 seconds until event "System reboot scheduled" is completed 4m 14s 643ms

And I should see a "Reboot completed." text 60ms

2026-04-28 13:10:14 +0200 Still waiting for action to complete...

Given I am on the Systems overview page of this "rhlike_minion" 1s 11ms

When I follow first "Schedule System Reboot" 491ms

Then I should see a "System Reboot Confirmation" text 76ms

And I should see a "Reboot system" button 21ms

When I click on "Reboot system" 872ms

Then I should see a "Reboot scheduled for system" text 82ms

When I wait at most 600 seconds until event "System reboot scheduled" is completed 3m 42s 343ms

Then I should see a "Reboot completed." text 59ms

2026-04-28 13:14:03 +0200 Still waiting for action to complete...

Given I am on the Systems overview page of this "deblike_minion" 5s 339ms

When I follow first "Schedule System Reboot" 590ms

Then I should see a "System Reboot Confirmation" text 70ms

And I should see a "Reboot system" button 20ms

When I click on "Reboot system" 868ms

Then I should see a "Reboot scheduled for system" text 90ms

When I wait at most 600 seconds until event "System reboot scheduled" is completed 3m 42s 209ms

Then I should see a "Reboot completed." text 62ms

@skip_if_github_validation @sle_minion @scope_cve_audit
Feature:CVE Audit on SLE Salt Minions 1m 15s 5ms 12

In order to check if systems are patched against certain vulnerabilities
As an authorized user
I want to see the Salt Minions that need to be patched

Given I am authorized for the "Admin" section 2s 220ms

When I enable repository "test_repo_rpm_pool" on this "sle_minion" 916ms

And I install old package "milkyway-dummy-1.0" on this "sle_minion" 1s 948ms

And I refresh the metadata for "sle_minion" 845ms

And I follow the left menu "Admin > Task Schedules" 165ms

And I follow "errata-cache-default" 1s 259ms

And I follow "errata-cache-bunch" 1s 326ms

And I click on "Single Run Schedule" 1s 315ms

Then I should see a "bunch was scheduled" text 288ms

And I wait until the table contains "FINISHED" or "SKIPPED" followed by "FINISHED" in its first rows 2s 322ms

When I follow the left menu "Admin > Task Schedules" 95ms

And I follow "cve-server-channels-default" 1s 99ms

And I follow "cve-server-channels-bunch" 1s 254ms

And I click on "Single Run Schedule" 285ms

Then I should see a "bunch was scheduled" text 57ms

And I wait until the table contains "FINISHED" or "SKIPPED" followed by "FINISHED" in its first rows 1s 314ms

When I follow the left menu "Audit > CVE Audit" 131ms

Then I should see a "CVE Audit" link in the left menu 27ms

And I should see a "CVE Audit" text 67ms

When I follow the left menu "Audit > CVE Audit" 75ms

And I select "1999" from "cveIdentifierYear" 78ms

And I enter "9999" as "cveIdentifierId" 75ms

And I click on "Audit Servers" 67ms

Then I should see "sle_minion" as link 797ms

And I should see a "Affected, at least one patch available in an assigned channel" text 92ms

And I should see a "Install a new patch on this system" link 12ms

And I should see a "milkyway-dummy-2345" text 89ms

And I should see a "Download CSV" link 12ms

And I should see a "Status" button 19ms

And I should see a "Name" button 17ms

And I should see a "extra CVE data update" link 11ms

Then I follow "Install a new patch on this system" on "sle_minion" row 20s 97ms

And I should see a "Relevant Patches" text 84ms

When I follow the left menu "Audit > CVE Audit" 118ms

And I select "2012" from "cveIdentifierYear" 68ms

And I enter "2806" as "cveIdentifierId" 64ms

And I click on "Audit Servers" 58ms

Then I should see a "The specified CVE number was not found" text 204ms

And I click on the clear SSM button 70ms

And I follow the left menu "Audit > CVE Audit" 72ms

And I select "1999" from "cveIdentifierYear" 57ms

And I enter "9999" as "cveIdentifierId" 63ms

And I click on "Audit Servers" 56ms

Then I should see a "Affected, at least one patch available in an assigned channel" text 71ms

When I check the "sle_minion" client 715ms

Then I should see a "system selected" text 220ms

When I follow the left menu "Systems > System List > All" 202ms

Then I should see "sle_minion" as link 439ms

And I click on the clear SSM button 53ms

Result list: [{"errata_advisories"=>[], "system_id"=>1000010004, "channel_labels"=>[], "patch_status"=>"NOT_AFFECTED"}, {"errata_advisories"=>[], "system_id"=>1000010005, "channel_labels"=>[], "patch_status"=>"NOT_AFFECTED"}, {"errata_advisories"=>[], "system_id"=>1000010001, "channel_labels"=>[], "patch_status"=>"NOT_AFFECTED"}, {"errata_advisories"=>[], "system_id"=>1000010000, "channel_labels"=>[], "patch_status"=>"UNKNOWN"}, {"errata_advisories"=>[], "system_id"=>1000010003, "channel_labels"=>[], "patch_status"=>"UNKNOWN"}, {"errata_advisories"=>[], "system_id"=>1000010002, "channel_labels"=>[], "patch_status"=>"UNKNOWN"}]
Result list: [{"errata_advisories"=>["milkyway-dummy-2345"], "system_id"=>1000010005, "channel_labels"=>["fake-rpm-suse-channel"], "patch_status"=>"AFFECTED_FULL_PATCH_APPLICABLE"}, {"errata_advisories"=>["milkyway-dummy-2345"], "system_id"=>1000010001, "channel_labels"=>["fake-base-channel-rh-like"], "patch_status"=>"AFFECTED_FULL_PATCH_APPLICABLE"}, {"errata_advisories"=>[], "system_id"=>1000010004, "channel_labels"=>[], "patch_status"=>"NOT_AFFECTED"}, {"errata_advisories"=>[], "system_id"=>1000010000, "channel_labels"=>[], "patch_status"=>"UNKNOWN"}, {"errata_advisories"=>[], "system_id"=>1000010003, "channel_labels"=>[], "patch_status"=>"UNKNOWN"}, {"errata_advisories"=>[], "system_id"=>1000010002, "channel_labels"=>[], "patch_status"=>"UNKNOWN"}]
result: {"errata_advisories"=>["milkyway-dummy-2345"], "system_id"=>1000010005, "channel_labels"=>["fake-rpm-suse-channel"], "patch_status"=>"AFFECTED_FULL_PATCH_APPLICABLE"}

When I follow the left menu "Admin > Task Schedules" 141ms

And I follow "cve-server-channels-default" 1s 370ms

And I follow "cve-server-channels-bunch" 1s 166ms

And I click on "Single Run Schedule" 292ms

Then I should see a "bunch was scheduled" text 69ms

And I wait until the table contains "FINISHED" or "SKIPPED" followed by "FINISHED" in its first rows 1s 361ms

When I call audit.list_systems_by_patch_status() with CVE identifier "CVE-1999-9979" 1s 397ms

Then I should get status "NOT_AFFECTED" for "sle_minion" 382ms

When I call audit.list_systems_by_patch_status() with CVE identifier "CVE-1999-9999" 995ms

Then I should get status "AFFECTED_FULL_PATCH_APPLICABLE" for "sle_minion" 526ms

And I should get the "fake-rpm-suse-channel" channel label < 1ms

And I should get the "milkyway-dummy-2345" patch < 1ms

Given I am on the Systems overview page of this "sle_minion" 1s 377ms

When I follow "Software" in the content area 82ms

And I follow "Patches" in the content area 73ms

And I enter "milkyway" as the filtered synopsis 49ms

And I click on the filter button 527ms

And I check "milkyway-dummy-2345" in the list 62ms

And I click on "Apply Patches" 639ms

And I click on "Confirm" 699ms

Then I should see a "patch update has been scheduled" text 91ms

And I wait until event "Patch Update: milkyway-dummy-2345" is completed 19s 14ms

Result list: [{"errata_advisories"=>["milkyway-dummy-2345"], "system_id"=>1000010001, "channel_labels"=>["fake-base-channel-rh-like"], "patch_status"=>"AFFECTED_FULL_PATCH_APPLICABLE"}, {"errata_advisories"=>[], "system_id"=>1000010004, "channel_labels"=>[], "patch_status"=>"NOT_AFFECTED"}, {"errata_advisories"=>[], "system_id"=>1000010005, "channel_labels"=>[], "patch_status"=>"PATCHED"}, {"errata_advisories"=>[], "system_id"=>1000010000, "channel_labels"=>[], "patch_status"=>"UNKNOWN"}, {"errata_advisories"=>[], "system_id"=>1000010003, "channel_labels"=>[], "patch_status"=>"UNKNOWN"}, {"errata_advisories"=>[], "system_id"=>1000010002, "channel_labels"=>[], "patch_status"=>"UNKNOWN"}]

And I call audit.list_systems_by_patch_status() with CVE identifier "CVE-1999-9999" 876ms

Then I should get status "PATCHED" for "sle_minion" 344ms

When I disable repository "test_repo_rpm_pool" on this "sle_minion" without error control 773ms

And I remove package "milkyway-dummy" from this "sle_minion" without error control 1s 611ms

In order to audit a Red Hat-like Salt minion
As an authorized user
I want to run an OpenSCAP scan on it

Given I am authorized for the "Admin" section 545ms

When I enable the repositories "Rocky-BaseOS Rocky-AppStream" on this "rhlike_minion" 488ms

And I refresh the metadata for "rhlike_minion" 33s 800ms

Given I am on the Systems overview page of this "rhlike_minion" 987ms

And I install OpenSCAP dependencies on "rhlike_minion" 38s 962ms

And I follow "Software" in the content area 79ms

And I click on "Update Package List" 611ms

And I wait until event "Package List Refresh" is completed 38s 703ms

Given I am on the Systems overview page of this "rhlike_minion" 1s 942ms

When I follow "Audit" in the content area 90ms

And I follow "OpenSCAP" in the content area 80ms

And I follow "Schedule" in the content area 71ms

And I wait at most 30 seconds until I do not see "This system does not yet have OpenSCAP scan capability." text, refreshing the page 72ms

And I enter "--profile xccdf_org.ssgproject.content_profile_anssi_bp28_intermediary" as "params" 137ms

And I enter "/usr/share/xml/scap/ssg/content/ssg-rhel8-ds.xml" as "path" 104ms

And I click on "Schedule" 70ms

Then I should see a "XCCDF scan has been scheduled" text 77ms

And I wait at most 500 seconds until event "OpenSCAP xccdf scanning" is completed 1m 11s 686ms

Given I am on the Systems overview page of this "rhlike_minion" 1s 689ms

When I follow "Audit" in the content area 81ms

And I follow "OpenSCAP" in the content area 68ms

And I follow "xccdf_org.open-scap_testresult" 1s 42ms

Then I should see a "Details of XCCDF Scan" text 225ms

And I should see a "RHEL-8" text 204ms

And I should see a "XCCDF Rule Results" text 216ms

When I follow the left menu "Admin > Organizations" 147ms

When I follow "SUSE Test" in the content area 87ms

And I follow "Configuration" in the content area 69ms

And I enter "0" as "scap_retention_period" 62ms

And I click on "Update Organization" 445ms

Then I should see a "Organization SUSE Test was successfully updated." text 66ms

Given I am on the Systems overview page of this "rhlike_minion" 1s 111ms

When I follow "Audit" in the content area 70ms

And I follow "OpenSCAP" in the content area 63ms

And I follow "List Scans" in the content area 70ms

And I click on "Select All" 412ms

And I click on "Remove" 581ms

And I click on "Confirm" 1s 213ms

Then I should see a " SCAP Scan(s) deleted. 0 SCAP Scan(s) retained" text 71ms

When I follow the left menu "Admin > Organizations" 112ms

When I follow "SUSE Test" in the content area 70ms

And I follow "Configuration" in the content area 66ms

And I enter "90" as "scap_retention_period" 53ms

And I click on "Update Organization" 429ms

Then I should see a "Organization SUSE Test was successfully updated." text 70ms

When I remove OpenSCAP dependencies from "rhlike_minion" 4s 719ms

And I disable repository "Rocky-BaseOS" on this "rhlike_minion" 188ms

Warning: Radio button 'Fake-Base-Channel-RH-like' is already checked

Given I am on the Systems overview page of this "rhlike_minion" 911ms

When I follow "Software" in the content area 81ms

And I follow "Software Channels" in the content area 73ms

And I wait until I do not see "Loading..." text 69ms

And I check radio button "Fake-Base-Channel-RH-like" 188ms

And I wait until I do not see "Loading..." text 348ms

And I click on "Next" 83ms

Then I should see a "Confirm Software Channel Change" text 62ms

When I click on "Confirm" 60ms

Then I should see a "Changing the channels has been scheduled." text 307ms

And I wait until event "Subscribe channels scheduled" is completed 18s 951ms

@skip_if_github_validation @scope_res @rhlike_minion
Feature:Remote command on the Red Hat-like Salt minion 28s 829ms 2

In order to manage a Red Hat-like Salt minion
As an authorized user
I want to run a remote command on it

Given I am authorized 1s 829ms

When I follow the left menu "Salt > Remote Commands" 123ms

Then I should see a "Remote Commands" text in the content area 24ms

When I enter command "cat /etc/os-release" 92ms

And I enter target "rhlike_minion" 117ms

And I click on preview 11s 378ms

And I click on run 50ms

Then I should see "rhlike_minion" hostname 53ms

When I wait for "15" seconds 15s

And I expand the results for "rhlike_minion" 52ms

Then I should see a "rhel centos fedora" text 56ms

And I should see a "ROCKY_SUPPORT_PRODUCT" text 52ms

Given I am authorized 1s 933ms

When I am on the Systems overview page of this "rhlike_minion" 1s 843ms

And I follow "Delete System" 1s 198ms

Then I should see a "Confirm System Profile Deletion" text 61ms

When I click on "Delete Profile" 65ms

And I wait until I see "has been deleted" text 4m 4s 45ms

And I wait until Salt client is inactive on "rhlike_minion" 319ms

Then "rhlike_minion" should not be registered 396ms

The hostname of rhlike_minion is uyuni-master-rhlike-minion.sumaci.aws

When I follow the left menu "Systems > Bootstrapping" 88ms

Then I should see a "Bootstrap Minions" text 69ms

When I check "manageWithSSH" 111ms

And I enter the hostname of "rhlike_minion" as "hostname" 146ms

And I enter "linux" as "password" 67ms

And I select the hostname of "proxy" from "proxies" if present 2s 858ms

And I click on "Bootstrap" 64ms

And I wait at most 480 seconds until I see "Bootstrap process initiated." text 49s 988ms

And I follow the left menu "Systems > System List > All" 166ms

And I wait until I see the name of "rhlike_minion", refreshing the page 58s 240ms

And I wait until onboarding is completed for "rhlike_minion" 29s 772ms

Given I am on the Systems overview page of this "rhlike_minion" 1s 202ms

When I follow "Details" in the content area 74ms

And I follow "Connection" in the content area 68ms

Then I should see "proxy" short hostname 67ms

Given I am on the Systems overview page of this "proxy" 1s 166ms

When I follow "Details" in the content area 65ms

And I follow "Proxy" in the content area 74ms

Then I should see "rhlike_minion" hostname 96ms

Given I am on the Systems overview page of this "rhlike_minion" 1s 136ms

When I follow "Software" in the content area 72ms

And I follow "Software Channels" in the content area 66ms

And I wait until I do not see "Loading..." text 63ms

And I check radio button "Fake-Base-Channel-RH-like" 10s 90ms

And I wait until I do not see "Loading..." text 414ms

And I click on "Next" 65ms

Then I should see a "Confirm Software Channel Change" text 56ms

When I click on "Confirm" 79ms

Then I should see a "Changing the channels has been scheduled." text 288ms

And I wait until event "Subscribe channels scheduled" is completed 55s 765ms

Given I am on the Systems overview page of this "rhlike_minion" 1s 134ms

Then I check for failed events on history event page 1m 985ms

When I follow the left menu "Salt > Remote Commands" 135ms

Then I should see a "Remote Commands" text in the content area 23ms

When I enter command "cat /etc/os-release" 101ms

And I enter target "rhlike_minion" 114ms

And I click on preview 14s 143ms

And I click on run 62ms

Then I should see "rhlike_minion" hostname 67ms

When I wait for "15" seconds 15s

And I expand the results for "rhlike_minion" 52ms

Then I should see a "rhel centos fedora" text 56ms

And I should see a "ROCKY_SUPPORT_PRODUCT" text 52ms

Given I am on the Systems overview page of this "rhlike_minion" 1s 22ms

Then I check for failed events on history event page 1m 11s 93ms

When I am on the Systems overview page of this "rhlike_minion" 1s 117ms

And I follow "Delete System" 469ms

Then I should see a "Confirm System Profile Deletion" text 62ms

When I click on "Delete Profile" 63ms

And I wait until I see "has been deleted" text 13s 642ms

Then "rhlike_minion" should not be registered 472ms

The hostname of rhlike_minion is uyuni-master-rhlike-minion.sumaci.aws

When I follow the left menu "Systems > Bootstrapping" 87ms

Then I should see a "Bootstrap Minions" text 64ms

When I enter the hostname of "rhlike_minion" as "hostname" 158ms

And I enter "22" as "port" 57ms

And I enter "root" as "user" 64ms

And I enter "linux" as "password" 67ms

And I select the hostname of "proxy" from "proxies" if present 82ms

And I click on "Bootstrap" 64ms

And I wait at most 480 seconds until I see "Bootstrap process initiated." text 20s 70ms

And I follow the left menu "Systems > System List > All" 145ms

And I wait until I see the name of "rhlike_minion", refreshing the page 58s 358ms

And I wait until onboarding is completed for "rhlike_minion" 26s 159ms

Given I am on the Systems overview page of this "rhlike_minion" 1s 90ms

When I follow "Software" in the content area 82ms

And I follow "Software Channels" in the content area 67ms

And I wait until I do not see "Loading..." text 67ms

And I check radio button "Fake-Base-Channel-RH-like" 10s 74ms

And I wait until I do not see "Loading..." text 409ms

And I click on "Next" 66ms

Then I should see a "Confirm Software Channel Change" text 58ms

When I click on "Confirm" 59ms

Then I should see a "Changing the channels has been scheduled." text 301ms

And I wait until event "Subscribe channels scheduled" is completed 19s 273ms

@skip_if_github_validation @scope_deblike @deblike_minion
Feature:Remote command on Debian-like Salt minion 15s 698ms 2

In order to manage a Debian-like Salt minion
As an authorized user
I want to run a remote command on it

Given I am authorized 1s 892ms

When I follow the left menu "Salt > Remote Commands" 133ms

Then I should see a "Remote Commands" text in the content area 26ms

When I enter command "cat /etc/os-release" 95ms

And I enter target "deblike_minion" 97ms

And I click on preview 11s 592ms

And I click on run 49ms

Then I should see "deblike_minion" hostname 55ms

When I wait until I see "show response" text 1s 652ms

And I expand the results for "deblike_minion" 49ms

Then I should see a "ID=ubuntu" text 52ms

@skip_if_github_validation @scope_deblike @scope_salt_ssh @deblike_minion
Feature:Bootstrap a SSH-managed Debian-like minion and do some basic operations on it 12m 25s 458ms 12

Given I am authorized 1s 928ms

When I am on the Systems overview page of this "deblike_minion" 1s 757ms

And I follow "Delete System" 477ms

Then I should see a "Confirm System Profile Deletion" text 60ms

When I click on "Delete Profile" 64ms

And I wait until I see "has been deleted" text 4m 3s 857ms

And I wait until Salt client is inactive on "deblike_minion" 1s 292ms

Then "deblike_minion" should not be registered 364ms

The hostname of deblike_minion is uyuni-master-deblike-minion

When I follow the left menu "Systems > Bootstrapping" 87ms

Then I should see a "Bootstrap Minions" text 69ms

When I check "manageWithSSH" 106ms

And I enter the hostname of "deblike_minion" as "hostname" 130ms

And I enter "linux" as "password" 65ms

And I select the hostname of "proxy" from "proxies" if present 83ms

And I click on "Bootstrap" 63ms

And I wait at most 480 seconds until I see "Bootstrap process initiated." text 42s 374ms

And I follow the left menu "Systems > System List > All" 165ms

And I wait until I see the name of "deblike_minion", refreshing the page 30s 847ms

And I wait until onboarding is completed for "deblike_minion" 52s 396ms

Given I am on the Systems overview page of this "deblike_minion" 1s 118ms

When I follow "Details" in the content area 81ms

And I follow "Connection" in the content area 71ms

Then I should see "proxy" short hostname 66ms

Given I am on the Systems overview page of this "proxy" 1s 9ms

When I follow "Details" in the content area 61ms

And I follow "Proxy" in the content area 67ms

Then I should see "deblike_minion" hostname 92ms

Given I am on the Systems overview page of this "deblike_minion" 1s 289ms

When I follow "Software" in the content area 80ms

And I follow "Software Channels" in the content area 71ms

And I wait until I do not see "Loading..." text 65ms

And I check radio button "Fake-Base-Channel-Debian-like" 10s 110ms

And I wait until I do not see "Loading..." text 387ms

And I click on "Next" 68ms

Then I should see a "Confirm Software Channel Change" text 59ms

When I click on "Confirm" 63ms

Then I should see a "Changing the channels has been scheduled." text 311ms

And I wait until event "Subscribe channels scheduled" is completed 39s 618ms

Given I am on the Systems overview page of this "deblike_minion" 1s 174ms

Then I check for failed events on history event page 1m 954ms

When I follow the left menu "Salt > Remote Commands" 132ms

Then I should see a "Remote Commands" text in the content area 29ms

When I enter command "cat /etc/os-release" 100ms

And I enter target "deblike_minion" 97ms

And I click on preview 15s 576ms

And I click on run 51ms

Then I should see "deblike_minion" hostname 57ms

When I wait until I see "show response" text 5s 221ms

And I expand the results for "deblike_minion" 55ms

Then I should see a "ID=ubuntu" text 53ms

Given I am on the Systems overview page of this "deblike_minion" 1s 85ms

Then I check for failed events on history event page 1m 11s 244ms

When I am on the Systems overview page of this "deblike_minion" 1s 155ms

And I follow "Delete System" 540ms

Then I should see a "Confirm System Profile Deletion" text 65ms

When I click on "Delete Profile" 72ms

And I wait until I see "has been deleted" text 13s 745ms

Then "deblike_minion" should not be registered 482ms

The hostname of deblike_minion is uyuni-master-deblike-minion

When I follow the left menu "Systems > Bootstrapping" 89ms

Then I should see a "Bootstrap Minions" text 69ms

When I enter the hostname of "deblike_minion" as "hostname" 141ms

And I enter "22" as "port" 59ms

And I enter "root" as "user" 66ms

And I enter "linux" as "password" 71ms

And I select the hostname of "proxy" from "proxies" if present 87ms

And I click on "Bootstrap" 69ms

And I wait at most 480 seconds until I see "Bootstrap process initiated." text 26s 348ms

And I follow the left menu "Systems > System List > All" 155ms

And I wait until I see the name of "deblike_minion", refreshing the page 44s 307ms

And I wait until onboarding is completed for "deblike_minion" 39s 938ms

Given I am on the Systems overview page of this "deblike_minion" 965ms

When I follow "Software" in the content area 82ms

And I follow "Software Channels" in the content area 71ms

And I wait until I do not see "Loading..." text 71ms

And I check radio button "Fake-Base-Channel-Debian-like" 10s 80ms

And I wait until I do not see "Loading..." text 483ms

And I click on "Next" 63ms

Then I should see a "Confirm Software Channel Change" text 75ms

When I click on "Confirm" 80ms

Then I should see a "Changing the channels has been scheduled." text 384ms

And I wait until event "Subscribe channels scheduled" is completed 18s 904ms

@scope_salt_ssh @scope_onboarding @ssh_minion @skip_if_github_validation
Feature:Register a salt-ssh system via API 4m 7s 219ms 11 1

Given I am authorized 2s 578ms

Given I am on the Systems overview page of this "ssh_minion" 2s 165ms

When I follow "Delete System" 550ms

Then I should see a "Confirm System Profile Deletion" text 60ms

When I click on "Delete Profile" 88ms

And I wait until I see "has been deleted" text 15s 170ms

Then "ssh_minion" should not be registered 463ms

Given I block connections from "server" on "ssh_minion" 842ms

When I call system.bootstrap() on host "ssh_minion" and salt-ssh "enabled" 47s 719ms

When I follow the left menu "Systems > System List > All" 104ms

And I wait until I see the name of "ssh_minion", refreshing the page 30s 813ms

And I wait until onboarding is completed for "ssh_minion" 52s 783ms

Given I am on the Systems overview page of this "ssh_minion" 1s 185ms

Then I should see a "Push via SSH" text 88ms

Given I am on the Systems overview page of this "proxy" 1s 144ms

When I follow "Details" in the content area 83ms

And I follow "Proxy" in the content area 73ms

Then I should see "ssh_minion" hostname 95ms

Given I am on the Systems overview page of this "ssh_minion" 1s 31ms

Then I run spacecmd listeventhistory for "ssh_minion" 6s 708ms

Given I am on the Systems overview page of this "ssh_minion" 969ms

Then I check for failed events on history event page 40s 954ms

Given I am on the Systems overview page of this "ssh_minion" 0s

When I follow "Software" in the content area 0s

And I follow "Software Channels" in the content area 0s

And I wait until I do not see "Loading..." text 0s

And I check radio button "SLE-Product-SLES15-SP7-Pool for x86_64" 0s

And I wait until I do not see "Loading..." text 0s

And I include the recommended child channels 0s

And I check "SLE-Module-DevTools15-SP7-Pool for x86_64" 0s

And I check "Fake-RPM-SUSE-Channel" 0s

And I click on "Next" 0s

Then I should see a "Confirm Software Channel Change" text 0s

When I click on "Confirm" 0s

Then I should see a "Changing the channels has been scheduled." text 0s

And I wait until event "Subscribe channels scheduled" is completed 0s

Warning: Radio button 'openSUSE Tumbleweed (x86_64)' is already checked

Given I am on the Systems overview page of this "ssh_minion" 953ms

When I follow "Software" in the content area 72ms

And I follow "Software Channels" in the content area 69ms

And I wait until I do not see "Loading..." text 72ms

And I check radio button "openSUSE Tumbleweed (x86_64)" 139ms

And I wait until I do not see "Loading..." text 418ms

And I check "Uyuni Client Tools for openSUSE Tumbleweed (x86_64) (Development)" 43ms

And I check "Fake-RPM-SUSE-Channel" 42ms

And I click on "Next" 67ms

Then I should see a "Confirm Software Channel Change" text 64ms

When I click on "Confirm" 81ms

Then I should see a "Changing the channels has been scheduled." text 312ms

And I wait until event "Subscribe channels scheduled" is completed 38s 511ms

When I flush firewall on "ssh_minion" 695ms

Given I am authorized 2s 373ms

Given I am on the Systems overview page of this "sle_minion" 1s 806ms

When I follow "Delete System" 570ms

Then I should see a "Confirm System Profile Deletion" text 64ms

When I click on "Delete Profile" 65ms

And I wait until I see "has been deleted" text 4m 3s 644ms

And I wait until Salt client is inactive on "sle_minion" 717ms

Then "sle_minion" should not be registered 395ms

When I backup the SSH authorized_keys file of host "sle_minion" 405ms

And I add pre-generated SSH public key to authorized_keys of host "sle_minion" 858ms

The hostname of sle_minion is uyuni-master-suse-minion.sumaci.aws

When I follow the left menu "Systems > Bootstrapping" 85ms

Then I should see a "Bootstrap Minions" text 62ms

When I enter the hostname of "sle_minion" as "hostname" 153ms

And I enter "22" as "port" 71ms

And I enter "root" as "user" 64ms

And I check radio button "SSH Private Key" 10s 76ms

And I attach the file "ssh_keypair/id_rsa_bootstrap-passphrase_linux" to "privKeyFile" 42ms

And I enter "you-shall-not-pass" as "privKeyPwd" 101ms

And I click on "Bootstrap" 69ms

And I wait until I see "An error has occurred during salt execution: unable to establish ssh connection." text 7s 336ms

Then I should see a "Details" button 18ms

When I click on "Details" 76ms

And I wait at most 10 seconds until I see modal containing "Error Details" text 13ms

Then I should see a "Standard Error" text 71ms

And I should see "Permission denied, no authentication information" or "Permission denied (publickey,password,keyboard-interactive)" in the stderr textarea 20s 43ms Show Error +
                                            
Text 'Permission denied, no authentication information' and 'Permission denied (publickey,password,keyboard-interactive)' not found (ScriptError) ./features/step_definitions/navigation_steps.rb:734:in `block (2 levels) in (top (required))' ./features/step_definitions/navigation_steps.rb:733:in `/^I should see "([^"]*)" or "([^"]*)" in the ([^ ]+) textarea$/' features/secondary/min_bootstrap_ssh_key.feature:44:in `I should see "Permission denied, no authentication information" or "Permission denied (publickey,password,keyboard-interactive)" in the stderr textarea'

When I close the modal dialog 0s

The hostname of sle_minion is uyuni-master-suse-minion.sumaci.aws

When I follow the left menu "Systems > Bootstrapping" 81ms

Then I should see a "Bootstrap Minions" text 70ms

When I enter the hostname of "sle_minion" as "hostname" 140ms

And I enter "22" as "port" 55ms

And I enter "root" as "user" 60ms

And I check radio button "SSH Private Key" 10s 76ms

And I attach the file "ssh_keypair/id_rsa_bootstrap-passphrase_linux" to "privKeyFile" 41ms

And I enter "linux" as "privKeyPwd" 83ms

And I select the hostname of "proxy" from "proxies" if present 76ms

And I click on "Bootstrap" 71ms

And I wait at most 480 seconds until I see "Bootstrap process initiated." text 33s 368ms

It took 4 seconds to contact the minion

When I follow the left menu "Salt > Keys" 138ms

Then I should see a "accepted" text 431ms

When I am on the Systems page 249ms

And I wait until I see the name of "sle_minion", refreshing the page 1m 11s 338ms

And I wait until onboarding is completed for "sle_minion" 8s 331ms

Then the Salt master can reach "sle_minion" 3s 837ms

Given I am on the Systems overview page of this "sle_minion" 1s 175ms

Then I should see a "Default" text 82ms

When I restore the SSH authorized_keys file of host "sle_minion" 1s 204ms

@skip_if_containerized_server @skip_if_github_validation @sle_minion @scope_onboarding
Feature:Register a Salt minion with a bootstrap script < 1ms 11

1) delete SLES minion and register again with bootstrap script
2) subscribe minion to a base channels
3) install and remove a package

Given I am on the Systems overview page of this "sle_minion" 0s

When I follow "Delete System" 0s

Then I should see a "Confirm System Profile Deletion" text 0s

When I click on "Delete Profile" 0s

And I wait until I see "has been deleted" text 0s

And I wait until Salt client is inactive on "sle_minion" 0s

Then "sle_minion" should not be registered 0s

When I bootstrap "sle_minion" using bootstrap script with activation key "1-SUSE-KEY-x86_64" from the proxy 0s

And I wait at most 10 seconds until Salt master sees "sle_minion" as "unaccepted" 0s

And I accept "sle_minion" key in the Salt master 0s

Then I should see "sle_minion" via spacecmd 0s

When I follow the left menu "Systems > System List > All" 0s

And I wait until I see the name of "sle_minion", refreshing the page 0s

And I wait until onboarding is completed for "sle_minion" 0s

Given I am on the Systems overview page of this "sle_minion" 0s

When I follow "Software" in the content area 0s

And I follow "Software Channels" in the content area 0s

And I wait until I do not see "Loading..." text 0s

And I check radio button "SLE-Product-SLES15-SP7-Pool for x86_64" 0s

And I wait until I do not see "Loading..." text 0s

And I include the recommended child channels 0s

And I check "SLE-Module-DevTools15-SP7-Pool for x86_64" 0s

And I check "Fake-RPM-SUSE-Channel" 0s

And I click on "Next" 0s

Then I should see a "Confirm Software Channel Change" text 0s

When I click on "Confirm" 0s

Then I should see a "Changing the channels has been scheduled." text 0s

And I wait until event "Subscribe channels scheduled" is completed 0s

Given I am on the Systems overview page of this "sle_minion" 0s

When I follow "Software" in the content area 0s

And I follow "Software Channels" in the content area 0s

And I wait until I do not see "Loading..." text 0s

And I check radio button "openSUSE Tumbleweed (x86_64)" 0s

And I wait until I do not see "Loading..." text 0s

And I check "Uyuni Client Tools for openSUSE Tumbleweed (x86_64) (Development)" 0s

And I check "Fake-RPM-SUSE-Channel" 0s

And I click on "Next" 0s

Then I should see a "Confirm Software Channel Change" text 0s

When I click on "Confirm" 0s

Then I should see a "Changing the channels has been scheduled." text 0s

And I wait until event "Subscribe channels scheduled" is completed 0s

Given I am on the Systems overview page of this "sle_minion" 0s

When I follow "Software" in the content area 0s

And I follow "Install" 0s

And I enter "orion-dummy" as the filtered package name 0s

And I click on the filter button 0s

And I check row with "orion-dummy" and arch of "sle_minion" 0s

And I click on "Install Packages" 0s

And I click on "Confirm" 0s

Then I should see a "1 package install has been scheduled for" text 0s

When I wait until event "Package Install/Upgrade scheduled" is completed 0s

Then "orion-dummy-1.1-1.1" should be installed on "sle_minion" 0s

When I follow the left menu "Salt > Remote Commands" 0s

Then I should see a "Remote Commands" text in the content area 0s

When I enter command "file /tmp" 0s

And I click on preview 0s

Then I should see "sle_minion" hostname 0s

And I wait until I do not see "pending" text 0s

When I click on run 0s

And I wait until I do not see "pending" text 0s

And I expand the results for "sle_minion" 0s

Then I should see "/tmp: sticky, directory" in the command output for "sle_minion" 0s

Given I am on the Systems overview page of this "sle_minion" 0s

Then I run spacecmd listeventhistory for "sle_minion" 0s

When I remove package "orion-dummy-1.1-1.1" from this "sle_minion" 0s

Then "orion-dummy-1.1-1.1" should not be installed on "sle_minion" 0s

@skip_if_github_validation @scope_salt_ssh @ssh_minion
Feature:Register a Salt system to be managed via SSH tunnel 11m 45s 329ms 9 1

Given I am authorized 1s 923ms

When I remove package "milkyway-dummy" from this "ssh_minion" without error control 1s 686ms

Given I am on the Systems overview page of this "ssh_minion" 1s 202ms

When I follow "Delete System" 476ms

Then I should see a "Confirm System Profile Deletion" text 62ms

When I click on "Delete Profile" 68ms

And I wait until I see "has been deleted" text 14s 917ms

Then "ssh_minion" should not be registered 478ms

The hostname of ssh_minion is uyuni-master-suse-sshminion.sumaci.aws

When I follow the left menu "Systems > Bootstrapping" 91ms

Then I should see a "Bootstrap Minions" text 62ms

And I enter the hostname of "ssh_minion" as "hostname" 165ms

And I enter "22" as "port" 61ms

And I enter "root" as "user" 65ms

And I enter "linux" as "password" 67ms

And I select "1-SUSE-SSH-TUNNEL-KEY-x86_64" from "activationKeys" 81ms

And I select the hostname of "proxy" from "proxies" if present 69ms

And I check "manageWithSSH" 93ms

And I click on "Bootstrap" 66ms

And I wait at most 480 seconds until I see "Bootstrap process initiated." text 43s 127ms

And I wait until onboarding is completed for "ssh_minion" 1m 51s 623ms

Given I am on the Systems overview page of this "ssh_minion" 1s 198ms

Then I should see a "Push via SSH tunnel" text 88ms

Given I am on the Systems overview page of this "ssh_minion" 1s 140ms

When I follow "Software" in the content area 81ms

And I follow "Install" 571ms

And I enter "milkyway-dummy" as the filtered package name 62ms

And I click on the filter button 627ms

And I wait until I see "milkyway-dummy" text 74ms

And I check row with "milkyway-dummy" and arch of "ssh_minion" 67ms

And I click on "Install Packages" 601ms

And I click on "Confirm" 756ms

Then I should see a "1 package install has been scheduled for" text 62ms

Then I wait until event "Package Install/Upgrade scheduled" is completed 55s 198ms

Given I am on the Systems overview page of this "ssh_minion" 1s 183ms

And I follow "Software" in the content area 88ms

And I follow "List / Remove" 797ms

And I enter "milkyway-dummy" as the filtered package name 63ms

And I click on the filter button 970ms

And I wait until I see "milkyway-dummy" text 4m 10s 66ms Show Error +
                                            
Text 'milkyway-dummy' not found (ScriptError) ./features/step_definitions/navigation_steps.rb:40:in `/^I wait until I see "([^"]*)" text$/' features/secondary/minssh_tunnel.feature:66:in `I wait until I see "milkyway-dummy" text'

And I check "milkyway-dummy" in the list 0s

And I click on "Remove Packages" 0s

And I click on "Confirm" 0s

Then I should see a "1 package removal has been scheduled" text 0s

Then I wait until event "Package Removal scheduled" is completed 0s

21s 287ms Show Info +
14:03:41:000 - 14:07:55:000 | Current URL: https://uyuni-master-server.sumaci.aws/rhn/systems/details/packages/PackageList.do?sid=1000010012
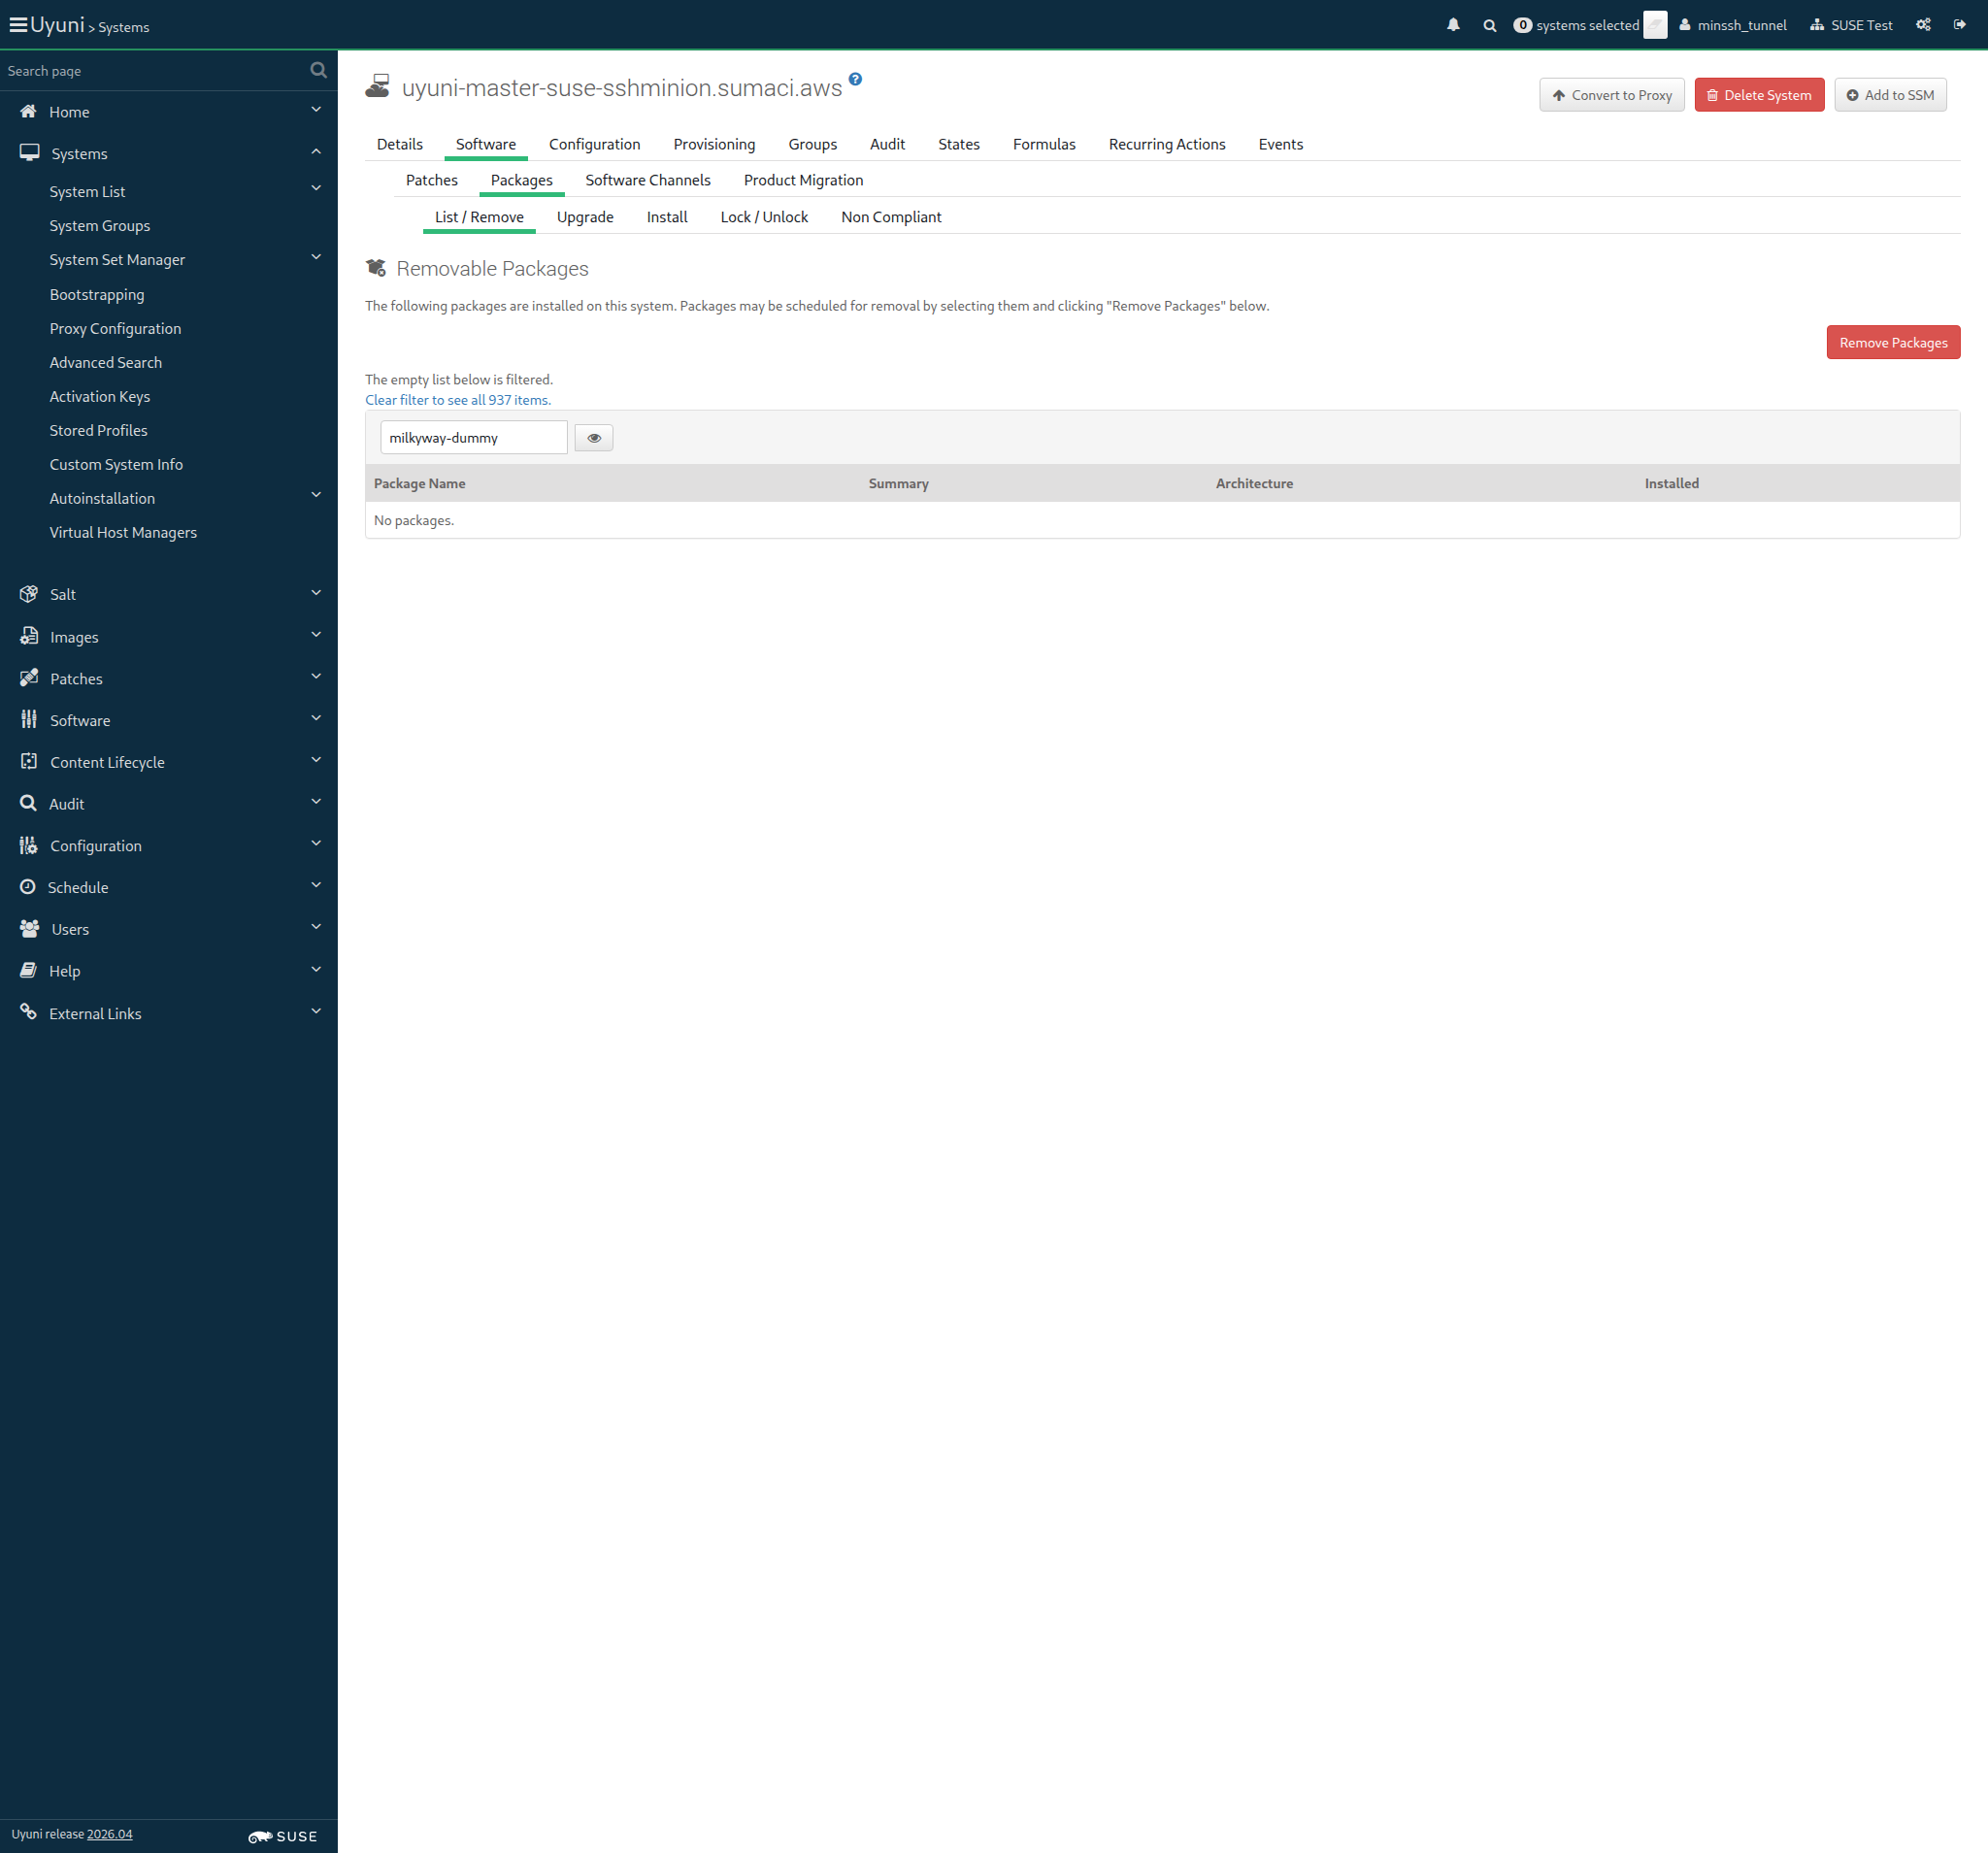
Screenshot +


The hostname of ssh_minion is uyuni-master-suse-sshminion.sumaci.aws

When I follow the left menu "Salt > Remote Commands" 147ms

Then I should see a "Remote Commands" text in the content area 26ms

When I enter command "echo 'My remote command output'" 115ms

And I enter the hostname of "ssh_minion" as "target" 129ms

And I click on preview 19s 261ms

Then I should see a "Target systems (1)" text 65ms

When I wait until I do not see "pending" text 53ms

And I click on run 54ms

And I wait until I see "show response" text 9s 846ms

And I expand the results for "ssh_minion" 55ms

Then I should see "My remote command output" in the command output for "ssh_minion" 20ms

Given I am on the Systems overview page of this "ssh_minion" 1s 72ms

When I follow "Delete System" 664ms

Then I should see a "Confirm System Profile Deletion" text 65ms

When I click on "Delete Profile" 74ms

And I wait until I see "has been deleted" text 20s 721ms

Then "ssh_minion" should not be registered 471ms

When I call system.bootstrap() on host "ssh_minion" and salt-ssh "enabled" 43s 938ms

And I follow the left menu "Systems > System List > All" 105ms

And I wait until I see the name of "ssh_minion", refreshing the page 17s 400ms

And I wait until onboarding is completed for "ssh_minion" 1m 19s 663ms

Given I am authorized 1s 970ms

Given I am on the Systems overview page of this "sle_minion" 2s 612ms

When I follow "Delete System" 556ms

Then I should see a "Confirm System Profile Deletion" text 64ms

When I click on "Delete Profile" 83ms

And I wait until I see "has been deleted" text 4m 3s 719ms

And I wait until Salt client is inactive on "sle_minion" 789ms

Then "sle_minion" should not be registered 362ms

When I follow the left menu "Configuration > Channels" 143ms

And I follow "Create Config Channel" 349ms

And I enter "Key Channel" as "cofName" 75ms

And I enter "keychannel" as "cofLabel" 61ms

And I enter "This is a configuration channel for the activation key" as "cofDescription" 100ms

And I click on "Create Config Channel" 628ms

Then I should see a "Key Channel" text 69ms

When I follow the left menu "Configuration > Channels" 74ms

And I follow "Key Channel" 382ms

And I follow "Create Configuration File or Directory" 426ms

And I enter "/etc/euler.conf" as "cffPath" 73ms

And I enter "e^i.pi=-1" in the editor 4ms

And I click on "Create Configuration File" 72ms

When I follow the left menu "Systems > Activation Keys" 0s

And I follow "Create Key" 0s

And I wait for child channels to appear 0s

And I enter "Minion testing" as "description" 0s

And I enter "MINION-TEST" as "key" 0s

And I enter "20" as "usageLimit" 0s

And I select "SLE-Product-SLES15-SP7-Pool for x86_64" from "selectedBaseChannel" 0s

And I wait for child channels to appear 0s

And I include the recommended child channels 0s

And I check "SLE-Module-DevTools15-SP7-Pool for x86_64" 0s

And I check "Fake-RPM-SUSE-Channel" 0s

And I click on "Create Activation Key" 0s

And I follow "Configuration" in the content area 0s

And I follow first "Subscribe to Channels" in the content area 0s

And I check "Key Channel" in the list 0s

And I click on "Continue" 0s

And I follow "Packages" 0s

And I enter "orion-dummy perseus-dummy" as "packages" 0s

And I click on "Update Activation Key" 0s

Then I should see a "Activation key Minion testing has been modified" text 0s

When I follow the left menu "Systems > Activation Keys" 135ms

And I follow "Create Key" 380ms

And I wait for child channels to appear 1s 200ms

And I enter "Minion testing" as "description" 94ms

And I enter "MINION-TEST" as "key" 96ms

And I enter "20" as "usageLimit" 66ms

And I select "openSUSE Tumbleweed (x86_64)" from "selectedBaseChannel" 92ms

And I wait for child channels to appear 397ms

And I check "Uyuni Client Tools for openSUSE Tumbleweed (x86_64) (Development)" 120ms

And I check "Fake-RPM-SUSE-Channel" 84ms

And I click on "Create Activation Key" 756ms

And I follow "Configuration" in the content area 78ms

And I follow first "Subscribe to Channels" in the content area 78ms

And I check "Key Channel" in the list 65ms

And I click on "Continue" 593ms

And I follow "Packages" 326ms

And I enter "orion-dummy perseus-dummy" as "packages" 73ms

And I click on "Update Activation Key" 68ms

Then I should see a "Activation key Minion testing has been modified" text 62ms

The hostname of sle_minion is uyuni-master-suse-minion.sumaci.aws

When I follow the left menu "Systems > Bootstrapping" 77ms

Then I should see a "Bootstrap Minions" text 64ms

When I enter the hostname of "sle_minion" as "hostname" 146ms

And I enter "22" as "port" 57ms

And I enter "root" as "user" 65ms

And I enter "linux" as "password" 67ms

And I select "1-MINION-TEST" from "activationKeys" 69ms

And I select the hostname of "proxy" from "proxies" if present 71ms

And I click on "Bootstrap" 69ms

And I wait until I see "Bootstrap process initiated." text 25s 343ms

And I follow the left menu "Systems > System List > All" 170ms

And I wait until I see the name of "sle_minion", refreshing the page 44s 403ms

And I wait until onboarding is completed for "sle_minion" 39s 493ms

It took 4 seconds to contact the minion

When I follow the left menu "Salt > Keys" 140ms

Then I should see a "accepted" text 364ms

And the Salt master can reach "sle_minion" 3s 802ms

When I wait for "orion-dummy" to be installed on "sle_minion" 1s 306ms

And I wait for "perseus-dummy" to be installed on "sle_minion" 910ms

Given I am on the Systems overview page of this "sle_minion" 1s 78ms

Then I run spacecmd listeventhistory for "sle_minion" 6s 278ms

Given I am on the Systems page 0s

Then I should see a "SLE-Product-SLES15-SP7-Pool for x86_64" text 0s

Given I am on the Systems page 240ms

Then I should see a "openSUSE Tumbleweed (x86_64)" text 550ms

Given I am on the Systems overview page of this "sle_minion" 946ms

When I follow "Configuration" in the content area 89ms

Then I should see a "1 configuration channel" text 71ms

When I follow "View Files" in the content area 73ms

Then I should see a "/etc/euler.conf" text 77ms

And I should see a "Key Channel" text 70ms

Given I am on the Systems overview page of this "sle_minion" 974ms

When I follow "States" in the content area 77ms

And I follow "Packages" 510ms

Then I should see a "Package States" text 62ms

When I change the state of "orion-dummy" to "Unmanaged" and "" 191ms

And I change the state of "perseus-dummy" to "Unmanaged" and "" 49ms

Then I should see a "2 Changes" text 68ms

When I click save 57ms

Then I wait until I see "Package states have been saved." text 288ms

And I click apply 58ms

And I remove package "orion-dummy" from this "sle_minion" 2s 260ms

And I remove package "perseus-dummy" from this "sle_minion" 2s 538ms

When I follow the left menu "Configuration > Channels" 137ms

And I follow "Key Channel" 495ms

And I follow "Delete Channel" 319ms

And I click on "Delete Config Channel" 72ms

When I follow the left menu "Systems > Activation Keys" 555ms

And I follow "Minion testing" in the content area 78ms

And I follow "Delete Key" 417ms

And I click on "Delete Activation Key" 538ms

Then I should see a "Activation key Minion testing has been deleted." text 81ms

Given I am on the Systems overview page of this "sle_minion" 1s 22ms

Then I check for failed events on history event page 1m 1s 139ms

@skip_if_github_validation @scope_onboarding
Feature:Register a Salt minion via API 7m 28s 860ms 11 1

Given I am authorized 2s 502ms

Given I am on the Systems overview page of this "sle_minion" 2s 300ms

When I follow "Delete System" 503ms

Then I should see a "Confirm System Profile Deletion" text 66ms

When I click on "Delete Profile" 72ms

And I wait until I see "has been deleted" text 4m 3s 856ms

And I wait until Salt client is inactive on "sle_minion" 737ms

Then "sle_minion" should not be registered 494ms

When I call system.bootstrap() on host "sle_minion" and salt-ssh "disabled" 24s 389ms

It took 4 seconds to contact the minion

When I follow the left menu "Salt > Keys" 162ms

Then I should see a "accepted" text 374ms

When I follow the left menu "Systems > System List > All" 212ms

And I wait until I see the name of "sle_minion", refreshing the page 1m 11s 638ms

And I wait until onboarding is completed for "sle_minion" 9s 134ms

Then the Salt master can reach "sle_minion" 3s 935ms

Given I am on the Systems overview page of this "sle_minion" 991ms

Then I should see a "Default" text 94ms

Given I am on the Systems overview page of this "proxy" 1s 29ms

When I follow "Details" in the content area 80ms

And I follow "Proxy" in the content area 77ms

Then I should see "sle_minion" hostname 103ms

Given I am on the Systems overview page of this "sle_minion" 1s 207ms

Then I run spacecmd listeventhistory for "sle_minion" 7s 457ms

Given I am on the Systems overview page of this "sle_minion" 0s

When I follow "Software" in the content area 0s

And I follow "Software Channels" in the content area 0s

And I wait until I do not see "Loading..." text 0s

And I check radio button "SLE-Product-SLES15-SP7-Pool for x86_64" 0s

And I wait until I do not see "Loading..." text 0s

And I include the recommended child channels 0s

And I check "SLE-Module-DevTools15-SP7-Pool for x86_64" 0s

And I check "Fake-RPM-SUSE-Channel" 0s

And I click on "Next" 0s

Then I should see a "Confirm Software Channel Change" text 0s

When I click on "Confirm" 0s

Then I should see a "Changing the channels has been scheduled." text 0s

And I wait until event "Subscribe channels scheduled" is completed 0s

Warning: Radio button 'openSUSE Tumbleweed (x86_64)' is already checked

Given I am on the Systems overview page of this "sle_minion" 1s 113ms

When I follow "Software" in the content area 85ms

And I follow "Software Channels" in the content area 77ms

And I wait until I do not see "Loading..." text 69ms

And I check radio button "openSUSE Tumbleweed (x86_64)" 180ms

And I wait until I do not see "Loading..." text 515ms

And I check "Uyuni Client Tools for openSUSE Tumbleweed (x86_64) (Development)" 46ms

And I check "Fake-RPM-SUSE-Channel" 43ms

And I click on "Next" 69ms

Then I should see a "Confirm Software Channel Change" text 67ms

When I click on "Confirm" 66ms

Then I should see a "Changing the channels has been scheduled." text 349ms

And I wait until event "Subscribe channels scheduled" is completed 19s 140ms

Given I am on the Systems overview page of this "sle_minion" 1s 4ms

Then I check for failed events on history event page 50s 936ms

When I call system.bootstrap() on unknown host, I should get an API fault 2s 924ms

When I call system.bootstrap() on a Salt minion with saltSSH = true, but with activation key with default contact method, I should get an API fault 742ms

@skip_if_github_validation @sle_minion @scope_onboarding
Feature:Bootstrapping with reactivation key 8m 34s 578ms 8

In order to re-register valid minions
As an authorized user
I want to avoid re-registration with invalid input parameters

Given I am authorized 2s 246ms

Given I am on the Systems overview page of this "sle_minion" 2s 214ms

When I follow "Reactivation" 580ms

And I click on "Generate New Key" 693ms

Then I should see a "Key:" text 67ms

The hostname of sle_minion is uyuni-master-suse-minion.sumaci.aws

When I follow the left menu "Systems > Bootstrapping" 86ms

Then I should see a "Bootstrap Minions" text 62ms

When I enter the hostname of "sle_minion" as "hostname" 154ms

And I enter "22" as "port" 60ms

And I enter "root" as "user" 62ms

And I enter "linux" as "password" 65ms

And I click on "Bootstrap" 73ms

And I wait until I see "A salt key for this host" text 266ms

Then I should not see a "GenericSaltError" text 64ms

And I should see a "seems to already exist, please check!" text 61ms

The hostname of sle_minion is uyuni-master-suse-minion.sumaci.aws

Given I delete "sle_minion" key in the Salt master 3s 857ms

When I follow the left menu "Systems > Bootstrapping" 71ms

Then I should see a "Bootstrap Minions" text 64ms

When I enter the hostname of "sle_minion" as "hostname" 138ms

And I enter "22" as "port" 51ms

And I enter "root" as "user" 56ms

And I enter "linux" as "password" 65ms

And I click on "Bootstrap" 65ms

And I wait until I see "seems to already exist, please check!" text 277ms

Then I should not see a "GenericSaltError" text 64ms

And I should see a "with minion id" text 65ms

The hostname of sle_minion is uyuni-master-suse-minion.sumaci.aws
Reactivation Key: re-1-e1fc90e25ec0486181283c76e4395ae2

When I follow the left menu "Systems > Bootstrapping" 73ms

Then I should see a "Bootstrap Minions" text 65ms

When I enter the hostname of "sle_minion" as "hostname" 136ms

And I enter "22" as "port" 58ms

And I enter "root" as "user" 64ms

And I enter "linux" as "password" 62ms

And I enter the reactivation key of "sle_minion" 1s 90ms

And I select "1-SUSE-KEY-x86_64" from "activationKeys" 86ms

And I click on "Bootstrap" 66ms

And I wait until I see "Bootstrap process initiated." text 34s 83ms

And I follow the left menu "Systems > System List > All" 168ms

And I wait until I see the name of "sle_minion", refreshing the page 723ms

And I wait until onboarding is completed for "sle_minion" 1m 28s 65ms

Given I am on the Systems overview page of this "sle_minion" 1s 278ms

When I follow "Events" in the content area 94ms

And I follow "History" in the content area 68ms

And I wait until I see "Server reactivated as Salt minion" text, refreshing the page 92ms

And I wait until event "Apply states [certs, channels, packages, services.salt-minion] scheduled" is completed 2s 301ms

Given I am on the Systems overview page of this "sle_minion" 960ms

When I follow "Delete System" 498ms

Then I should see a "Confirm System Profile Deletion" text 66ms

When I click on "Delete Profile" 75ms

And I wait until I see "has been deleted" text 4m 2s 833ms

And I wait until Salt client is inactive on "sle_minion" 764ms

Then "sle_minion" should not be registered 381ms

The hostname of sle_minion is uyuni-master-suse-minion.sumaci.aws

When I perform a full salt minion cleanup on "sle_minion" 6s 684ms

And I follow the left menu "Systems > Bootstrapping" 91ms

Then I should see a "Bootstrap Minions" text 78ms

When I enter the hostname of "sle_minion" as "hostname" 164ms

And I enter "22" as "port" 64ms

And I enter "root" as "user" 74ms

And I enter "linux" as "password" 76ms

And I select "1-SUSE-KEY-x86_64" from "activationKeys" 83ms

And I select the hostname of "proxy" from "proxies" if present 71ms

And I click on "Bootstrap" 68ms

And I wait until I see "Bootstrap process initiated." text 36s 27ms

And I follow the left menu "Systems > System List > All" 170ms

And I wait until I see the name of "sle_minion", refreshing the page 44s 921ms

And I wait until onboarding is completed for "sle_minion" 40s 298ms

@skip_if_github_validation @sle_minion @scope_salt
Feature:Management of minion keys 8m 47s 212ms 9

In Order to validate the minion onboarding page
As an authorized user
I want to verify all the minion key management features in the UI

Given I am authorized 2s 561ms

Given I am on the Systems overview page of this "sle_minion" 2s 335ms

When I follow "Delete System" 505ms

Then I should see a "Confirm System Profile Deletion" text 70ms

When I click on "Delete Profile" 103ms

And I wait until I see "has been deleted" text 4m 3s 729ms

And I wait until Salt client is inactive on "sle_minion" 724ms

Then "sle_minion" should not be registered 381ms

When I follow the left menu "Salt > Keys" 150ms

Then I should see a "Keys" text in the content area 27ms

When I configure salt minion on "sle_minion" 414ms

And I restart salt-minion on "sle_minion" 658ms

And I wait at most 10 seconds until Salt master sees "sle_minion" as "unaccepted" 5s 400ms

And I follow the left menu "Salt > Keys" 69ms

And I refresh page until I see "sle_minion" hostname as text 10s 144ms

Then I should see a "Fingerprint" text 69ms

And I see "sle_minion" fingerprint 1s 972ms

And I should see a "pending" text 66ms

And I follow the left menu "Salt > Keys" 64ms

And I reject "sle_minion" from the Pending section 335ms

And I wait at most 10 seconds until Salt master sees "sle_minion" as "rejected" 4s 686ms

Then I should see a "rejected" text 69ms

When I stop salt-minion on "sle_minion" 1s 527ms

And I delete "sle_minion" from the Rejected section 51ms

And I refresh page until I do not see "sle_minion" hostname as text 13s 640ms

When I start salt-minion on "sle_minion" 966ms

And I wait at most 10 seconds until Salt master sees "sle_minion" as "unaccepted" 3s 665ms

Then "sle_minion" should not be registered 374ms

When I follow the left menu "Salt > Keys" 68ms

Then I should see a "pending" text 344ms

When I accept "sle_minion" key 55ms

And I wait at most 10 seconds until Salt master sees "sle_minion" as "accepted" 3s 348ms

And I wait until onboarding is completed for "sle_minion" 1m 19s 907ms

Then "sle_minion" should be registered 442ms

It took 3 seconds to contact the minion

Then the Salt master can reach "sle_minion" 3s 920ms

When I get OS information of "sle_minion" from the Master 3s 483ms

Then it should contain the OS of "sle_minion" < 1ms

Given I am on the Systems overview page of this "sle_minion" 1s 58ms

When I stop salt-minion on "sle_minion" 3s 16ms

And I follow "Delete System" 480ms

Then I should see a "Confirm System Profile Deletion" text 63ms

When I click on "Delete Profile" 72ms

Then I wait until I see "Cleanup timed out. Please check if the machine is reachable." text 7s 753ms

When I click on "Delete Profile Without Cleanup" in "An error occurred during cleanup" modal 2s 1ms

And I wait until I see "has been deleted" text 80ms

Then "sle_minion" should not be registered 475ms

The hostname of sle_minion is uyuni-master-suse-minion.sumaci.aws

When I perform a full salt minion cleanup on "sle_minion" 6s 439ms

And I follow the left menu "Systems > Bootstrapping" 81ms

Then I should see a "Bootstrap Minions" text 78ms

When I enter the hostname of "sle_minion" as "hostname" 153ms

And I enter "22" as "port" 60ms

And I enter "root" as "user" 66ms

And I enter "linux" as "password" 85ms

And I select "1-SUSE-KEY-x86_64" from "activationKeys" 85ms

And I select the hostname of "proxy" from "proxies" if present 66ms

And I click on "Bootstrap" 71ms

And I wait until I see "Bootstrap process initiated." text 35s 784ms

And I wait until onboarding is completed for "sle_minion" 1m 22s 897ms

When I enable repository "test_repo_rpm_pool" on this "sle_minion" 744ms

When I refresh the metadata for "sle_minion" 836ms

And I install old package "virgo-dummy-1.0" on this "sle_minion" without error control 868ms

When I remove package "andromeda-dummy" from this "sle_minion" without error control 1s 532ms

And I refresh the metadata for "sle_minion" 865ms

And I refresh packages list via spacecmd on "sle_minion" 7s 303ms

And I wait until refresh package list on "sle_minion" is finished 12s 239ms

When I refresh packages list via spacecmd on "sle_minion" 6s 200ms

And I wait until refresh package list on "sle_minion" is finished 12s 448ms

Then spacecmd should show packages "virgo-dummy-1.0" installed on "sle_minion" 7s 818ms

And I wait until package "andromeda-dummy-2.0-1.1" is removed from "sle_minion" via spacecmd 7s 881ms

Given I am authorized for the "Admin" section 2s 202ms

Given I am on the Systems overview page of this "sle_minion" 1s 559ms

When I follow "Software" in the content area 83ms

And I follow "List / Remove" in the content area 102ms

And I enter "virgo-dummy" as the filtered package name 166ms

And I click on the filter button until page does contain "virgo-dummy" text 10s 993ms

When I follow the left menu "Admin > Task Schedules" 138ms

And I follow "errata-cache-default" 1s 221ms

And I follow "errata-cache-bunch" 1s 295ms

And I click on "Single Run Schedule" 1s 244ms

Then I should see a "bunch was scheduled" text 265ms

When I wait until the table contains "FINISHED" or "SKIPPED" followed by "FINISHED" in its first rows 2s 537ms

Given I am on the Systems overview page of this "sle_minion" 1s 2ms

When I follow "Software" in the content area 82ms

And I follow "Patches" in the content area 69ms

And I enter "virgo" as the filtered synopsis 49ms

And I click on the filter button 10s 150ms

And I check "virgo-dummy-3456" in the list 68ms

And I check "allowVendorChange" 84ms

And I click on "Apply Patches" 752ms

And I click on "Confirm" 855ms

Then I should see a "1 patch update has been scheduled for" text 79ms

When I wait for "virgo-dummy-2.0-1.1" to be installed on "sle_minion" 8s 791ms

Then vendor change should be enabled for package actions on "sle_minion" 1s 72ms

Given I am on the Systems overview page of this "sle_minion" 1s 54ms

When I follow "Software" in the content area 86ms

And I follow "Packages" 448ms

And I follow "Install" 503ms

And I enter "andromeda" as the filtered package name 107ms

And I click on the filter button 619ms

And I check "andromeda-dummy-2.0-1.1" in the list 62ms

And I click on "Install Packages" 794ms

And I click on "Confirm" 788ms

Then I should see a "1 package install has been scheduled" text 63ms

When I wait for "andromeda-dummy-2.0-1.1" to be installed on "sle_minion" 8s 676ms

Then vendor change should be enabled for package actions on "sle_minion" 1s 47ms

When I disable repository "test_repo_rpm_pool" on this "sle_minion" 454ms

When I remove package "virgo-dummy" from this "sle_minion" without error control 1s 602ms

And I refresh the metadata for "sle_minion" 867ms

And I refresh packages list via spacecmd on "sle_minion" 8s 705ms

And I wait until refresh package list on "sle_minion" is finished 12s 210ms

When I remove package "andromeda-dummy" from this "sle_minion" without error control 1s 891ms

And I refresh the metadata for "sle_minion" 849ms

And I refresh packages list via spacecmd on "sle_minion" 8s 601ms

And I wait until refresh package list on "sle_minion" is finished 10s 650ms

@skip_if_github_validation @sle_minion @scope_content_staging
Feature:Install a package on the SLES minion with staging enabled 7m 14s 841ms 8

When I enable repository "test_repo_rpm_pool" on this "sle_minion" 781ms

And I remove package "orion-dummy" from this "sle_minion" without error control 840ms

And I install package "virgo-dummy-1.0" on this "sle_minion" 1s 824ms

When I refresh packages list via spacecmd on "sle_minion" 7s 861ms

And I wait until refresh package list on "sle_minion" is finished 10s 720ms

Then spacecmd should show packages "virgo-dummy-1.0" installed on "sle_minion" 7s 800ms

Given I am authorized for the "Admin" section 468ms

When I follow the left menu "Admin > Task Schedules" 143ms

And I follow "errata-cache-default" 1s 245ms

And I follow "errata-cache-bunch" 1s 318ms

Then I click on "Single Run Schedule" 1s 275ms

And I should see a "bunch was scheduled" text 265ms

Then I wait until the table contains "FINISHED" or "SKIPPED" followed by "FINISHED" in its first rows 35s 417ms

When I follow the left menu "Admin > Organizations" 98ms

And I follow first "SUSE Test" 298ms

And I follow first "Configuration" 302ms

And I check "staging_content_enabled" 99ms

And I click on "Update Organization" 65ms

Then I should see a "was successfully updated." text 70ms

Given I am on the Systems overview page of this "sle_minion" 1s 188ms

When I follow "Software" in the content area 83ms

And I follow "Packages" in the content area 70ms

And I follow "Install" in the content area 71ms

And I enter "orion-dummy-1.1-1.1" as the filtered package name 137ms

And I click on the filter button 643ms

And I check row with "orion-dummy-1.1-1.1" and arch of "sle_minion" 67ms

And I click on "Install Packages" 627ms

And I pick 3 minutes from now as schedule time 99ms

And I click on "Confirm" 967ms

Then I should see a "1 package install has been scheduled for" text 80ms

And I wait until the package "orion-dummy-1.1-1.1" has been cached on this "sle_minion" 15s 440ms

And I wait for "orion-dummy-1.1-1.1" to be installed on "sle_minion" 2m 40s 687ms

When I follow "Software" in the content area 71ms

And I follow "Patches" in the content area 74ms

And I enter "virgo" as the filtered synopsis 55ms

And I click on the filter button 10s 86ms

And I check "virgo-dummy-3456" in the list 77ms

And I click on "Apply Patches" 641ms

And I pick 3 minutes from now as schedule time 105ms

And I click on "Confirm" 1s 43ms

Then I should see a "1 patch update has been scheduled for" text 76ms

And I wait until the package "virgo-dummy-2.0-1.1.noarch" has been cached on this "sle_minion" 1m 43s 120ms

And I wait for "virgo-dummy-2.0-1.1" to be installed on "sle_minion" 1m 4s 72ms

When I follow "Software" in the content area 97ms

And I follow "List / Remove" 718ms

And I enter "orion-dummy" as the filtered package name 177ms

And I click on the filter button 908ms

And I check row with "orion-dummy" and arch of "sle_minion" 67ms

And I enter "virgo-dummy" as the filtered package name 46ms

And I click on the filter button 132ms

And I check "virgo-dummy" in the list 67ms

And I click on "Remove Packages" 735ms

And I click on "Confirm" 876ms

And I disable repository "test_repo_rpm_pool" on this "sle_minion" 525ms

@skip_if_github_validation @scope_salt
Feature:Salt package states 2m 20s 193ms 15

Salt command: salt uyuni-master-suse-minion.sumaci.aws state.highstate

When I apply highstate on "sle_minion" 10s 818ms

And I enable repository "test_repo_rpm_pool" on this "sle_minion" 762ms

And I refresh the metadata for "sle_minion" 849ms

And I install old package "milkyway-dummy-1.0" on this "sle_minion" without error control 2s 49ms

And I install old package "virgo-dummy-1.0" on this "sle_minion" without error control 2s 538ms

And I install old package "andromeda-dummy-1.0" on this "sle_minion" without error control 1s 976ms

When I refresh packages list via spacecmd on "sle_minion" 6s 919ms

And I wait until refresh package list on "sle_minion" is finished 12s 297ms

Then spacecmd should show packages "milkyway-dummy-1.0 virgo-dummy-1.0 andromeda-dummy-1.0" installed on "sle_minion" 7s 610ms

Given I am authorized for the "Admin" section 1s 261ms

Given I am on the Systems overview page of this "sle_minion" 1s 467ms

When I follow "Software" in the content area 86ms

And I follow "List / Remove" in the content area 75ms

And I enter "andromeda-dummy" as the filtered package name 267ms

And I click on the filter button until page does contain "andromeda-dummy-1.0" text 279ms

When I follow the left menu "Admin > Task Schedules" 165ms

And I follow "errata-cache-default" 1s 229ms

And I follow "errata-cache-bunch" 1s 312ms

Then I click on "Single Run Schedule" 1s 516ms

And I should see a "bunch was scheduled" text 287ms

Then I wait until the table contains "FINISHED" or "SKIPPED" followed by "FINISHED" in its first rows 2s 167ms

Given I am on the Systems overview page of this "sle_minion" 996ms

When I follow "Software" in the content area 80ms

And I follow "Software Channels" in the content area 92ms

Then the system should have a base channel set 77ms

When I follow "States" in the content area 70ms

And I follow "Packages" 581ms

And I follow "Search" 70ms

And I should see a "Package States" text 67ms

And I list packages with "dummy" 1s 147ms

And I wait until I see "milkyway-dummy" text 175ms

Then "milkyway-dummy" should be installed on "sle_minion" 735ms

And I change the state of "milkyway-dummy" to "Removed" and "" 63ms

Then I should see a "1 Change" text 88ms

And I click save 52ms

Then I wait until I see "Package states have been saved." text 337ms

And I click apply 55ms

And I wait for "milkyway-dummy" to be uninstalled on "sle_minion" 6s 133ms

When I follow "States" in the content area 66ms

And I follow "Packages" 479ms

And I follow "Search" 57ms

And I should see a "Package States" text 72ms

And I list packages with "dummy" 1s 123ms

And I wait until I see "milkyway-dummy" text 192ms

Then "milkyway-dummy" should not be installed on "sle_minion" 474ms

And I change the state of "milkyway-dummy" to "Installed" and "" 47ms

Then I should see a "1 Change" text 90ms

And I click save 46ms

Then I wait until I see "Package states have been saved." text 214ms

And I click apply 41ms

And I wait for "milkyway-dummy" to be installed on "sle_minion" 11s 617ms

When I follow "States" in the content area 68ms

And I follow "Packages" 494ms

And I follow "Search" 63ms

And I should see a "Package States" text 72ms

And I list packages with "dummy" 1s 127ms

And I wait until I see "virgo-dummy" text 189ms

Then "virgo-dummy-1.0" should be installed on "sle_minion" 536ms

And I change the state of "virgo-dummy" to "Installed" and "Any" 99ms

Then I should see a "1 Change" text 103ms

And I click save 55ms

Then I wait until I see "Package states have been saved." text 225ms

And I click apply 48ms

And I wait for "virgo-dummy-1.0" to be installed on "sle_minion" 1s 128ms

When I follow "States" in the content area 69ms

And I follow "Packages" 556ms

And I follow "Search" 60ms

And I should see a "Package States" text 70ms

And I list packages with "dummy" 1s 141ms

And I wait until I see "andromeda-dummy" text 182ms

Then "andromeda-dummy-1.0" should be installed on "sle_minion" 492ms

And I change the state of "andromeda-dummy" to "Installed" and "Latest" 78ms

Then I should see a "1 Change" text 102ms

And I click save 47ms

Then I wait until I see "Package states have been saved." text 622ms

And I click apply 48ms

And I wait for "andromeda-dummy-2.0-1.1" to be installed on "sle_minion" 16s 486ms

When I follow "States" in the content area 85ms

And I follow "Packages" 496ms

And I should see a "Package States" text 67ms

And I should see a "milkyway-dummy" text 182ms

And I should see a "andromeda-dummy" text 75ms

And I should see a "virgo-dummy" text 86ms

When I follow "States" in the content area 63ms

And I follow "Highstate" in the content area 72ms

And I click on "Show full highstate output" 309ms

And I wait for "6" seconds 6s

And I should see a "pkg_removed" or "running as PID" text in element "highstate" 44ms

When I follow "States" in the content area 69ms

And I run "pkill salt-minion" on "sle_minion" without error control 424ms

And I run "pkill python.original" on "sle_minion" without error control 416ms

And I follow "Highstate" in the content area 69ms

And I click on "Show full highstate output" 288ms

And I wait until I see "No reply from minion" text 15s 189ms

When I restart salt-minion on "sle_minion" 979ms

Given I am on the Systems overview page of this "sle_minion" 1s 33ms

When I follow "States" in the content area 88ms

And I follow "Packages" 587ms

And I follow "Search" 78ms

And I should see a "Package States" text 66ms

And I list packages with "dummy" 1s 150ms

And I wait until I see "andromeda-dummy" text 182ms

And I change the state of "virgo-dummy" to "Unmanaged" and "" 82ms

And I change the state of "andromeda-dummy" to "Unmanaged" and "" 52ms

And I click save 56ms

Then I wait until I see "Package states have been saved." text 221ms

When I disable repository "test_repo_rpm_pool" on this "sle_minion" 555ms

And I remove package "milkyway-dummy" from this "sle_minion" without error control 1s 608ms

And I remove package "virgo-dummy" from this "sle_minion" without error control 1s 568ms

And I remove package "andromeda-dummy" from this "sle_minion" without error control 1s 578ms

And I refresh the metadata for "sle_minion" 893ms

Given I am authorized 2s 196ms

Given I remove "minion/extmods/states/mgrcompat.py" from salt cache on "sle_minion" 708ms

And I remove "minion/extmods/states/__pycache__/mgrcompat*" from salt cache on "sle_minion" 411ms

And I am on the Systems overview page of this "sle_minion" 970ms

When I follow "Hardware" 724ms

And I click on "Schedule Hardware Refresh" 797ms

Then I should see a "You have successfully scheduled a hardware profile refresh" text 121ms

When I wait until event "Hardware List Refresh scheduled" is completed 22s 169ms

And I wait until there is no Salt job calling the module "hardware.profileupdate" on "sle_minion" 2s 171ms

Given I remove "minion/extmods/states/mgrcompat.py" from salt cache on "sle_minion" 403ms

And I remove "minion/extmods/states/__pycache__/mgrcompat*" from salt cache on "sle_minion" 402ms

And I store "grains: {__suse_reserved_saltutil_states_support: False}" into file "custom_grains.conf" in salt minion config directory on "sle_minion" 404ms

And I refresh salt-minion grains on "sle_minion" 1s 829ms

And I am on the Systems overview page of this "sle_minion" 1s 5ms

When I follow "Hardware" 606ms

And I click on "Schedule Hardware Refresh" 793ms

Then I should see a "You have successfully scheduled a hardware profile refresh" text 126ms

When I wait until event "Hardware List Refresh scheduled" is completed 23s 282ms

And I wait until there is no Salt job calling the module "hardware.profileupdate" on "sle_minion" 2s 79ms

Given I am on the Systems overview page of this "sle_minion" 951ms

When I follow "Delete System" 480ms

Then I should see a "Confirm System Profile Deletion" text 62ms

When I click on "Delete Profile" 68ms

And I wait until I see "has been deleted" text 4m 3s 837ms

And I wait until Salt client is inactive on "sle_minion" 720ms

Then "sle_minion" should not be registered 1s 792ms

The hostname of sle_minion is uyuni-master-suse-minion.sumaci.aws

Given I store "use_superseded: [module.run]" into file "custom_modulerun.conf" in salt minion config directory on "sle_minion" 408ms

When I follow the left menu "Systems > Bootstrapping" 94ms

Then I should see a "Bootstrap Minions" text 65ms

When I enter the hostname of "sle_minion" as "hostname" 156ms

And I enter "22" as "port" 60ms

And I enter "root" as "user" 69ms

And I enter "linux" as "password" 71ms

And I select the hostname of "proxy" from "proxies" if present 83ms

And I click on "Bootstrap" 68ms

And I wait until I see "Bootstrap process initiated." text 23s 657ms

And I wait until onboarding is completed for "sle_minion" 1m 22s 541ms

When I follow the left menu "Systems > System List > All" 146ms

And I wait until I see the name of "sle_minion", refreshing the page 712ms

And I wait until onboarding is completed for "sle_minion" 8s 224ms

Given I am on the Systems overview page of this "sle_minion" 1s 9ms

When I follow "Software" in the content area 82ms

And I follow "List / Remove" 828ms

Then I should see a "aaa_base" text 126ms

Given I am on the Systems overview page of this "sle_minion" 1s 151ms

And I follow "Hardware" 568ms

And I click on "Schedule Hardware Refresh" 808ms

Then I should see a "You have successfully scheduled a hardware profile refresh" text 118ms

When I wait until event "Hardware List Refresh scheduled" is completed 22s 193ms

And I wait until there is no Salt job calling the module "hardware.profileupdate" on "sle_minion" 2s 100ms

Given I am on the Systems overview page of this "sle_minion" 954ms

And I remove "custom_modulerun.conf" from salt minion config directory on "sle_minion" 406ms

And I remove "custom_grains.conf" from salt minion config directory on "sle_minion" 414ms

When I follow "Delete System" 465ms

Then I should see a "Confirm System Profile Deletion" text 61ms

When I click on "Delete Profile" 66ms

And I wait until I see "has been deleted" text 4m 4s 30ms

And I wait until Salt client is inactive on "sle_minion" 724ms

Then "sle_minion" should not be registered 383ms

The hostname of sle_minion is uyuni-master-suse-minion.sumaci.aws

When I perform a full salt minion cleanup on "sle_minion" 6s 9ms

And I follow the left menu "Systems > Bootstrapping" 92ms

Then I should see a "Bootstrap Minions" text 65ms

When I enter the hostname of "sle_minion" as "hostname" 148ms

And I enter "22" as "port" 59ms

And I enter "root" as "user" 62ms

And I enter "linux" as "password" 64ms

And I select "1-SUSE-KEY-x86_64" from "activationKeys" 79ms

And I select the hostname of "proxy" from "proxies" if present 65ms

And I click on "Bootstrap" 70ms

And I wait until I see "Bootstrap process initiated." text 35s 861ms

And I wait until onboarding is completed for "sle_minion" 1m 22s 356ms

@skip_if_github_validation @sle_minion @scope_salt @flaky
Feature:Lock packages on SLES salt minion 3m 35s 617ms 10

* Related GitHub Card: https://github.com/SUSE/spacewalk/issues/20168

Given I am authorized 2s 189ms

When I install package "orion-dummy" on this "sle_minion" 2s 15ms

And I install package "milkyway-dummy" on this "sle_minion" 1s 664ms

And I remove package "hoag-dummy" from this "sle_minion" without error control 954ms

Given I am on the Systems overview page of this "sle_minion" 1s 121ms

When I follow "Software" in the content area 81ms

And I follow "Lock / Unlock" 733ms

And I enter "hoag-dummy-1.1-1.1" as the filtered package name 60ms

And I click on the filter button 953ms

And I check row with "hoag-dummy-1.1-1.1" and arch of "sle_minion" 72ms

And I click on "Lock" 1s 205ms

Then I should see a "Packages has been requested for being locked." text 79ms

When I wait until event "Lock packages scheduled" is completed 18s 911ms

Then "hoag-dummy-1.1-1.1" is locked on "sle_minion" 999ms

When I follow "Software" in the content area 85ms

And I follow "Lock / Unlock" 528ms

Then package "hoag-dummy-1.1-1.1" is reported as locked 32ms

Given I am on the Systems overview page of this "sle_minion" 995ms

When I follow "Software" in the content area 66ms

And I follow "Lock / Unlock" 585ms

And package "hoag-dummy-1.1-1.1" is reported as locked 25ms

And I follow "Install" 614ms

And I enter "hoag-dummy-1.1-1.1" as the filtered package name 73ms

And I click on the filter button 640ms

And I check row with "hoag-dummy-1.1-1.1" and arch of "sle_minion" 66ms

And I click on "Install Packages" 757ms

And I click on "Confirm" 668ms

Then I should see a "1 package install has been scheduled for" text 62ms

When I follow "Events" 418ms

And I follow "History" 426ms

And I wait until I see the event "Package Install/Upgrade scheduled" completed during last minute, refreshing the page 22s 959ms

And I follow the event "Package Install/Upgrade scheduled" completed during last minute 63ms

Then the package scheduled is "hoag-dummy-1.1-1.1" 19ms

And the action status is "Failed" 67ms

Given I am on the Systems overview page of this "sle_minion" 1s 91ms

When I follow "Software" in the content area 66ms

And I follow "Lock / Unlock" 527ms

And package "hoag-dummy-1.1-1.1" is reported as locked 24ms

And I enter "hoag-dummy-1.1-1.1" as the filtered package name 55ms

And I click on the filter button 619ms

And I check row with "hoag-dummy-1.1-1.1" and arch of "sle_minion" 19ms

And I click on "Unlock" 602ms

Then I should see a "Packages has been requested for being unlocked." text 76ms

When I wait until event "Lock packages scheduled" is completed 18s 705ms

Then "hoag-dummy-1.1-1.1" is unlocked on "sle_minion" 977ms

When I follow "Software" in the content area 72ms

And I follow "Lock / Unlock" 590ms

And I enter "hoag-dummy-1.1-1.1" as the filtered package name 74ms

And I click on the filter button 1s 647ms

Then package "hoag-dummy-1.1-1.1" is reported as unlocked 10s 22ms

Given I am on the Systems overview page of this "sle_minion" 973ms

When I follow "Software" in the content area 66ms

And I follow "Lock / Unlock" 2s 26ms

And I enter "hoag-dummy-1.1-1.1" as the filtered package name 56ms

And I click on the filter button 624ms

And I check row with "hoag-dummy-1.1-1.1" and arch of "sle_minion" 69ms

And I click on "Lock" 598ms

Then I should see a "Packages has been requested for being locked." text 79ms

And package "hoag-dummy-1.1-1.1" is reported as pending to be locked 12ms

Given I am on the Systems overview page of this "sle_minion" 1s 119ms

When I follow "Software" in the content area 63ms

And I follow "Lock / Unlock" 509ms

And I enter "milkyway-dummy-2.0-1.1" as the filtered package name 62ms

And I click on the filter button 613ms

When I check row with "milkyway-dummy-2.0-1.1" and arch of "sle_minion" 72ms

And I click on "Lock" 1s 177ms

Then I should see a "Packages has been requested for being locked." text 76ms

And package "milkyway-dummy-2.0-1.1" is reported as pending to be locked 12ms

When I wait until event "Lock packages scheduled" is completed 18s 993ms

Then "hoag-dummy-1.1-1.1" is locked on "sle_minion" 1s 30ms

And "milkyway-dummy-2.0-1.1" is locked on "sle_minion" 708ms

When I follow "Software" in the content area 72ms

And I follow "Lock / Unlock" 513ms

Then package "hoag-dummy-1.1-1.1" is reported as locked 30ms

And package "milkyway-dummy-2.0-1.1" is reported as locked 34ms

Given I am on the Systems overview page of this "sle_minion" 1s 216ms

When I follow "Software" in the content area 68ms

And I follow "Lock / Unlock" 609ms

And package "hoag-dummy-1.1-1.1" is reported as locked 27ms

And package "milkyway-dummy-2.0-1.1" is reported as locked 34ms

And I enter "orion-dummy-1.1-1.1" as the filtered package name 69ms

And I click on the filter button 630ms

When I check row with "orion-dummy-1.1-1.1" and arch of "sle_minion" 69ms

And I click on "Lock" 596ms

Then I should see a "Packages has been requested for being locked." text 76ms

And package "orion-dummy-1.1-1.1" is reported as pending to be locked 12ms

When I follow "Lock / Unlock" 525ms

And I enter "hoag-dummy-1.1-1.1" as the filtered package name 75ms

And I click on the filter button 606ms

And I uncheck row with "hoag-dummy-1.1-1.1" and arch of "sle_minion" 62ms

And I enter "milkyway-dummy-2.0-1.1" as the filtered package name 59ms

And I click on the filter button 135ms

And I check row with "milkyway-dummy-2.0-1.1" and arch of "sle_minion" 23ms

And I click on "Unlock" 1s 295ms

Then I should see a "Packages has been requested for being unlocked." text 80ms

And package "milkyway-dummy-2.0-1.1" is reported as pending to be unlocked 12ms

When I wait until event "Lock packages scheduled" is completed 18s 820ms

Then "hoag-dummy-1.1-1.1" is locked on "sle_minion" 1s 8ms

And "milkyway-dummy-2.0-1.1" is unlocked on "sle_minion" 689ms

And "orion-dummy-1.1-1.1" is locked on "sle_minion" 692ms

When I follow "Software" in the content area 76ms

And I follow "Lock / Unlock" 536ms

Then package "hoag-dummy-1.1-1.1" is reported as locked 29ms

And package "orion-dummy-1.1-1.1" is reported as locked 35ms

And I enter "milkyway-dummy-2.0-1.1" as the filtered package name 66ms

And I click on the filter button 635ms

And package "milkyway-dummy-2.0-1.1" is reported as unlocked 10s 15ms

Given I am on the Systems overview page of this "sle_minion" 1s 2ms

And I follow "Software" in the content area 81ms

And I follow "Lock / Unlock" 523ms

When I click on "Select All" 600ms

And I click on "Unlock" 851ms

Then I should see a "Packages has been requested for being unlocked." text 131ms

And only packages "hoag-dummy-1.1-1.1, orion-dummy-1.1-1.1" are reported as pending to be unlocked 38ms

When I wait until event "Lock packages scheduled" is completed 21s 984ms

Then "hoag-dummy-1.1-1.1" is unlocked on "sle_minion" 1s 2ms

And "orion-dummy-1.1-1.1" is unlocked on "sle_minion" 688ms

When I follow "Software" in the content area 70ms

And I follow "Lock / Unlock" 541ms

And I enter "hoag-dummy-1.1-1.1" as the filtered package name 66ms

And I click on the filter button 604ms

Then package "hoag-dummy-1.1-1.1" is reported as unlocked 10s 24ms

And I enter "orion-dummy-1.1-1.1" as the filtered package name 57ms

And I click on the filter button 129ms

And package "orion-dummy-1.1-1.1" is reported as unlocked 10s 25ms

Then I remove package "orion-dummy" from this "sle_minion" 1s 802ms

And I remove package "milkyway-dummy" from this "sle_minion" 1s 527ms

Given I am authorized 1s 897ms

When I call system.create_system_profile() with name "empty-profile" and HW address "00:11:22:33:44:55" 1s 874ms

When I call system.create_system_profile() with name "empty-profile-hostname" and hostname "min-retail.mgr.suse.de" 748ms

And I follow the left menu "System > System List > Unprovisioned Systems" 223ms

And I wait until I see "empty-profile" text, refreshing the page 92ms

And I wait until I see "00:11:22:33:44:55" text 79ms

And I wait until I see "empty-profile-hostname" text 77ms

And I follow the left menu "System > System List > Unprovisioned Systems" 74ms

And I follow "empty-profile-hostname" 683ms

Then I wait until I see "min-retail.mgr.suse.de" text, refreshing the page 71ms

When I call system.list_empty_system_profiles() 427ms

Then "empty-profile" should be present in the result < 1ms

And "empty-profile-hostname" should be present in the result < 1ms

When I follow the left menu "Systems > System List" 74ms

And I wait until I see the "empty-profile" system, refreshing the page 17s 348ms

And I follow "empty-profile" 571ms

And I follow "Delete System" 415ms

Then I should see a "Confirm System Profile Deletion" text 61ms

When I click on "Delete Profile" 63ms

And I wait until I see "has been deleted" text 821ms

When I follow the left menu "Systems > System List" 66ms

And I wait until I see the "empty-profile-hostname" system, refreshing the page 727ms

And I follow "empty-profile-hostname" 548ms

And I follow "Delete System" 395ms

Then I should see a "Confirm System Profile Deletion" text 66ms

When I click on "Delete Profile" 61ms

And I wait until I see "has been deleted" text 2s 24ms

Given I am authorized 1s 962ms

Given I am on the Systems overview page of this "sle_minion" 0s

When I follow "Software" in the content area 0s

And I follow "Software Channels" in the content area 0s

And I wait until I do not see "Loading..." text 0s

And I check radio button "SLE-Product-SLES15-SP7-Pool for x86_64" 0s

And I wait until I see "SLE-Module-Basesystem15-SP7-Pool for x86_64" text 0s

And I uncheck "SLE-Module-Basesystem15-SP7-Pool for x86_64" 0s

And I click on "Next" 0s

Then I should see a "Confirm Software Channel Change" text 0s

When I click on "Confirm" 0s

Then I should see a "Changing the channels has been scheduled." text 0s

When I follow "scheduled" in the content area 0s

And I wait until I see "1 system successfully completed this action." text, refreshing the page 0s

Warning: Radio button 'openSUSE Tumbleweed (x86_64)' is already checked

Given I am on the Systems overview page of this "sle_minion" 1s 677ms

When I follow "Software" in the content area 75ms

And I follow "Software Channels" in the content area 75ms

And I wait until I do not see "Loading..." text 63ms

And I check radio button "openSUSE Tumbleweed (x86_64)" 199ms

And I click on "Next" 361ms

Then I should see a "Confirm Software Channel Change" text 66ms

When I click on "Confirm" 79ms

Then I should see a "Changing the channels has been scheduled." text 427ms

When I follow "scheduled" in the content area 84ms

And I wait until I see "1 system successfully completed this action." text, refreshing the page 29s 931ms

Real protocol: https host: uyuni-master-proxy.sumaci.aws port: 443
Expected protocol: https host: uyuni-master-proxy.sumaci.aws port: 443

Given I am on the Systems overview page of this "sle_minion" 1s 67ms

Then the susemanager repo file should exist on the "sle_minion" 712ms

And the repo file should contain the normal download endpoint on the "sle_minion" 411ms

Given I am on the Systems overview page of this "sle_minion" 1s 137ms

When I install a salt pillar top file for "pkg_endpoint" with target "*" on the server 4s 127ms

And I wait for "1" seconds 1s

And I install the package download endpoint pillar file on the server 2s 586ms

And I refresh the pillar data 3s 990ms

When I follow "Software" in the content area 0s

And I follow "Software Channels" in the content area 0s

And I wait until I do not see "Loading..." text 0s

And I wait until I see "SLE-Module-Basesystem15-SP7-Pool for x86_64" text 0s

And I click on "Next" 0s

Then I should see a "Confirm Software Channel Change" text 0s

When I click on "Confirm" 0s

Then I should see a "Changing the channels has been scheduled." text 0s

When I follow "scheduled" in the content area 0s

And I wait until I see "1 system successfully completed this action." text, refreshing the page 0s

Warning: Radio button 'openSUSE Tumbleweed (x86_64)' is already checked

When I follow "Software" in the content area 89ms

And I follow "Software Channels" in the content area 71ms

And I wait until I do not see "Loading..." text 70ms

And I check radio button "openSUSE Tumbleweed (x86_64)" 334ms

And I click on "Next" 523ms

Then I should see a "Confirm Software Channel Change" text 69ms

When I click on "Confirm" 85ms

Then I should see a "Changing the channels has been scheduled." text 436ms

When I follow "scheduled" in the content area 77ms

And I wait until I see "1 system successfully completed this action." text, refreshing the page 29s 875ms

Real protocol: ftp host: mirror.sumaci.aws port: 445
Expected protocol: ftp host: mirror.sumaci.aws port: 445

Given I am on the Systems overview page of this "sle_minion" 1s 721ms

Then the susemanager repo file should exist on the "sle_minion" 723ms

And the repo file should contain the custom download endpoint on the "sle_minion" 412ms

When I delete the package download endpoint pillar file from the server 3s 27ms

And I install a salt pillar top file for "disable_local_repos_off, salt_bundle_config" with target "*" on the server 3s 625ms

And I refresh the pillar data 5s 355ms

When I follow "Software" in the content area 0s

And I follow "Software Channels" in the content area 0s

And I wait until I do not see "Loading..." text 0s

And I check radio button "SLE-Product-SLES15-SP7-Pool for x86_64" 0s

And I wait until I see "SLE15-SP7-Installer-Updates for x86_64" text 0s

And I include the recommended child channels 0s

And I check "SLE-Module-DevTools15-SP7-Pool for x86_64" 0s

And I check "Fake-RPM-SUSE-Channel" 0s

And I check "SLE-Module-Containers15-SP7-Pool for x86_64" 0s

And I click on "Next" 0s

Then I should see a "Confirm Software Channel Change" text 0s

When I click on "Confirm" 0s

Then I should see a "Changing the channels has been scheduled." text 0s

When I follow "scheduled" in the content area 0s

And I wait until I see "1 system successfully completed this action." text, refreshing the page 0s

Warning: Radio button 'openSUSE Tumbleweed (x86_64)' is already checked

When I follow "Software" in the content area 80ms

And I follow "Software Channels" in the content area 68ms

And I wait until I do not see "Loading..." text 68ms

And I check radio button "openSUSE Tumbleweed (x86_64)" 197ms

And I check "Uyuni Client Tools for openSUSE Tumbleweed (x86_64) (Development)" 319ms

And I check "Fake-RPM-SUSE-Channel" 41ms

And I click on "Next" 66ms

Then I should see a "Confirm Software Channel Change" text 62ms

When I click on "Confirm" 83ms

Then I should see a "Changing the channels has been scheduled." text 314ms

When I follow "scheduled" in the content area 93ms

And I wait until I see "1 system successfully completed this action." text, refreshing the page 16s 544ms

Real protocol: https host: uyuni-master-proxy.sumaci.aws port: 443
Expected protocol: https host: uyuni-master-proxy.sumaci.aws port: 443

Then the susemanager repo file should exist on the "sle_minion" 712ms

And the repo file should contain the normal download endpoint on the "sle_minion" 409ms

@skip_if_github_validation @sle_minion @scope_action_chains @flaky
Feature:Action chains on Salt minions 9m 37s 63ms 33

* Related GitHub Card: https://github.com/SUSE/spacewalk/issues/28793

Given I am authorized for the "Admin" section 2s 64ms

When I enable repository "test_repo_rpm_pool" on this "sle_minion" 782ms

And I remove package "andromeda-dummy" from this "sle_minion" without error control 834ms

And I remove package "virgo-dummy" from this "sle_minion" without error control 814ms

And I install package "milkyway-dummy" on this "sle_minion" without error control 1s 666ms

And I install old package "andromeda-dummy-1.0" on this "sle_minion" 1s 774ms

And I refresh the metadata for "sle_minion" 1s 380ms

When I refresh packages list via spacecmd on "sle_minion" 8s 998ms

And I wait until refresh package list on "sle_minion" is finished 12s 401ms

Then spacecmd should show packages "milkyway-dummy andromeda-dummy-1.0" installed on "sle_minion" 6s 245ms

Given I am on the Systems overview page of this "sle_minion" 926ms

When I follow "Software" in the content area 98ms

And I follow "List / Remove" in the content area 72ms

And I enter "andromeda-dummy" as the filtered package name 178ms

And I click on the filter button until page does contain "andromeda-dummy-1.0" text 277ms

When I follow the left menu "Admin > Task Schedules" 150ms

And I follow "errata-cache-default" 1s 222ms

And I follow "errata-cache-bunch" 1s 347ms

And I click on "Single Run Schedule" 1s 566ms

Then I should see a "bunch was scheduled" text 272ms

And I wait until the table contains "FINISHED" or "SKIPPED" followed by "FINISHED" in its first rows 38s 415ms

When I create an action chain with label "salt_minion_action_chain" via API 438ms

And I follow the left menu "Schedule > Action Chains" 164ms

Then I should see a "salt_minion_action_chain" text 82ms

Given I am on the Systems overview page of this "sle_minion" 1s 97ms

When I follow "Software" in the content area 81ms

And I follow "Patches" in the content area 71ms

And I enter "andromeda" as the filtered synopsis 63ms

And I click on the filter button 10s 177ms

And I check "andromeda-dummy-6789" in the list 64ms

And I click on "Apply Patches" 712ms

And I check radio button "schedule-by-action-chain" 10s 56ms

And I click on "Confirm" 684ms

Then I should see a "Action has been successfully added to the Action Chain" text 88ms

Given I am on the Systems overview page of this "sle_minion" 1s 23ms

When I follow "Software" in the content area 86ms

And I follow "List / Remove" in the content area 72ms

And I enter "milkyway-dummy" as the filtered package name 210ms

And I click on the filter button 829ms

And I check row with "milkyway-dummy" and arch of "sle_minion" 64ms

And I click on "Remove Packages" 603ms

And I check radio button "schedule-by-action-chain" 10s 56ms

And I click on "Confirm" 605ms

Then I should see a "Action has been successfully added to the Action Chain" text 63ms

When I follow "Software" in the content area 78ms

And I follow "Install New Packages" in the content area 73ms

And I enter "virgo-dummy" as the filtered package name 96ms

And I click on the filter button 605ms

And I check "virgo-dummy" in the list 55ms

And I click on "Install Packages" 619ms

And I check radio button "schedule-by-action-chain" 10s 64ms

And I click on "Confirm" 679ms

Then I should see a "Action has been successfully added to the Action Chain" text 62ms

When I follow the left menu "Configuration > Channels" 124ms

And I follow "Create Config Channel" 271ms

And I enter "Action Chain Channel" as "cofName" 73ms

And I enter "actionchainchannel" as "cofLabel" 70ms

And I enter "This is a test channel" as "cofDescription" 71ms

And I click on "Create Config Channel" 486ms

Then I should see a "Action Chain Channel" text 66ms

When I follow the left menu "Configuration > Channels" 77ms

And I follow "Action Chain Channel" 433ms

And I follow "Create Configuration File or Directory" 425ms

And I enter "/etc/action-chain.cnf" as "cffPath" 75ms

And I enter "Testchain=YES_PLEASE" in the editor 4ms

And I click on "Create Configuration File" 613ms

Then I should see a "Revision 1 of /etc/action-chain.cnf from channel Action Chain Channel" text 98ms

And I should see a "Update Configuration File" button 19ms

When I follow the left menu "Configuration > Channels" 63ms

And I follow "Action Chain Channel" 359ms

And I follow "List/Remove Files" 407ms

And I follow "/etc/action-chain.cnf" 411ms

And I follow "Download File" 188ms

And I wait until file "/tmp/downloads/action-chain.cnf" exists on "localhost" 166ms

Then file "/tmp/downloads/action-chain.cnf" should contain "Testchain=YES_PLEASE" on "localhost" 337ms

Given I am on the Systems overview page of this "sle_minion" 956ms

When I follow "Configuration" in the content area 79ms

And I follow "Manage Configuration Channels" in the content area 69ms

And I follow first "Subscribe to Channels" in the content area 77ms

And I check "Action Chain Channel" in the list 57ms

And I click on "Continue" 507ms

And I click on "Update Channel Rankings" 815ms

Then I should see a "Channel Subscriptions successfully changed for" text 74ms

When I follow the left menu "Configuration > Channels" 112ms

And I follow "Action Chain Channel" 443ms

And I follow "Deploy Files" in the content area 71ms

And I click on "Deploy All Files" 697ms

And I check the "sle_minion" client 62ms

And I click on "Confirm & Deploy to Selected Systems" 768ms

And I check radio button "schedule-by-action-chain" 10s 77ms

And I click on "Deploy Files to Selected Systems" 697ms

Then I should see a "Action has been successfully added to the Action Chain" text 69ms

Given I am on the Systems overview page of this "sle_minion" 1s 130ms

When I follow "States" in the content area 72ms

And I check radio button "schedule-by-action-chain" 10s 85ms

And I click on "Apply Highstate" 82ms

Given I am on the Systems overview page of this "sle_minion" 925ms

When I follow first "Schedule System Reboot" 485ms

And I check radio button "schedule-by-action-chain" 10s 62ms

And I click on "Reboot system" 766ms

Then I should see a "Action has been successfully added to the Action Chain" text 89ms

When I follow "Details" in the content area 78ms

And I follow "Remote Command" in the content area 70ms

And I enter as remote command this script in #!/bin/bash touch /tmp/action_chain_one_system_done 67ms

And I check radio button "schedule-by-action-chain" 10s 73ms

And I click on "Schedule" 531ms

Then I should see a "Action has been successfully added to the Action Chain" text 84ms

When I follow "Schedule" 343ms

And I follow "Action Chains" 283ms

And I follow "salt_minion_action_chain" 573ms

Then I should see a "1. Apply patch(es) andromeda-dummy-6789 on 1 system" text 99ms

And I should see a "2. Remove milkyway-dummy from 1 system" text 86ms

And I should see a "3. Install or update virgo-dummy on 1 system" text 83ms

And I should see a text like "4. Deploy.*/etc/action-chain.cnf.*to 1 system" 82ms

And I should see a "5. Apply Highstate" text 80ms

And I should see a "6. Reboot 1 system" text 81ms

And I should see a "7. Run a remote command on 1 system" text 77ms

Given I am authorized as "testing" with password "testing" 2s 110ms

When I follow "Schedule" 1s 196ms

And I follow "Action Chains" 324ms

Then I should not see a "salt_minion_action_chain" link 8ms

Given I am authorized for the "Admin" section 2s 2ms

When I am on the Systems overview page of this "sle_minion" 1s 482ms

And I follow "Schedule" 266ms

And I follow "Action Chains" 256ms

And I follow "salt_minion_action_chain" 357ms

And I click on "Save and Schedule" 60ms

Then I should see a "Action Chain salt_minion_action_chain has been scheduled for execution." text 769ms

When I wait for "virgo-dummy" to be installed on "sle_minion" 24s 375ms

And I wait at most 300 seconds until file "/tmp/action_chain_one_system_done" exists on "sle_minion" 4m 1s 617ms

When I create an action chain with label "salt_minion_action_chain_to_delete" via API 371ms

And I follow the left menu "Schedule > Action Chains" 77ms

Then I should see a "salt_minion_action_chain_to_delete" text 73ms

Given I am on the Systems overview page of this "sle_minion" 936ms

When I follow "Remote Command" 415ms

And I enter as remote command this script in #!/bin/bash uptime 55ms

And I check radio button "schedule-by-action-chain" 10s 66ms

And I click on "Schedule" 517ms

Then I should see a "Action has been successfully added to the Action Chain" text 86ms

When I follow "Schedule" 262ms

And I follow "Action Chains" 305ms

And I follow "salt_minion_action_chain_to_delete" 250ms

And I follow "Delete Action Chains" in the content area 82ms

And I click on "Delete" 413ms

When I remove package "andromeda-dummy" from this "sle_minion" without error control 2s 604ms

And I remove package "virgo-dummy" from this "sle_minion" without error control 1s 587ms

And I install package "milkyway-dummy" on this "sle_minion" without error control 1s 781ms

And I install old package "andromeda-dummy-1.0" on this "sle_minion" 1s 921ms

When I refresh packages list via spacecmd on "sle_minion" 8s 59ms

And I wait until refresh package list on "sle_minion" is finished 12s 46ms

Then spacecmd should show packages "milkyway-dummy andromeda-dummy-1.0" installed on "sle_minion" 6s 163ms

When I follow the left menu "Admin > Task Schedules" 132ms

And I follow "errata-cache-default" 1s 369ms

And I follow "errata-cache-bunch" 1s 241ms

And I click on "Single Run Schedule" 1s 283ms

Then I should see a "bunch was scheduled" text 275ms

And I wait until the table contains "FINISHED" or "SKIPPED" followed by "FINISHED" in its first rows 35s 323ms

Running actions:
- System reboot
- Package Install/Upgrade
- Run an arbitrary script
- Package Removal
- Removed "System reboot" action
- Removed "Package Install/Upgrade" action
- Removed "Run an arbitrary script" action
- Removed "Package Removal" action

Given I want to operate on this "sle_minion" 463ms

When I create an action chain with label "salt_minion_api_chain" via API 477ms

And I add a package install to the action chain via API 850ms

And I add a package removal to the action chain via API 790ms

And I add a package upgrade to the action chain via API 813ms

And I add the script "exit 1;" to the action chain via API 362ms

And I add a system reboot to the action chain via API 359ms

Then I should be able to see all these actions in the action chain via API 349ms

When I remove each action within the chain via API 2s 53ms

Then the current action chain should be empty 338ms

And I delete the action chain via API 331ms

Running actions:
- Run an arbitrary script

Given I want to operate on this "sle_minion" 346ms

When I create an action chain with label "salt_minion_multiple_scripts" via API 345ms

And I add the script "echo -n 1 >> /tmp/action_chain.log" to the action chain via API 352ms

And I add the script "echo -n 2 >> /tmp/action_chain.log" to the action chain via API 361ms

And I add the script "echo -n 3 >> /tmp/action_chain.log" to the action chain via API 352ms

And I add the script "touch /tmp/action_chain_done" to the action chain via API 364ms

Then I should be able to see all these actions in the action chain via API 337ms

When I schedule the action chain via API 430ms

And I wait until there are no more action chains listed via API 358ms

And I wait until file "/tmp/action_chain_done" exists on "sle_minion" 5s 314ms

Then file "/tmp/action_chain.log" should contain "123" on "sle_minion" 840ms

When I wait until there are no more scheduled actions listed via API 360ms

When I follow the left menu "Configuration > Channels" 161ms

And I follow "Action Chain Channel" 472ms

And I follow "Systems" in the content area 90ms

And I check the "sle_minion" client 81ms

And I click on "Unsubscribe systems" 585ms

Then I should see a "Successfully unsubscribed 1 system(s)." text 64ms

When I follow the left menu "Configuration > Channels" 67ms

And I follow "Action Chain Channel" 429ms

And I follow "Delete Channel" 312ms

And I click on "Delete Config Channel" 66ms

When I remove package "andromeda-dummy" from this "sle_minion" without error control 1s 520ms

And I remove package "virgo-dummy" from this "sle_minion" without error control 904ms

And I remove package "milkyway-dummy" from this "sle_minion" without error control 2s 326ms

And I disable repository "test_repo_rpm_pool" on this "sle_minion" without error control 547ms

When I run "rm -f /tmp/action_chain.log" on "sle_minion" without error control 447ms

And I run "rm -f /tmp/action_chain_done" on "sle_minion" without error control 405ms

And I run "rm -f /etc/action-chain.cnf" on "sle_minion" without error control 399ms

And I run "rm -f /tmp/action_chain_one_system_done" on "sle_minion" without error control 404ms

When I run "rm -f /tmp/downloads/action-chain.cnf" on "localhost" without error control 170ms

@skip_if_github_validation @ssh_minion @scope_action_chains @scope_salt_ssh
Feature:Salt SSH action chain 11m 52s 291ms 29 1

Given I am authorized for the "Admin" section 430ms

When I enable repository "test_repo_rpm_pool" on this "ssh_minion" 719ms

And I remove package "andromeda-dummy" from this "ssh_minion" without error control 1s 240ms

And I remove package "virgo-dummy" from this "ssh_minion" without error control 1s 241ms

And I install package "milkyway-dummy" on this "ssh_minion" without error control 1s 180ms

And I install old package "andromeda-dummy-1.0" on this "ssh_minion" 1s 298ms

And I refresh the metadata for "ssh_minion" 808ms

When I refresh packages list via spacecmd on "ssh_minion" 6s 578ms

And I wait until refresh package list on "ssh_minion" is finished 27s 252ms

Then spacecmd should show packages "milkyway-dummy andromeda-dummy-1.0" installed on "ssh_minion" 6s 327ms

Given I am on the Systems overview page of this "ssh_minion" 948ms

When I follow "Software" in the content area 92ms

And I follow "List / Remove" in the content area 68ms

And I enter "andromeda-dummy" as the filtered package name 246ms

And I click on the filter button until page does contain "andromeda-dummy-1.0" text 278ms

When I follow the left menu "Admin > Task Schedules" 151ms

And I follow "errata-cache-default" 392ms

And I follow "errata-cache-bunch" 1s 278ms

And I click on "Single Run Schedule" 1s 545ms

Then I should see a "bunch was scheduled" text 272ms

And I wait until the table contains "FINISHED" or "SKIPPED" followed by "FINISHED" in its first rows 28s 515ms

When I create an action chain with label "minssh_action_chain" via API 351ms

And I follow the left menu "Schedule > Action Chains" 162ms

Then I wait until I see "minssh_action_chain" text 80ms

Given I am on the Systems overview page of this "ssh_minion" 933ms

When I follow "Software" in the content area 79ms

And I follow "Patches" in the content area 72ms

And I enter "andromeda" as the filtered synopsis 68ms

And I click on the filter button 10s 175ms

And I check "andromeda-dummy-6789" in the list 64ms

And I click on "Apply Patches" 740ms

And I check radio button "schedule-by-action-chain" 10s 62ms

And I click on "Confirm" 687ms

Then I should see a "Action has been successfully added to the Action Chain" text 75ms

When I follow "Software" in the content area 90ms

And I follow "List / Remove" in the content area 70ms

And I enter "milkyway-dummy" as the filtered package name 211ms

And I click on the filter button 837ms

And I check row with "milkyway-dummy" and arch of "ssh_minion" 64ms

And I click on "Remove Packages" 756ms

And I check radio button "schedule-by-action-chain" 10s 64ms

And I click on "Confirm" 615ms

Then I should see a "Action has been successfully added to the Action Chain" text 61ms

When I follow "Software" in the content area 70ms

And I follow "Install New Packages" in the content area 67ms

And I enter "virgo-dummy" as the filtered package name 48ms

And I click on the filter button 510ms

And I check "virgo-dummy" in the list 56ms

And I click on "Install Packages" 623ms

And I check radio button "schedule-by-action-chain" 10s 65ms

And I click on "Confirm" 588ms

Then I should see a "Action has been successfully added to the Action Chain" text 64ms

When I follow the left menu "Configuration > Channels" 128ms

And I follow "Create Config Channel" 271ms

And I enter "Action Chain Channel" as "cofName" 72ms

And I enter "actionchainchannel" as "cofLabel" 69ms

And I enter "This is a test channel" as "cofDescription" 70ms

And I click on "Create Config Channel" 600ms

Then I should see a "Action Chain Channel" text 63ms

When I follow the left menu "Configuration > Channels" 70ms

And I follow "Action Chain Channel" 361ms

And I follow "Create Configuration File or Directory" 326ms

And I enter "/etc/action-chain.cnf" as "cffPath" 72ms

And I enter "Testchain=YES_PLEASE" in the editor 6ms

And I click on "Create Configuration File" 68ms

Then I should see a "Revision 1 of /etc/action-chain.cnf from channel Action Chain Channel" text 219ms

And I should see a "Update Configuration File" button 18ms

Given I am on the Systems overview page of this "ssh_minion" 952ms

When I follow "Configuration" in the content area 70ms

And I follow "Manage Configuration Channels" in the content area 91ms

And I follow first "Subscribe to Channels" in the content area 68ms

And I check "Action Chain Channel" in the list 59ms

And I click on "Continue" 59ms

And I click on "Update Channel Rankings" 682ms

Then I should see a "Channel Subscriptions successfully changed for" text 76ms

When I follow the left menu "Configuration > Channels" 117ms

And I follow "Action Chain Channel" 435ms

And I follow "Deploy Files" in the content area 71ms

And I click on "Deploy All Files" 655ms

And I check the "ssh_minion" client 62ms

And I click on "Confirm & Deploy to Selected Systems" 883ms

And I check radio button "schedule-by-action-chain" 10s 71ms

And I click on "Deploy Files to Selected Systems" 772ms

Then I should see a "Action has been successfully added to the Action Chain" text 76ms

Given I am on the Systems overview page of this "ssh_minion" 1s 446ms

When I follow "States" in the content area 82ms

And I check radio button "schedule-by-action-chain" 10s 82ms

And I click on "Apply Highstate" 62ms

Given I am on the Systems overview page of this "ssh_minion" 1s 33ms

When I follow first "Schedule System Reboot" 392ms

And I check radio button "schedule-by-action-chain" 10s 57ms

And I click on "Reboot system" 783ms

Then I should see a "Action has been successfully added to the Action Chain" text 90ms

When I follow "Details" in the content area 78ms

When I follow "Remote Command" in the content area 69ms

And I enter as remote command this script in #!/bin/bash touch /tmp/action_chain_one_system_done 72ms

And I check radio button "schedule-by-action-chain" 10s 67ms

And I click on "Schedule" 498ms

Then I should see a "Action has been successfully added to the Action Chain" text 78ms

When I follow the left menu "Schedule > Action Chains" 137ms

And I follow "minssh_action_chain" 306ms

Then I should see a "1. Apply patch(es) andromeda-dummy-6789 on 1 system" text 83ms

And I should see a "2. Remove milkyway-dummy from 1 system" text 101ms

And I should see a "3. Install or update virgo-dummy on 1 system" text 81ms

And I should see a text like "4. Deploy.*/etc/action-chain.cnf.*to 1 system" 83ms

And I should see a "5. Apply Highstate" text 83ms

And I should see a "6. Reboot 1 system" text 82ms

And I should see a "7. Run a remote command on 1 system" text 81ms

Given I am authorized as "testing" with password "testing" 1s 877ms

When I follow the left menu "Schedule > Action Chains" 115ms

Then I should not see a "minssh_action_chain" link 9ms

Given I am authorized for the "Admin" section 2s 323ms

When I follow the left menu "Schedule > Action Chains" 117ms

And I wait until I see "minssh_action_chain" text 66ms

And I follow "minssh_action_chain" 301ms

Then I click on "Save and Schedule" 60ms

And I should see a "Action Chain minssh_action_chain has been scheduled for execution." text 783ms

When I wait for "virgo-dummy" to be installed on "ssh_minion" 1m 14s 595ms

And I wait at most 300 seconds until file "/tmp/action_chain_one_system_done" exists on "ssh_minion" 5m Show Error +
                                            
execution expired (Timeout::Error) ./features/support/commonlib.rb:89:in `repeat_until_timeout' ./features/step_definitions/command_steps.rb:790:in `/^I wait at most (\d+) seconds until file "([^"]*)" exists on "([^"]*)"$/' features/secondary/minssh_action_chain.feature:177:in `I wait at most 300 seconds until file "/tmp/action_chain_one_system_done" exists on "ssh_minion"'

20s 629ms Show Info +
15:32:00:000 - 15:38:15:000 | Current URL: https://uyuni-master-server.sumaci.aws/rhn/schedule/ActionChains.do
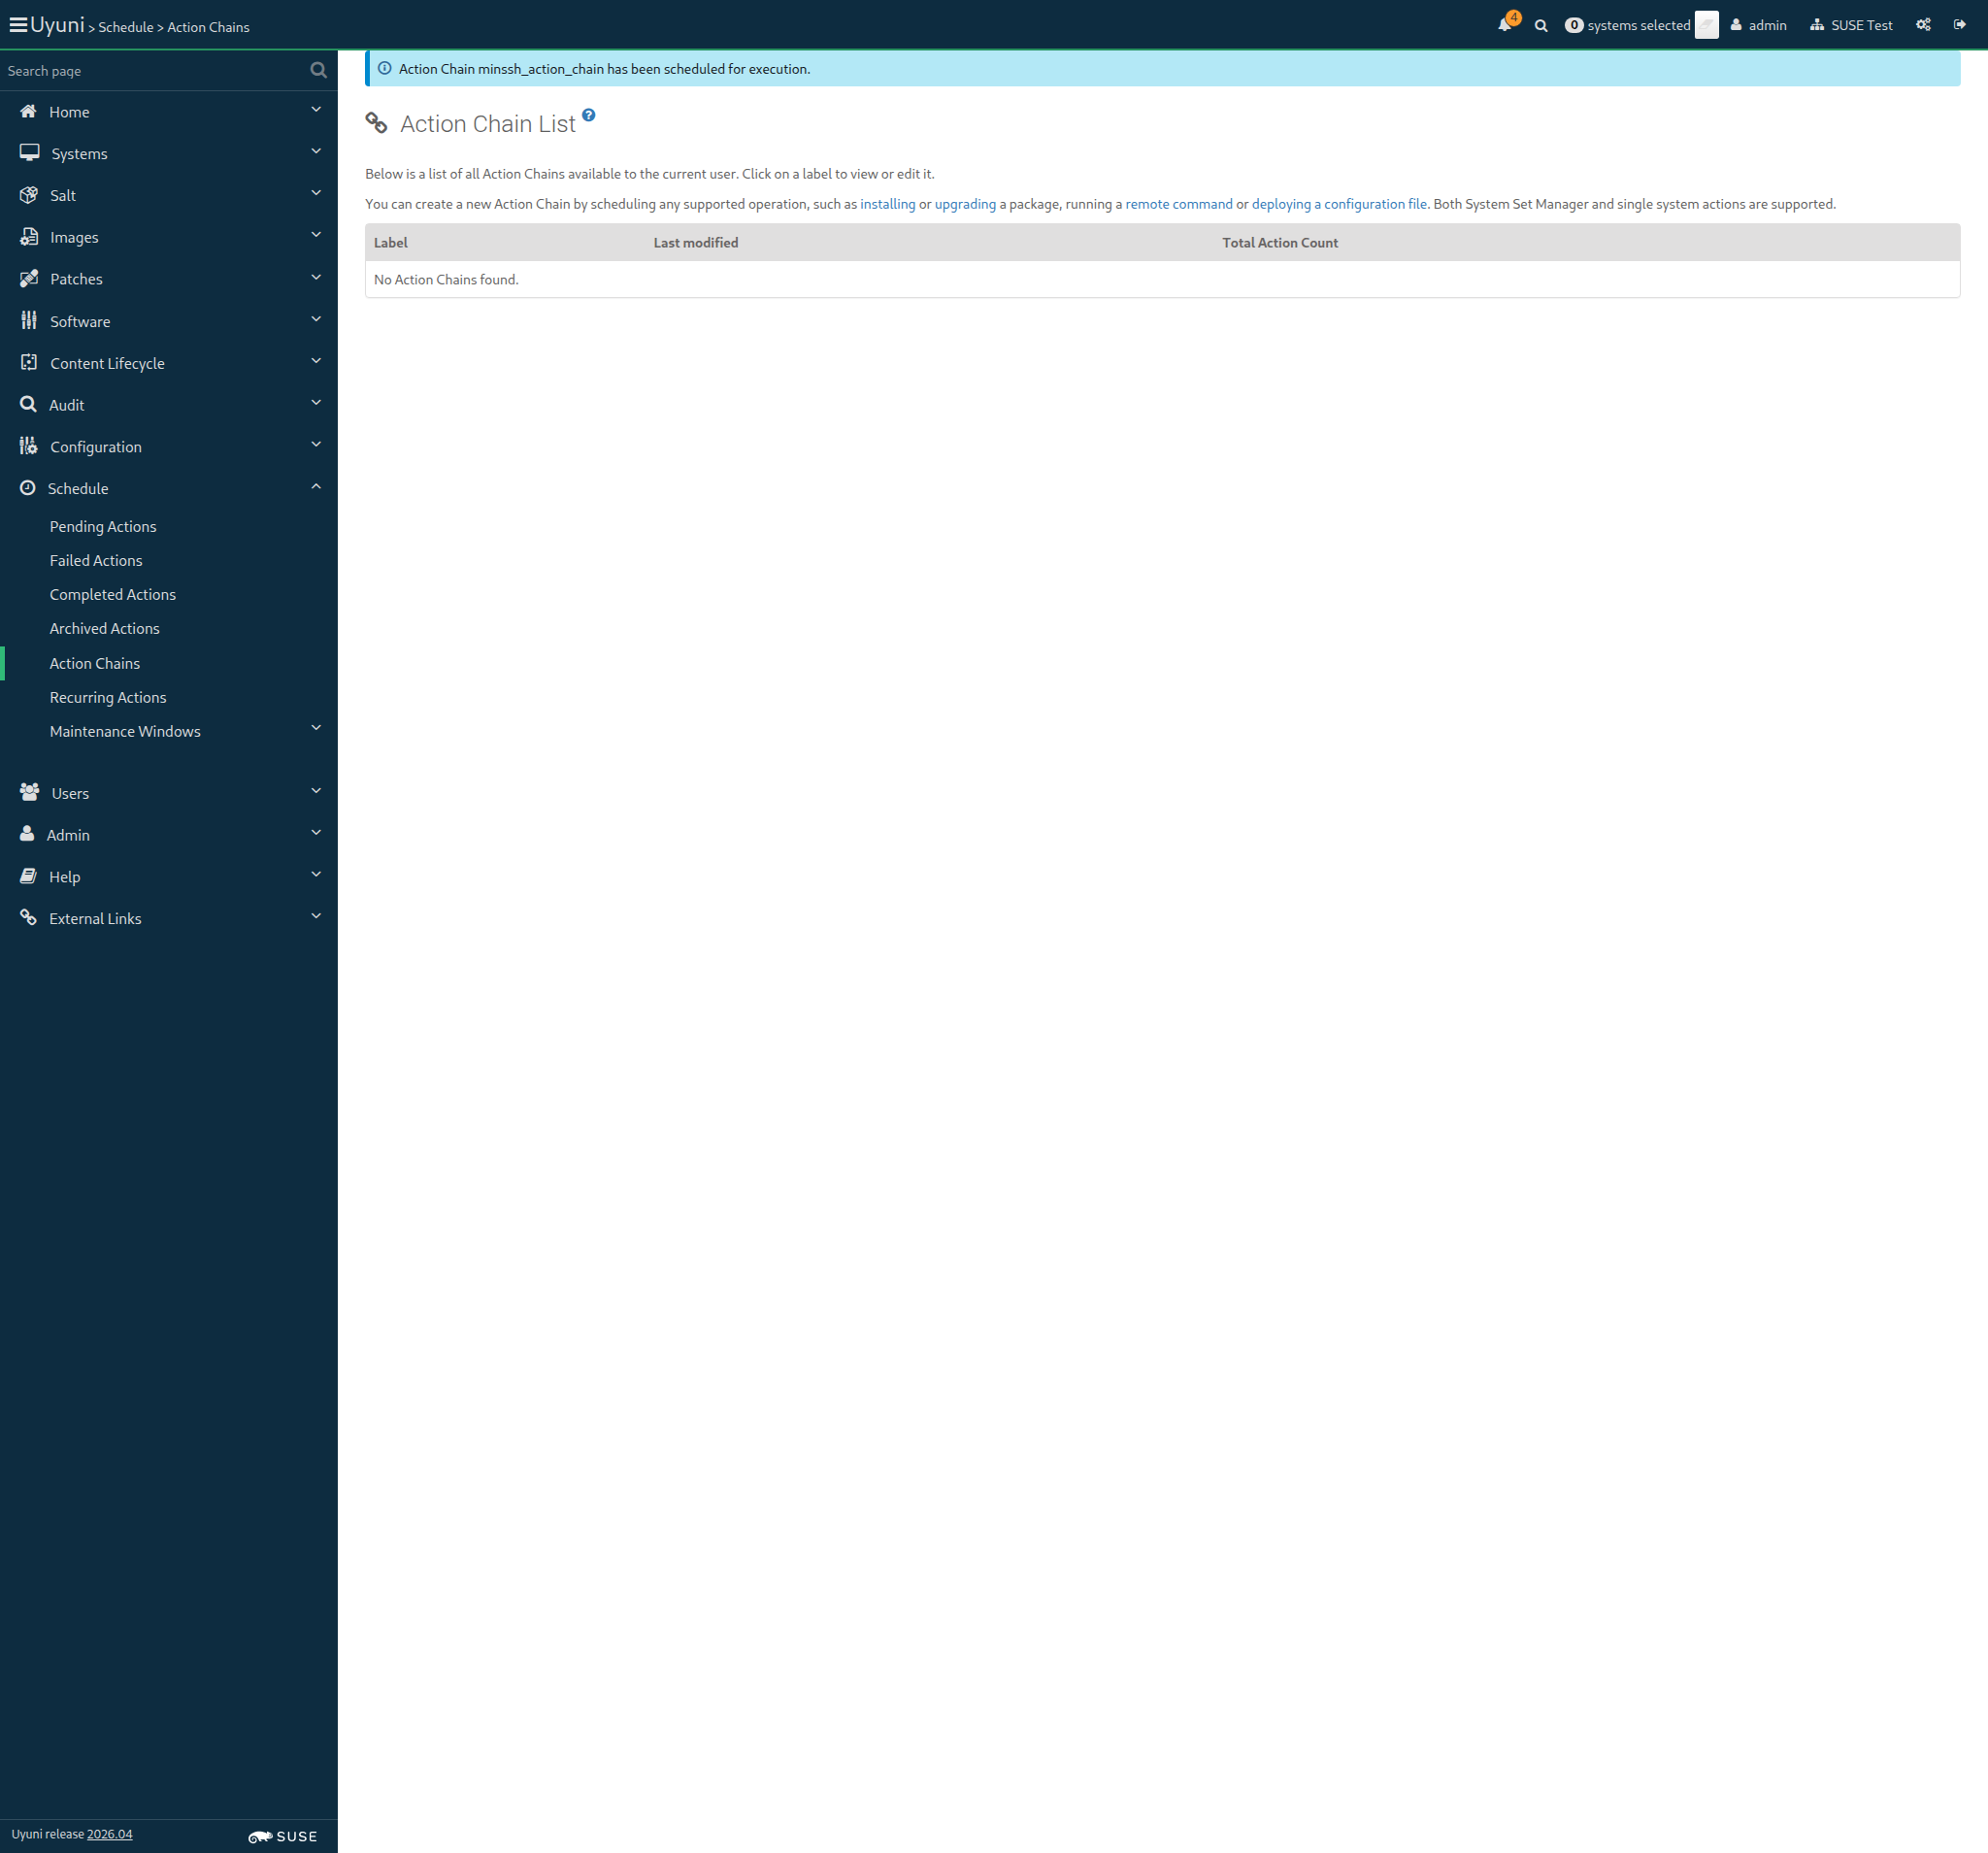
Screenshot +


When I create an action chain with label "minssh_action_chain_to_delete" via API 522ms

And I follow the left menu "Schedule > Action Chains" 79ms

Then I should see a "minssh_action_chain_to_delete" text 63ms

Given I am on the Systems overview page of this "ssh_minion" 1s 289ms

When I follow "Remote Command" 415ms

And I enter as remote command this script in #!/bin/bash uptime 56ms

And I check radio button "schedule-by-action-chain" 10s 87ms

And I click on "Schedule" 62ms

Then I should see a "Action has been successfully added to the Action Chain" text 83ms

When I follow the left menu "Schedule > Action Chains" 136ms

And I follow "minssh_action_chain_to_delete" 317ms

And I follow "Delete Action Chains" in the content area 90ms

Then I click on "Delete" 511ms

Given I am on the Systems overview page of this "ssh_minion" 1s 138ms

When I run "rm /tmp/action_chain_done" on "ssh_minion" without error control 684ms

And I enable repository "test_repo_rpm_pool" on this "ssh_minion" 563ms

And I remove package "andromeda-dummy" from this "ssh_minion" without error control 1s 771ms

And I remove package "virgo-dummy" from this "ssh_minion" without error control 1s 246ms

And I install package "milkyway-dummy" on this "ssh_minion" without error control 1s 448ms

And I install old package "andromeda-dummy-1.0" on this "ssh_minion" 1s 294ms

And I follow "Software" in the content area 78ms

And I click on "Update Package List" 597ms

And I follow "Events" in the content area 74ms

And I wait until I do not see "Package List Refresh scheduled" text, refreshing the page 24s 214ms

And I follow "Software" in the content area 86ms

And I follow "List / Remove" in the content area 71ms

And I enter "andromeda-dummy" as the filtered package name 265ms

And I click on the filter button until page does contain "andromeda-dummy-1.0" text 278ms

When I follow the left menu "Admin > Task Schedules" 167ms

And I follow "errata-cache-default" 1s 228ms

And I follow "errata-cache-bunch" 1s 216ms

And I click on "Single Run Schedule" 1s 268ms

Then I should see a "bunch was scheduled" text 283ms

And I wait until the table contains "FINISHED" or "SKIPPED" followed by "FINISHED" in its first rows 32s 94ms

Running actions:
- Package Install/Upgrade
- Package Removal
- Run an arbitrary script
- Removed "Package Install/Upgrade" action
- Removed "Package Removal" action
- Removed "Run an arbitrary script" action

Given I want to operate on this "ssh_minion" 420ms

When I create an action chain with label "minssh_api_chain" via API 395ms

And I add a package install to the action chain via API 864ms

And I add a package removal to the action chain via API 784ms

And I add a package upgrade to the action chain via API 994ms

And I add the script "exit 1;" to the action chain via API 491ms

Then I should be able to see all these actions in the action chain via API 420ms

When I remove each action within the chain via API 1s 779ms

Then the current action chain should be empty 326ms

And I delete the action chain via API 336ms

Running actions:
- Run an arbitrary script

And I want to operate on this "ssh_minion" 327ms

When I create an action chain with label "minssh_multiple_scripts" via API 360ms

And I add the script "echo -n 1 >> /tmp/action_chain.log" to the action chain via API 458ms

And I add the script "echo -n 2 >> /tmp/action_chain.log" to the action chain via API 385ms

And I add the script "echo -n 3 >> /tmp/action_chain.log" to the action chain via API 357ms

And I add the script "touch /tmp/action_chain_done" to the action chain via API 375ms

Then I should be able to see all these actions in the action chain via API 355ms

When I schedule the action chain via API 460ms

Then I wait until there are no more action chains listed via API 359ms

When I wait until file "/tmp/action_chain_done" exists on "ssh_minion" 25s 469ms

Then file "/tmp/action_chain.log" should contain "123" on "ssh_minion" 787ms

When I wait until there are no more scheduled actions listed via API 331ms

When I follow the left menu "Configuration > Channels" 166ms

And I follow "Action Chain Channel" 439ms

And I follow "Systems" in the content area 89ms

And I check the "ssh_minion" client 67ms

And I click on "Unsubscribe systems" 581ms

Then I should see a "Successfully unsubscribed 1 system(s)." text 63ms

When I follow the left menu "Configuration > Channels" 66ms

And I follow "Action Chain Channel" 438ms

And I follow "Delete Channel" 316ms

And I click on "Delete Config Channel" 442ms

When I remove package "andromeda-dummy" from this "ssh_minion" without error control 1s 246ms

And I remove package "virgo-dummy" from this "ssh_minion" without error control 783ms

And I remove package "milkyway-dummy" from this "ssh_minion" without error control 1s 230ms

And I disable repository "test_repo_rpm_pool" on this "ssh_minion" without error control 428ms

When I run "rm -f /tmp/action_chain.log" on "ssh_minion" without error control 389ms

And I run "rm -f /tmp/action_chain_done" on "ssh_minion" without error control 390ms

And I run "rm -f /etc/action-chain.cnf" on "ssh_minion" without error control 390ms

And I run "rm -f /tmp/action_chain_one_system_done" on "ssh_minion" without error control 387ms

@skip_if_github_validation @ssh_minion @sle_minion @scope_action_chains
Feature:Action chains on several systems at once 2m 40s 744ms 12

Given I am authorized for the "Admin" section 481ms

When I enable repository "test_repo_rpm_pool" on this "sle_minion" 740ms

And I enable repository "test_repo_rpm_pool" on this "ssh_minion" 722ms

And I remove package "andromeda-dummy" from this "ssh_minion" without error control 788ms

And I remove package "andromeda-dummy" from this "sle_minion" without error control 857ms

And I install package "andromeda-dummy-1.0" on this "sle_minion" 2s 91ms

And I install package "andromeda-dummy-1.0" on this "ssh_minion" 1s 317ms

And I refresh the metadata for "sle_minion" 838ms

And I refresh the metadata for "ssh_minion" 826ms

When I refresh packages list via spacecmd on "sle_minion" 6s 793ms

And I wait until refresh package list on "sle_minion" is finished 12s 128ms

Then spacecmd should show packages "andromeda-dummy-1.0" installed on "sle_minion" 7s 598ms

When I refresh packages list via spacecmd on "ssh_minion" 6s 377ms

And I wait until refresh package list on "ssh_minion" is finished 26s 414ms

Then spacecmd should show packages "andromeda-dummy-1.0" installed on "ssh_minion" 6s 161ms

Given I am on the Systems overview page of this "sle_minion" 1s 157ms

When I follow "Software" in the content area 76ms

And I follow "List / Remove" in the content area 69ms

And I enter "andromeda-dummy" as the filtered package name 208ms

And I click on the filter button until page does contain "andromeda-dummy-1.0" text 275ms

When I follow the left menu "Admin > Task Schedules" 160ms

And I follow "errata-cache-default" 1s 216ms

And I follow "errata-cache-bunch" 1s 303ms

And I click on "Single Run Schedule" 1s 539ms

Then I should see a "bunch was scheduled" text 270ms

And I wait until the table contains "FINISHED" or "SKIPPED" followed by "FINISHED" in its first rows 2s 164ms

Given I am on the Systems overview page of this "ssh_minion" 1s 4ms

When I follow the left menu "Admin > Task Schedules" 118ms

And I follow "errata-cache-default" 1s 330ms

And I follow "errata-cache-bunch" 1s 314ms

And I click on "Single Run Schedule" 1s 225ms

Then I should see a "bunch was scheduled" text 261ms

And I wait until the table contains "FINISHED" or "SKIPPED" followed by "FINISHED" in its first rows 2s 481ms

When I create an action chain with label "two_systems_action_chain" via API 362ms

And I follow the left menu "Schedule > Action Chains" 146ms

Then I should see a "two_systems_action_chain" text 62ms

When I follow the left menu "Systems > System List > All" 188ms

And I check the "sle_minion" client 489ms

And I check the "ssh_minion" client 65ms

And I follow the left menu "Systems > System Set Manager > Overview" 455ms

And I follow "Install" in the content area 75ms

And I follow "Fake-RPM-SUSE-Channel" in the content area 68ms

And I enter "andromeda-dummy" as the filtered package name 60ms

And I click on the filter button 409ms

And I check "andromeda-dummy" in the list 59ms

And I click on "Install Packages" 512ms

Then I should see "sle_minion" hostname 73ms

And I should see "ssh_minion" hostname 73ms

When I check radio button "schedule-by-action-chain" 10s 81ms

And I click on "Confirm" 403ms

Then I should see a "Package installations are being scheduled" text 61ms

When I follow the left menu "Systems > System Set Manager > Overview" 71ms

And I follow "remote commands" in the content area 97ms

And I enter as remote command this script in #!/bin/bash touch /tmp/action_chain_done 67ms

And I check radio button "schedule-by-action-chain" 10s 78ms

And I click on "Schedule" 62ms

Then I should see "sle_minion" hostname 98ms

And I should see "ssh_minion" hostname 88ms

Given I am on the Systems overview page of this "sle_minion" 1s 17ms

When I follow "Schedule" 277ms

And I follow "Action Chains" 313ms

And I follow "two_systems_action_chain" 305ms

And I should see a "1. Install or update andromeda-dummy on 2 systems" text 68ms

And I should see a "2. Run a remote command on 2 systems" text 73ms

And I click on "Save and Schedule" 60ms

Then I should see a "Action Chain two_systems_action_chain has been scheduled for execution." text 587ms

When I wait until file "/tmp/action_chain_done" exists on "ssh_minion" 36s 873ms

And I wait until file "/tmp/action_chain_done" exists on "sle_minion" 705ms

Then "andromeda-dummy" should be installed on "ssh_minion" 490ms

And "andromeda-dummy" should be installed on "sle_minion" 421ms

When I remove package "andromeda-dummy" from this "sle_minion" without error control 1s 544ms

And I remove package "andromeda-dummy" from this "ssh_minion" without error control 1s 482ms

And I disable repository "test_repo_rpm_pool" on this "sle_minion" without error control 461ms

And I disable repository "test_repo_rpm_pool" on this "ssh_minion" without error control 560ms

When I run "rm /tmp/action_chain_done" on "sle_minion" without error control 494ms

And I run "rm /tmp/action_chain_done" on "ssh_minion" without error control 391ms

@skip_if_cloud @scope_building_container_images @no_auth_registry
Feature:API "image" namespace for containers and sub-namespaces < 1ms 3

When I create and delete an image store via API 0s

And I list image store types and image stores via API 0s

And I set and get details of image store via API 0s

When I create and delete profiles via API 0s

And I create and delete profile custom values via API 0s

And I list image profiles via API 0s

And I set and get profile details via API 0s

Given I am authorized 0s

When I follow the left menu "Systems > Custom System Info" 0s

And I follow "arancio" 0s

And I follow "Delete Key" 0s

And I click on "Delete Key" 0s

Given I am authorized for the "Admin" section 516ms

When I follow the left menu "Configuration > Channels" 135ms

And I follow "Create State Channel" 292ms

And I wait until I see "New Config State Channel" text 63ms

And I enter "My State Channel for Recurring Actions" as "cofName" 100ms

And I enter "statechannel-recurring" as "cofLabel" 76ms

And I enter "This is a state channel to be used in recurring actions" as "cofDescription" 99ms

And I enter "enable_ip_forwarding:\n cmd.run:\n - name: echo 1 > /proc/sys/net/ipv4/conf/all/forwarding" in the editor 5ms

And I click on "Create Config State Channel" 767ms

Then I wait until I see "Channel Properties" text 72ms

And I wait until I see "My State Channel for Recurring Actions" text 66ms

Execution time: 15:45

When I am on the "Recurring Actions" page of this "sle_minion" 1s 159ms

Then I should see a "No schedules created. Use Create to add a schedule" text 111ms

When I click on "Create" 102ms

And I wait until I see "Action Type" text 92ms

And I enter "IP forwarding custom state recurring action" as "scheduleName" 302ms

And I select "Custom state" from "actionTypeDescription" 1s 147ms

And I wait until I see "Configure states to execute" text 104ms

And I check radio button "schedule-daily" 10s 93ms

And I enter 1 minutes from now as "time-daily_time" 112ms

And I check "statechannel-recurring-cbox" 97ms

And I click on "Save Changes" 72ms

And I wait until I see "Edit State Ranks" text 98ms

And I click on "Confirm" 91ms

And I click on "Create Schedule" 67ms

Then I wait until I see "Schedule successfully created" text 966ms

And I should see a "IP forwarding custom state recurring action" text 642ms

And I should see a "Minion" text 70ms

When I follow "Events" 476ms

And I follow "History" 403ms

Then I wait at most 420 seconds until event "Apply recurring states [manager_org_1.statechannel-recurring] schedule" is completed 1m 207ms

And file "/proc/sys/net/ipv4/conf/all/forwarding" should contain "1" on "sle_minion" 1s 129ms

Execution time: 15:46

When I am on the "Recurring Actions" page of this "sle_minion" 1s 38ms

Then I should see a "IP forwarding custom state recurring action" text 274ms

When I click the "IP forwarding custom state recurring action" item edit button 70ms

And I wait until I see "Update Schedule" text 402ms

And I enter "custom_state_schedule_name_changed" as "scheduleName" 540ms

And I enter 1 minutes from now as "time-daily_time" 103ms

And I uncheck "statechannel-recurring-cbox" 10s 87ms

And I check "Sync States-cbox" 86ms

And I click on "Save Changes" 70ms

And I wait until I see "Edit State Ranks" text 94ms

And I click on "Confirm" 84ms

And I click on "Update Schedule" 72ms

Then I wait until I see "Schedule successfully updated" text 1s 357ms

And I should see a "custom_state_schedule_name_changed" text 266ms

And I should see a "Minion" text 67ms

When I follow "Events" 481ms

And I follow "History" 481ms

Then I wait at most 420 seconds until event "Apply recurring states [util.syncstates] scheduled" is completed 32s 808ms

And I wait until I see "SLS: util.syncstates" text 66ms

When I follow the left menu "Salt > Remote Commands" 135ms

Then I should see a "Remote Commands" text in the content area 23ms

When I enter command "echo 0 > /proc/sys/net/ipv4/conf/all/forwarding" 140ms

And I enter target "sle_minion" 113ms

And I click on preview 11s 552ms

And I click on run 51ms

Then I should see "sle_minion" hostname 56ms

And I wait until I see "show response" text 1s 569ms

And file "/proc/sys/net/ipv4/conf/all/forwarding" should contain "0" on "sle_minion" 1s 117ms

When I am on the "Recurring Actions" page of this "sle_minion" 1s 48ms

Then I should see a "custom_state_schedule_name_changed" text 360ms

When I click the "custom_state_schedule_name_changed" item delete button 79ms

And I wait until I see "Delete Recurring Action Schedule" text 72ms

And I click on the red confirmation button 70ms

Then I wait until I see "Schedule 'custom_state_schedule_name_changed' has been deleted." text 302ms

Execution time: 15:47

When I am on the "Recurring Actions" page of this "sle_minion" 1s 128ms

Then I should see a "No schedules created. Use Create to add a schedule" text 71ms

When I click on "Create" 105ms

And I wait until I see "Schedule Name" text 92ms

And I enter "Minion Highstate Recurring Action" as "scheduleName" 256ms

And I select "Highstate" from "actionTypeDescription" 1s 136ms

And I check radio button "schedule-daily" 10s 83ms

And I enter 1 minutes from now as "time-daily_time" 105ms

And I click on the "disabled" toggler 66ms

And I click on "Create Schedule" 85ms

Then I wait until I see "Schedule successfully created" text 216ms

And I should see a "Minion Highstate Recurring Action" text 160ms

And I should see a "Minion" text 70ms

When I follow "Events" 339ms

And I follow "History" 424ms

And I wait until I see the event "Apply highstate in test-mode scheduled" completed during last minute, refreshing the page 34s 476ms

When I am on the "Recurring Actions" page of this "sle_minion" 1s 724ms

Then I should see a "Minion Highstate Recurring Action" text 275ms

When I click the "Minion Highstate Recurring Action" item edit button 71ms

And I wait until I see "Update Schedule" text 317ms

And I enter "schedule_name_minion" as "scheduleName" 378ms

And I check radio button "schedule-weekly" 10s 81ms

And I select "Wednesday" from "date_weekly" 1s 146ms

And I enter "01:35" as "time-weekly_time" 106ms

And I click on "Update Schedule" 72ms

Then I wait until I see "Schedule successfully updated" text 1s 313ms

And I should see a "schedule_name_minion" text 174ms

And I should see a "Minion" text 65ms

And I should see a "0 35 1 ? * 4" text 66ms

When I am on the "Recurring Actions" page of this "sle_minion" 1s 57ms

Then I should see a "schedule_name_minion" text 278ms

When I click the "schedule_name_minion" item details button 69ms

Then I should see a "Every Wednesday at 01:35" text 278ms

When I click on "Back" 71ms

Then I should see a "Schedules" text 64ms

When I follow the left menu "Systems > System Groups" 108ms

And I follow "Create Group" 279ms

And I enter "Recurring-Action-test-group" as "name" 79ms

And I enter "This is for testing" as "description" 67ms

And I click on "Create Group" 460ms

Then I should see a "System group Recurring-Action-test-group created." text 66ms

When I am on the "Groups" page of this "sle_minion" 1s 66ms

And I follow first "Join" 362ms

And I check the first row in the list 80ms

And I click on "Join Groups" 1s 126ms

Then I wait until I see "1 system groups added" text 70ms

Given I am on the Systems overview page of this "sle_minion" 986ms

When I follow "Software" in the content area 72ms

And I follow "Software Channels" in the content area 72ms

And I wait until I do not see "Loading..." text 67ms

And I check radio button "Fake-Base-Channel-SUSE-like" 10s 63ms

And I wait until I do not see "Loading..." text 427ms

And I check "Fake-Child-Channel-SUSE-like" 81ms

And I click on "Next" 62ms

Then I should see a "Confirm Software Channel Change" text 61ms

When I click on "Confirm" 105ms

Then I should see a "Changing the channels has been scheduled." text 290ms

And I wait until event "Subscribe channels scheduled" is completed 19s 523ms

When I enable repository "test_repo_rpm_pool" on this "sle_minion" 759ms

And I install old package "milkyway-dummy-1.0" on this "sle_minion" 2s 177ms

And I refresh the metadata for "sle_minion" 739ms

And I follow the left menu "Admin > Task Schedules" 128ms

And I follow "errata-cache-default" 1s 291ms

And I follow "errata-cache-bunch" 1s 314ms

And I click on "Single Run Schedule" 707ms

Then I should see a "bunch was scheduled" text 268ms

And I wait until the table contains "FINISHED" or "SKIPPED" followed by "FINISHED" in its first rows 1m 37s 960ms

Given I am on the Systems overview page of this "sle_minion" 933ms

And I wait until I see "Software Updates Available" text, refreshing the page 91ms

Execution time: 15:51

When I follow the left menu "Systems > System Groups" 92ms

And I follow "Recurring-Action-test-group" 312ms

And I follow "Recurring Actions" in the content area 105ms

Then I should see a "No schedules created. Use Create to add a schedule" text 66ms

When I click on "Create" 110ms

And I wait until I see "Schedule Name" text 92ms

And I enter "Recurring action to keep Recurring-Action-test-group uptodate" as "scheduleName" 418ms

And I select "Custom state" from "actionTypeDescription" 1s 138ms

And I wait until I see "Configure states to execute" text 101ms

And I check radio button "schedule-daily" 10s 86ms

And I enter 1 minutes from now as "time-daily_time" 108ms

And I check "Update System-cbox" 92ms

And I click on "Save Changes" 75ms

And I wait until I see "Edit State Ranks" text 97ms

And I click on "Confirm" 84ms

And I click on "Create Schedule" 73ms

Then I wait until I see "Schedule successfully created" text 266ms

And I should see a "Recurring action to keep Recurring-Action-test-group uptodate" text 177ms

And I should see a "Group" text 68ms

When I am on the "Events" page of this "sle_minion" 1s 5ms

And I follow "History" 411ms

Then I wait until I see the event "Apply recurring states [uptodate] scheduled" completed during last minute, refreshing the page 1m 9s 13ms

When I am on the Systems overview page of this "sle_minion" 919ms

Then I wait at most 500 seconds until I do not see "System is up to date" text, refreshing the page 91ms

Given I am on the Systems overview page of this "sle_minion" 0s

When I follow "Software" in the content area 0s

And I disable repository "test_repo_rpm_pool" on this "sle_minion" without error control 0s

And I follow "Software Channels" in the content area 0s

And I wait until I do not see "Loading..." text 0s

And I check default base channel radio button of this "sle_minion" 0s

And I wait for child channels to appear 0s

And I include the recommended child channels 0s

And I wait until "SLE-Module-Basesystem15-SP7-Pool for x86_64" has been checked 0s

And I wait until "SLE-Module-Basesystem15-SP7-Updates for x86_64" has been checked 0s

And I wait until "SLE-Module-Server-Applications15-SP7-Pool for x86_64" has been checked 0s

And I wait until "SLE-Module-Server-Applications15-SP7-Updates for x86_64" has been checked 0s

And I check "SLE-Module-DevTools15-SP7-Pool for x86_64" 0s

And I wait until "SLE-Module-DevTools15-SP7-Updates for x86_64" has been checked 0s

And I wait until "SLE-Module-Desktop-Applications15-SP7-Pool for x86_64" has been checked 0s

And I wait until "SLE-Module-Desktop-Applications15-SP7-Updates for x86_64" has been checked 0s

And I check "SLE-Module-Containers15-SP7-Pool for x86_64" 0s

And I wait until "SLE-Module-Containers15-SP7-Updates for x86_64" has been checked 0s

And I check "Fake-RPM-SUSE-Channel" 0s

And I click on "Next" 0s

Then I should see a "Confirm Software Channel Change" text 0s

When I click on "Confirm" 0s

Then I should see a "Changing the channels has been scheduled." text 0s

And I wait until event "Subscribe channels scheduled" is completed 0s

Given I am on the Systems overview page of this "sle_minion" 894ms

When I follow "Software" in the content area 73ms

And I disable repository "test_repo_rpm_pool" on this "sle_minion" without error control 744ms

And I follow "Software Channels" in the content area 68ms

And I wait until I do not see "Loading..." text 69ms

And I check default base channel radio button of this "sle_minion" 435ms

And I wait for child channels to appear 626ms

And I check "Uyuni Client Tools for openSUSE Tumbleweed (x86_64) (Development)" 81ms

And I check "Fake-RPM-SUSE-Channel" 83ms

And I click on "Next" 67ms

Then I should see a "Confirm Software Channel Change" text 71ms

When I click on "Confirm" 74ms

Then I should see a "Changing the channels has been scheduled." text 331ms

And I wait until event "Subscribe channels scheduled" is completed 20s 58ms

When I follow the left menu "Systems > System Groups" 83ms

And I follow "Recurring-Action-test-group" 264ms

And I follow "Recurring Actions" in the content area 76ms

Then I should see a "Recurring action to keep Recurring-Action-test-group uptodate" text 307ms

When I click the "Recurring action to keep Recurring-Action-test-group uptodate" item edit button 77ms

And I wait until I see "Update Schedule" text 350ms

And I enter "schedule_name_group" as "scheduleName" 668ms

And I check radio button "schedule-hourly" 10s 92ms

And I enter "35" as "minutes" 89ms

And I click on "Update Schedule" 75ms

Then I wait until I see "Schedule successfully updated" text 467ms

And I should see a "schedule_name_group" text 190ms

And I should see a "Group" text 74ms

And I should see a "0 35 * ? * *" text 71ms

When I follow the left menu "Systems > System Groups" 83ms

And I follow "Recurring-Action-test-group" 324ms

And I follow "Recurring Actions" in the content area 81ms

Then I should see a "schedule_name" text 280ms

When I click the "schedule_name" item details button 79ms

Then I should see a "Every hour at minute 35" text 180ms

And I should see a "Recurring-Action-test-group" link 14ms

And I should see a "Update System" text 79ms

When I click on "Back" 75ms

Then I should see a "Schedules" text 61ms

Execution time: 15:53

When I follow the left menu "Home > My Organization > Recurring Actions" 218ms

Then I should see a "No schedules created. Use Create to add a schedule" text 62ms

When I click on "Create" 115ms

And I wait until I see "Schedule Name" text 87ms

And I enter "schedule_name" as "scheduleName" 123ms

And I select "Custom state" from "actionTypeDescription" 1s 144ms

And I wait until I see "Configure states to execute" text 100ms

And I check radio button "schedule-daily" 10s 98ms

And I enter 1 minutes from now as "time-daily_time" 118ms

And I click on the "disabled" toggler 66ms

And I check "Package Profile Update-cbox" 101ms

And I click on "Save Changes" 75ms

And I wait until I see "Edit State Ranks" text 93ms

And I click on "Confirm" 88ms

And I click on "Create Schedule" 73ms

Then I wait until I see "Schedule successfully created" text 265ms

And I should see a "schedule_name" text 167ms

And I should see a "Organization" text 65ms

When I am on the "Events" page of this "sle_minion" 1s 45ms

And I follow "History" 430ms

Then I wait until I see the event "Apply recurring states [packages.profileupdate] scheduled" completed during last minute, refreshing the page 57s 559ms

When I follow the left menu "Home > My Organization > Recurring Actions" 235ms

Then I should see a "schedule_name" text 273ms

When I click the "schedule_name" item edit button 73ms

And I wait until I see "Update Schedule" text 322ms

And I enter "schedule_name_edit" as "scheduleName" 327ms

And I check radio button "schedule-monthly" 10s 94ms

And I select "7" from "date_monthly" 1s 152ms

And I enter "05:17" as "time-monthly_time" 118ms

And I click on "Update Schedule" 76ms

Then I wait until I see "Schedule successfully updated" text 793ms

And I should see a "schedule_name_edit" text 168ms

And I should see a "Organization" text 67ms

And I should see a "0 17 5 7 * ?" text 69ms

When I follow the left menu "Home > My Organization > Recurring Actions" 95ms

Then I should see a "schedule_name" text 267ms

When I click the "schedule_name" item details button 65ms

Then I should see a "Every 7th of the month at 05:17" text 267ms

And I should see a "Package Profile Update" text 66ms

When I click on "Back" 71ms

Then I should see a "Schedules" text 58ms

When I follow the left menu "Home > My Organization > Recurring Actions" 81ms

Then I should see a "schedule_name_edit" text 255ms

When I click the "schedule_name" item delete button 79ms

And I wait until I see "Delete Recurring Action Schedule" text 67ms

And I click on the red confirmation button 71ms

Then I wait until I see "Schedule 'schedule_name_edit' has been deleted." text 823ms

And I should see a "No schedules created. Use Create to add a schedule" text 57ms

Execution time: 15:54

When I follow the left menu "Admin > Organizations" 125ms

And I follow "SUSE Test" in the content area 77ms

And I follow "Recurring Actions" in the content area 68ms

Then I should see a "No schedules created. Use Create to add a schedule" text 64ms

When I click on "Create" 92ms

And I wait until I see "Schedule Name" text 90ms

And I select "Custom state" from "actionTypeDescription" 1s 128ms

And I wait until I see "Configure states to execute" text 102ms

And I enter "schedule_name" as "scheduleName" 142ms

And I check radio button "schedule-daily" 10s 95ms

And I enter 1 minutes from now as "time-daily_time" 107ms

And I click on the "disabled" toggler 61ms

And I check "Hardware Profile Update-cbox" 92ms

And I click on "Save Changes" 71ms

And I wait until I see "Edit State Ranks" text 97ms

And I click on "Confirm" 84ms

And I click on "Create Schedule" 69ms

Then I wait until I see "Schedule successfully created" text 298ms

And I should see a "schedule_name" text 70ms

And I should see a "Organization" text 69ms

When I am on the "Events" page of this "sle_minion" 1s 16ms

And I follow "History" 399ms

Then I wait until I see the event "Apply recurring states [hardware.profileupdate] scheduled" completed during last minute, refreshing the page 22s 958ms

When I follow the left menu "Admin > Organizations" 153ms

And I follow "SUSE Test" in the content area 70ms

And I follow "Recurring Actions" in the content area 67ms

Then I should see a "schedule_name" text 284ms

When I click the "schedule_name" item edit button 67ms

And I wait until I see "Update Schedule" text 332ms

And I enter "schedule_name_org" as "scheduleName" 294ms

And I check radio button "schedule-cron" 10s 104ms

And I enter "0 0 15 3 * ?" as "cron" 216ms

And I click on "Update Schedule" 69ms

Then I wait until I see "Schedule successfully updated" text 452ms

And I should see a "schedule_name_org" text 184ms

And I should see a "Organization" text 65ms

And I should see a "0 0 15 3 * ?" text 66ms

When I follow the left menu "Admin > Organizations" 78ms

And I follow "SUSE Test" in the content area 85ms

And I follow "Recurring Actions" in the content area 72ms

Then I should see a "schedule_name" text 280ms

When I click the "schedule_name" item details button 71ms

Then I should see a "Every 3rd of the month at 15:00" text 164ms

When I click on "Back" 70ms

Then I should see a "Schedules" text 58ms

When I follow the left menu "Schedule > Recurring Actions" 155ms

Then I should not see a "Create" text 67ms

And I should see a "schedule_name_minion" text 527ms

And I should see a "Minion" text 69ms

And I should see a "schedule_name_group" text 73ms

And I should see a "Group" text 75ms

And I should see a "schedule_name_org" text 72ms

And I should see a "Organization" text 84ms

When I follow the left menu "Schedule > Recurring Actions" 61ms

And I click the "schedule_name_minion" item details button 479ms

Then I should see a "Every Wednesday at 01:35" text 147ms

And I should not see a "Schedules" text in the content area 29ms

When I click on "Back" 59ms

Then I should see a "schedule_name_group" text 469ms

When I follow the left menu "Admin > Organizations" 123ms

And I follow "SUSE Test" in the content area 73ms

And I follow "Recurring Actions" in the content area 68ms

Then I should see a "schedule_name_org" text 278ms

When I click the "schedule_name_org" item delete button 82ms

And I wait until I see "Delete Recurring Action Schedule" text 71ms

And I click on the red confirmation button 61ms

Then I wait until I see "Schedule 'schedule_name_org' has been deleted." text 290ms

When I follow the left menu "Systems > System Groups" 128ms

And I follow "Recurring-Action-test-group" 318ms

And I follow "Recurring Actions" in the content area 72ms

Then I should see a "schedule_name_group" text 272ms

When I click the "schedule_name_group" item delete button 88ms

And I wait until I see "Delete Recurring Action Schedule" text 69ms

And I click on the red confirmation button 57ms

Then I wait until I see "Schedule 'schedule_name_group' has been deleted." text 520ms

And I should see a "No schedules created. Use Create to add a schedule" text 61ms

When I am on the "Recurring Actions" page of this "sle_minion" 1s 30ms

Then I should see a "schedule_name_minion" text 304ms

When I click the "schedule_name_minion" item delete button 72ms

And I wait until I see "Delete Recurring Action Schedule" text 70ms

And I click on the red confirmation button 62ms

Then I wait until I see "Schedule 'schedule_name_minion' has been deleted." text 1s 122ms

And I should see a "No schedules created. Use Create to add a schedule" text 169ms

When I follow the left menu "Systems > System Groups" 76ms

And I follow "Recurring-Action-test-group" 304ms

And I follow "Delete Group" 311ms

And I click on "Confirm Deletion" 1s 53ms

Then I should see a "Your organization has no system groups." text 60ms

When I follow the left menu "Configuration > Channels" 123ms

And I follow "My State Channel for Recurring Actions" 434ms

And I follow "Delete Channel" 262ms

And I click on "Delete Config Channel" 460ms

Then I should see a "Channel 'My State Channel for Recurring Actions' has been deleted" text 53ms

@skip_if_github_validation @scc_credentials @scope_changing_software_channels @sle_minion
Feature:Assign child channel to a system 1m 28s 289ms 8 6

Given I am authorized 2s 295ms

Given I am on the Systems overview page of this "sle_minion" 0s

When I follow "Software" in the content area 0s

And I follow "Software Channels" in the content area 0s

And I wait until I do not see "Loading..." text 0s

And I check radio button "SLE-Product-SLES15-SP7-Pool for x86_64" 0s

Then radio button "SLE-Product-SLES15-SP7-Pool for x86_64" should be checked 0s

And I wait until I do not see "Loading..." text 0s

When I uncheck "SLE15-SP7-Installer-Updates for x86_64" 0s

And I should see "SLE15-SP7-Installer-Updates for x86_64" as unchecked 0s

And I click on "Next" 0s

Then I should see a "Confirm Software Channel Change" text 0s

When I click on "Confirm" 0s

Then I should see a "Changing the channels has been scheduled." text 0s

Warning: Radio button 'openSUSE Tumbleweed (x86_64)' is already checked

Given I am on the Systems overview page of this "sle_minion" 1s 740ms

When I follow "Software" in the content area 90ms

And I follow "Software Channels" in the content area 70ms

And I wait until I do not see "Loading..." text 61ms

And I check radio button "openSUSE Tumbleweed (x86_64)" 446ms

Then radio button "openSUSE Tumbleweed (x86_64)" should be checked 19ms

When I wait until I do not see "Loading..." text 751ms

And I uncheck "Uyuni Client Tools for openSUSE Tumbleweed (x86_64)" by label 40ms

Then I should see "Uyuni Client Tools for openSUSE Tumbleweed (x86_64)" as unchecked 17ms

When I uncheck "Uyuni Client Tools for openSUSE Tumbleweed (x86_64) (Development)" by label 84ms

Then I should see "Uyuni Client Tools for openSUSE Tumbleweed (x86_64) (Development)" as unchecked 15ms

When I click on "Next" 65ms

Then I should see a "Confirm Software Channel Change" text 62ms

When I click on "Confirm" 78ms

Then I should see a "Changing the channels has been scheduled." text 314ms

When I refresh the metadata for "sle_minion" 0s

Then channel "SLE-Product-SLES15-SP7-Pool for x86_64" should be enabled on "sle_minion" 0s

And channel "SLE15-SP7-Installer-Updates for x86_64" should be disabled on "sle_minion" 0s

When I refresh the metadata for "sle_minion" 7s 473ms

Then channel "openSUSE Tumbleweed (x86_64)" should be enabled on "sle_minion" 782ms

And channel "Uyuni Client Tools for openSUSE Tumbleweed (x86_64)" should be disabled on "sle_minion" 790ms

When I follow "Software" in the content area 0s

And I follow "Software Channels" in the content area 0s

And I wait until I do not see "Loading..." text 0s

Then radio button "SLE-Product-SLES15-SP7-Pool for x86_64" should be checked 0s

And I wait until I do not see "Loading..." text 0s

And I check "SLE15-SP7-Installer-Updates for x86_64" 0s

And I click on "Next" 0s

Then I should see a "Confirm Software Channel Change" text 0s

And I click on "Confirm" 0s

Then I should see a "Changing the channels has been scheduled." text 0s

When I follow "scheduled" in the content area 0s

And I wait until I see "1 system successfully completed this action." text, refreshing the page 0s

Then channel "SLE15-SP7-Installer-Updates for x86_64" should be enabled on "sle_minion" 0s

When I follow "Software" in the content area 69ms

And I follow "Software Channels" in the content area 69ms

And I wait until I do not see "Loading..." text 66ms

Then radio button "openSUSE Tumbleweed (x86_64)" should be checked 300ms

When I wait until I do not see "Loading..." text 434ms

And I check "Uyuni Client Tools for openSUSE Tumbleweed (x86_64)" by label 88ms

Then I should see "Uyuni Client Tools for openSUSE Tumbleweed (x86_64)" as checked 18ms

When I click on "Next" 84ms

Then I should see a "Confirm Software Channel Change" text 67ms

When I click on "Confirm" 68ms

Then I should see a "Changing the channels has been scheduled." text 444ms

When I follow "scheduled" in the content area 80ms

And I wait until I see "1 system successfully completed this action." text, refreshing the page 29s 794ms

Then channel "Uyuni Client Tools for openSUSE Tumbleweed (x86_64)" should be enabled on "sle_minion" 1s 14ms

Given I am on the Systems overview page of this "sle_minion" 1s 200ms

When I wait until event "Subscribe channels scheduled" is completed 2s 444ms

Then I should see a "The client completed this action on" text 59ms

When I follow "Software" in the content area 0s

And I follow "Software Channels" in the content area 0s

And I wait until I do not see "Loading..." text 0s

Then radio button "SLE-Product-SLES15-SP7-Pool for x86_64" should be checked 0s

And I wait until I do not see "Loading..." text 0s

And I should see "SLE15-SP7-Installer-Updates for x86_64" as checked 0s

When I follow "Software" in the content area 74ms

And I follow "Software Channels" in the content area 67ms

And I wait until I do not see "Loading..." text 64ms

Then radio button "openSUSE Tumbleweed (x86_64)" should be checked 194ms

And I wait until I do not see "Loading..." text 490ms

And I should see "Uyuni Client Tools for openSUSE Tumbleweed (x86_64)" as checked 19ms

When I refresh the metadata for "sle_minion" 0s

Then channel "SLE-Product-SLES15-SP7-Pool for x86_64" should be enabled on "sle_minion" 0s

And channel "SLE15-SP7-Installer-Updates for x86_64" should be enabled on "sle_minion" 0s

When I refresh the metadata for "sle_minion" 1s 415ms

Then channel "openSUSE Tumbleweed (x86_64)" should be enabled on "sle_minion" 846ms

And channel "Uyuni Client Tools for openSUSE Tumbleweed (x86_64)" should be enabled on "sle_minion" 845ms

When I follow "Software" in the content area 0s

And I follow "Software Channels" in the content area 0s

And I wait until I do not see "Loading..." text 0s

Then radio button "SLE-Product-SLES15-SP7-Pool for x86_64" should be checked 0s

And I wait until I do not see "Loading..." text 0s

And I wait until I see "ManagerTools-SLE15-Pool for x86_64 SP7" text 0s

And I include the recommended child channels 0s

And I check "SLE-Module-DevTools15-SP7-Pool for x86_64" 0s

And I check "Fake-RPM-SUSE-Channel" 0s

And I uncheck "SLE15-SP7-Installer-Updates for x86_64" 0s

And I click on "Next" 0s

Then I should see a "Confirm Software Channel Change" text 0s

When I click on "Confirm" 0s

Then I should see a "Changing the channels has been scheduled." text 0s

When I follow "scheduled" in the content area 0s

And I wait until I see "1 system successfully completed this action." text, refreshing the page 0s

Then channel "SLE15-SP7-Installer-Updates for x86_64" should be disabled on "sle_minion" 0s

When I follow "Software" in the content area 65ms

And I follow "Software Channels" in the content area 74ms

And I wait until I do not see "Loading..." text 70ms

Then radio button "openSUSE Tumbleweed (x86_64)" should be checked 145ms

And I wait until I do not see "Loading..." text 410ms

And I wait until I see "Uyuni Client Tools for openSUSE Tumbleweed (x86_64)" text 83ms

And I uncheck "Uyuni Client Tools for openSUSE Tumbleweed (x86_64)" by label 80ms

Then I should see "Uyuni Client Tools for openSUSE Tumbleweed (x86_64)" as unchecked 16ms

When I check "Uyuni Client Tools for openSUSE Tumbleweed (x86_64) (Development)" by label 79ms

Then I should see "Uyuni Client Tools for openSUSE Tumbleweed (x86_64) (Development)" as checked 16ms

When I check "Fake-RPM-SUSE-Channel" 42ms

And I click on "Next" 69ms

Then I should see a "Confirm Software Channel Change" text 66ms

When I click on "Confirm" 79ms

And I wait until I see "Changing the channels has been scheduled." text 402ms

And I follow "scheduled" in the content area 79ms

And I wait until I see "1 system successfully completed this action." text, refreshing the page 30s 168ms

Then channel "Uyuni Client Tools for openSUSE Tumbleweed (x86_64)" should be disabled on "sle_minion" 809ms

Given I am authorized 1s 819ms

When I install package "rute-dummy=2.1-1.1" on this "sle_minion" 2s 356ms

And I refresh packages list via spacecmd on "sle_minion" 8s 853ms

And I wait until refresh package list on "sle_minion" is finished 12s 854ms

And I am on the "Software" page of this "sle_minion" 1s 78ms

And I follow "Packages" 499ms

And I follow "List / Remove" 730ms

And I enter "rute-dummy" as the filtered package name 50ms

And I click on the filter button until page does contain "rute-dummy" text 10s 949ms

Then the table row for "rute-dummy-2.1-1.1" should contain "retracted" icon 21ms

When I remove package "rute-dummy" from this "sle_minion" 1s 823ms

And I refresh packages list via spacecmd on "sle_minion" 7s 604ms

And I wait until package "rute-dummy" is removed from "sle_minion" via spacecmd 9s 37ms

When I am on the "Software" page of this "sle_minion" 1s 155ms

And I follow "Packages" 423ms

And I follow "Install" 522ms

And I enter "rute-dummy" as the filtered package name 57ms

And I click on the filter button until page does contain "rute-dummy" text 10s 797ms

Then I should see a "rute-dummy-2.0-1.2" text 74ms

And I should not see a "rute-dummy-2.1-1.1" text 70ms

When I install old package "rute-dummy=2.0-1.2" on this "sle_minion" 2s 2ms

And I refresh packages list via spacecmd on "sle_minion" 8s 204ms

And I wait until refresh package list on "sle_minion" is finished 10s 565ms

And I am on the "Software" page of this "sle_minion" 1s 298ms

And I follow "Packages" 563ms

And I follow "Upgrade" 578ms

Then I should not see a "rute-dummy-2.1-1.1" text 78ms

When I remove package "rute-dummy" from this "sle_minion" 1s 822ms

And I refresh packages list via spacecmd on "sle_minion" 6s 884ms

And I wait until package "rute-dummy" is removed from "sle_minion" via spacecmd 9s 258ms

When I install package "rute-dummy=2.0-1.2" on this "sle_minion" 2s 5ms

And I refresh packages list via spacecmd on "sle_minion" 6s 751ms

And I wait until refresh package list on "sle_minion" is finished 12s 362ms

And I follow the left menu "Software > Channel List > All" 192ms

And I follow "Show All Child Channels" 66ms

And I follow "Fake-RPM-SUSE-Channel" 600ms

And I follow "Patches" in the content area 75ms

And I follow "rute-dummy-0817" 438ms

And I follow "Affected Systems" 296ms

Then I should see a "No systems." text 68ms

When I remove package "rute-dummy" from this "sle_minion" 1s 847ms

And I refresh packages list via spacecmd on "sle_minion" 8s 390ms

And I wait until package "rute-dummy" is removed from "sle_minion" via spacecmd 7s 292ms

When I follow the left menu "Software > Channel List > All" 188ms

And I follow "Show All Child Channels" 55ms

And I follow "Fake-RPM-SUSE-Channel" 587ms

And I follow "Packages" in the content area 65ms

And I follow "rute-dummy-2.0-1.2.x86_64" 672ms

And I follow "Target Systems" 778ms

And I refresh page until I see "sle_minion" hostname as text 137ms

When I follow the left menu "Software > Channel List > All" 141ms

And I follow "Show All Child Channels" 58ms

And I follow "Fake-RPM-SUSE-Channel" 589ms

And I follow "Packages" in the content area 73ms

And I follow "rute-dummy-2.1-1.1.x86_64" 567ms

And I follow "Target Systems" 389ms

Then I should not see "sle_minion" hostname 10s 95ms

When I follow the left menu "Patches > Patch List > All" 195ms

And I enter "dummy" as the filtered synopsis 52ms

And I click on the filter button 669ms

And I follow "rute-dummy-0815" 538ms

Then I should see a "Status: Retracted" text 65ms

When I go back 649ms

And I enter "dummy" as the filtered synopsis 53ms

And I click on the filter button 827ms

And I follow "rute-dummy-0816" 456ms

Then I should see a "Status: Stable" text 68ms

When I go back 538ms

And I enter "dummy" as the filtered synopsis 49ms

And I click on the filter button 669ms

And I follow "rute-dummy-0817" 378ms

Then I should see a "Status: Retracted" text 65ms

When I follow the left menu "Patches > Patch List > All" 94ms

And I enter "dummy" as the filtered synopsis 40ms

And I click on the filter button 637ms

Then the table row for "rute-dummy-0815" should contain "retracted" icon 21ms

And the table row for "rute-dummy-0816" should not contain "retracted" icon 14ms

And the table row for "rute-dummy-0817" should contain "retracted" icon 18ms

When I follow the left menu "Software > Channel List > All" 193ms

And I follow "Show All Child Channels" 75ms

And I follow "Fake-RPM-SUSE-Channel" 576ms

And I follow "Patches" in the content area 71ms

Then the table row for "rute-dummy-0815" should contain "retracted" icon 24ms

And the table row for "rute-dummy-0816" should not contain "retracted" icon 11ms

And the table row for "rute-dummy-0817" should contain "retracted" icon 15ms

When I follow the left menu "Software > Channel List > All" 74ms

And I follow "Show All Child Channels" 50ms

And I follow "Fake-RPM-SUSE-Channel" 586ms

And I follow "Packages" in the content area 87ms

Then the table row for "rute-dummy-2.0-1.1.x86_64" should contain "retracted" icon 22ms

Then the table row for "rute-dummy-2.0-1.2.x86_64" should not contain "retracted" icon 15ms

Then the table row for "rute-dummy-2.1-1.1.x86_64" should contain "retracted" icon 22ms

When I follow the left menu "Systems > System List > All" 190ms

And I click on the clear SSM button 69ms

And I check the "sle_minion" client 458ms

And I follow the left menu "Systems > System Set Manager > Overview" 501ms

And I follow "Packages" in the content area 64ms

And I follow "Install" 484ms

And I follow "Fake-RPM-SUSE-Channel" 365ms

Then I should see a "rute-dummy-2.0-1.2" text 85ms

And I should not see a "rute-dummy-2.1-1.1" text 86ms

And I click on the clear SSM button 47ms

@skip_if_github_validation @containerized_server @proxy @build_host @private_net @pxeboot_minion @scope_cobbler @bug_reported
Feature:PXE boot a terminal with Cobbler and containerized proxy < 1ms 19

* Related GitHub Card: https://github.com/SUSE/spacewalk/issues/29863
In order to automate client system installations with a containerized proxy
As the system administrator
I want to PXE boot one host with Cobbler

Given I am authorized for the "Admin" section 0s

When I start local monitoring of Cobbler 0s

When I install packages "tftpboot-installation-SLE-15-SP7-x86_64 expect" on this "build_host" 0s

And I copy "/usr/share/tftpboot-installation" from "build_host" to "server" via scp in the path "/tmp" 0s

And I copy the distribution inside the container on the server 0s

When I follow the left menu "Systems > Autoinstallation > Distributions" 0s

And I follow "Create Distribution" 0s

And I enter "SLE-15-SP7-TFTP" as "label" 0s

And I enter "/srv/www/distributions/SLE-15-SP7-TFTP/" as "basepath" 0s

And I select "SLE-Product-SLES15-SP7-Pool for x86_64" from "channelid" 0s

And I select "SUSE Linux Enterprise 15" from "installtype" 0s

And I click on "Create Autoinstallable Distribution" 0s

Then I should see a "Autoinstallable Distributions" text 0s

And I should see a "SLE-15-SP7-TFTP" link 0s

When I follow the left menu "Systems > Autoinstallation > Distributions" 0s

And I follow "SLE-15-SP7-TFTP" 0s

And I enter "useonlinerepo insecure=1 install=http://proxy.example.org/ks/dist/SLE-15-SP7-TFTP self_update=http://proxy.example.org/ks/dist/child/sle15-sp7-installer-updates-x86_64/SLE-15-SP7-TFTP" as "kernelopts" 0s

And I click on "Update Autoinstallable Distribution" 0s

Then I should see a "Autoinstallable Distribution Updated" text 0s

When I follow the left menu "Systems > Autoinstallation > Profiles" 0s

And I follow "Upload Kickstart/AutoYaST File" 0s

And I enter "15-sp7-cobbler" as "kickstartLabel" 0s

And I select "SLE-15-SP7-TFTP" from "kstreeId" 0s

And I attach the file "/sle-15-sp7-autoyast.xml" to "fileUpload" 0s

And I click on "Create" 0s

Then I should see a "Autoinstallation: 15-sp7-cobbler" text 0s

And I should see a "Autoinstallation Details" text 0s

When I follow the left menu "Systems > Autoinstallation > Profiles" 0s

And I follow "Upload Kickstart/AutoYaST File" 0s

And I enter "15-sp7-cobbler" as "kickstartLabel" 0s

And I select "SLE-15-SP7-TFTP" from "kstreeId" 0s

And I attach the file "/sle-15-sp7-autoyast-uyuni.xml" to "fileUpload" 0s

And I click on "Create" 0s

Then I should see a "Autoinstallation: 15-sp7-cobbler" text 0s

And I should see a "Autoinstallation Details" text 0s

When I enter "self_update=0" as "kernel_options" 0s

And I click on "Update" 0s

And I follow "Variables" 0s

And I enter "distrotree=SLE-15-SP7-TFTP\nregistration_key=1-TERMINAL-KEY-x86_64\nredhat_management_server=proxy.example.org" as "variables" text area 0s

And I click on "Update Variables" 0s

And I follow "Autoinstallation File" 0s

Then I should see a "SLE-15-SP7-TFTP" text 0s

Given cobblerd is running 0s

And cobbler settings are successfully migrated 0s

When I restart cobbler on the server 0s

Then service "cobblerd" is active on "server" 0s

When I set the default PXE menu entry to the target profile on the "server" 0s

And I reboot the Cobbler terminal "pxeboot_minion" 0s

And I wait for "60" seconds 0s

And I set the default PXE menu entry to the local boot on the "server" 0s

And I wait at most 1200 seconds until Salt master sees "pxeboot_minion" as "unaccepted" 0s

And I accept "pxeboot_minion" key in the Salt master 0s

Given I am on the Systems page 0s

When I wait until I see the name of "pxeboot_minion", refreshing the page 0s

And I wait until onboarding is completed for "pxeboot_minion" 0s

Then "pxeboot_minion" should have been reformatted 0s

When I follow "Details" in the content area 0s

And I follow "Connection" in the content area 0s

Then I should see a "proxy.example.org" text 0s

When I install the GPG key of the test packages repository on the PXE boot minion 0s

And I follow "Software" in the content area 0s

And I follow "Install" 0s

And I enter "virgo-dummy-2.0-1.1" as the filtered package name 0s

And I click on the filter button 0s

And I check "virgo-dummy-2.0-1.1" in the list 0s

And I click on "Install Packages" 0s

And I click on "Confirm" 0s

Then I should see a "1 package install has been scheduled" text 0s

When I wait until event "Package Install/Upgrade scheduled by admin" is completed 0s

When I follow the left menu "Systems > Autoinstallation > Profiles" 0s

And I follow "15-sp7-cobbler" 0s

And I follow "Autoinstallation File" in the content area 0s

And I follow "Download Autoinstallation File" 0s

Then I should see a "<profile " text 0s

When I follow the left menu "Systems > Autoinstallation > Profiles" 0s

And I follow "15-sp7-cobbler" 0s

And I follow "Delete Autoinstallation" 0s

And I click on "Delete Autoinstallation" 0s

And I wait until I do not see "15-sp7-cobbler" text 0s

And I wait up to 5 minutes to see "TASK COMPLETE" in the last lines of "var/log/cobbler/cobbler.log" on "server" 0s

When I follow the left menu "Systems > Autoinstallation > Distributions" 0s

And I follow "SLE-15-SP7-TFTP" 0s

And I follow "Delete Distribution" 0s

And I click on "Delete Distribution" 0s

And I wait until I do not see "SLE-15-SP7-TFTP" text 0s

And I wait up to 5 minutes to see "TASK COMPLETE" in the last lines of "var/log/cobbler/cobbler.log" on "server" 0s

When I remove packages "tftpboot-installation-SLE-15-SP7-x86_64 expect" from this "build_host" 0s

And I remove the autoinstallation files from the server 0s

When I delete "pxeboot_minion" system using the api 0s

And I wait until Salt client is inactive on the PXE boot minion 0s

Then "pxeboot_minion" should not be registered 0s

Then the local logs for Cobbler should not contain errors 0s

@containerized_server @skip_if_github_validation @build_host @proxy @private_net @pxeboot_minion @scope_retail
Feature:PXE boot a Retail terminal behind a containerized proxy < 1ms 17

In order to manage my terminals in a Retail context
As the system administrator
I PXE boot one of the terminals

Given I am authorized for the "Admin" section 0s

When I follow the left menu "Systems > System Groups" 0s

And I follow "Create Group" 0s

And I enter "HWTYPE:Intel-Genuine" as "name" 0s

And I enter "Terminal hardware type: genuine Intel" as "description" 0s

And I click on "Create Group" 0s

Then I should see a "System group HWTYPE:Intel-Genuine created." text 0s

When I follow the left menu "Systems > System Groups" 0s

And I follow "Create Group" 0s

And I enter "example" as "name" 0s

And I enter "Terminal branch: example.org" as "description" 0s

And I click on "Create Group" 0s

Then I should see a "System group example created." text 0s

When I follow the left menu "Systems > System Groups" 0s

And I follow "Create Group" 0s

And I enter "TERMINALS" as "name" 0s

And I enter "All terminals" as "description" 0s

And I click on "Create Group" 0s

Then I should see a "System group TERMINALS created." text 0s

When I follow the left menu "Systems > System Groups" 0s

And I follow "Create Group" 0s

And I enter "SERVERS" as "name" 0s

And I enter "All branch servers" as "description" 0s

And I click on "Create Group" 0s

Then I should see a "System group SERVERS created." text 0s

When I follow the left menu "Systems > System Groups" 0s

And I follow "example" in the content area 0s

And I follow "Formulas" in the content area 0s

And I check the "saltboot-group" formula 0s

And I click on "Save" 0s

And I wait until I see "Formula saved." text 0s

Then the "saltboot-group" formula should be checked 0s

When I follow the left menu "Systems > System Groups" 0s

And I follow "example" in the content area 0s

And I follow "Formulas" in the content area 0s

And I follow first "Saltboot Group" in the content area 0s

And I enter "proxy.example.org" as "Image download server" 0s

And I check containerized proxy box 0s

And I click on "Save Formula" 0s

Then I should see a "Formula saved" text 0s

When I follow the left menu "Systems > System Groups" 0s

And I follow "HWTYPE:Intel-Genuine" in the content area 0s

And I follow "Formulas" in the content area 0s

And I check the "saltboot" formula 0s

And I click on "Save" 0s

And I wait until I see "Formula saved." text 0s

Then the "saltboot" formula should be checked 0s

When I follow the left menu "Systems > System Groups" 0s

And I follow "HWTYPE:Intel-Genuine" in the content area 0s

And I follow "Formulas" in the content area 0s

And I follow first "Saltboot" in the content area 0s

And I click on "Expand All Sections" 0s

And I enter "disk1" in disk id field 0s

And I enter "/dev/vda" in disk device field 0s

And I select "msdos" in disk label field 0s

And I enter "p1" in first partition id field 0s

And I enter "256" in first partition size field 0s

And I select "swap" in first filesystem format field 0s

And I select "swap" in first partition flags field 0s

And I press "Add Item" in partitions section 0s

And I enter "p2" in second partition id field 0s

And I enter "/data" in second mount point field 0s

And I select "xfs" in second filesystem format field 0s

And I enter "secret-password" in second partition password field 0s

And I press "Add Item" in partitions section 0s

And I enter "p3" in third partition id field 0s

And I enter "/" in third mount point field 0s

And I enter the image name for "pxeboot_minion" in third OS image field 0s

And I click on "Save Formula" 0s

Then I should see a "Formula saved" text 0s

When I reboot the Retail terminal "pxeboot_minion" 0s

And I wait at most 180 seconds until Salt master sees "pxeboot_minion" as "unaccepted" 0s

And I accept "pxeboot_minion" key in the Salt master 0s

Given I am on the Systems page 0s

When I wait until I see the name of "pxeboot_minion", refreshing the page 0s

And I follow this "pxeboot_minion" link 0s

And I follow "Events" 0s

And I follow "History" 0s

And I wait until I see "added system entitlement" text, refreshing the page 0s

And I wait until event "Apply states [saltboot]" is completed 0s

And I follow "Software" in the content area 0s

And I follow "Software Channels" in the content area 0s

And I wait until radio button "SLE-Product-SLES15-SP7-Pool for x86_64" is checked, refreshing the page 0s

And I wait until event "Package List Refresh" is completed 0s

Then "pxeboot_minion" should have been reformatted 0s

When I navigate to the Systems overview page of this "pxeboot_minion" 0s

And I follow "Details" in the content area 0s

And I follow "Connection" in the content area 0s

Then I should see a "proxy.example.org" text 0s

When I navigate to the Systems overview page of this "pxeboot_minion" 0s

And I install the GPG key of the test packages repository on the PXE boot minion 0s

And I follow "Software" in the content area 0s

And I follow "Install" 0s

And I enter "virgo" as the filtered package name 0s

And I click on the filter button 0s

And I check "virgo-dummy-2.0-1.1" in the list 0s

And I click on "Install Packages" 0s

And I click on "Confirm" 0s

Then I should see a "1 package install has been scheduled" text 0s

When I wait until event "Package Install/Upgrade scheduled by admin" is completed 0s

When I navigate to the Systems overview page of this "pxeboot_minion" 0s

And I follow "Software" in the content area 0s

And I follow "List / Remove" 0s

And I enter "virgo" as the filtered package name 0s

And I click on the filter button 0s

And I check "virgo-dummy-2.0-1.1" in the list 0s

And I click on "Remove Packages" 0s

And I click on "Confirm" 0s

Then I should see a "1 package removal has been scheduled" text 0s

When I wait until event "Package Removal scheduled by admin" is completed 0s

When I navigate to the Systems overview page of this "pxeboot_minion" 0s

And I follow "Remote Command" 0s

And I enter "#!/bin/sh\nrm /etc/ImageVersion*" as "script_body" text area 0s

And I click on "Schedule" 0s

Then I should see a "Remote Command has been scheduled" text 0s

When I wait until event "Remote Command" is completed 0s

When I navigate to the Systems overview page of this "pxeboot_minion" 0s

And I follow "Delete System" 0s

Then I should see a "Confirm System Profile Deletion" text 0s

When I click on "Delete Profile" 0s

And I wait until I see "has been deleted" text 0s

And I wait until Salt client is inactive on the PXE boot minion 0s

Then "pxeboot_minion" should not be registered 0s

When I follow the left menu "Systems > System Groups" 0s

And I follow "HWTYPE:Intel-Genuine" in the content area 0s

And I follow "Delete Group" in the content area 0s

And I click on "Confirm Deletion" 0s

Then I should see a "deleted" text 0s

When I follow "example" in the content area 0s

And I follow "Delete Group" in the content area 0s

And I click on "Confirm Deletion" 0s

Then I should see a "deleted" text 0s

When I follow "TERMINALS" in the content area 0s

And I follow "Delete Group" in the content area 0s

And I click on "Confirm Deletion" 0s

Then I should see a "deleted" text 0s

When I follow "SERVERS" in the content area 0s

And I follow "Delete Group" in the content area 0s

And I click on "Confirm Deletion" 0s

Then I should see a "deleted" text 0s

@containerized_server @skip_if_github_validation @proxy @private_net @pxeboot_minion @scope_retail
Feature:Mass import of Retail terminals behind a containerized proxy < 1ms 9

In order to manage my terminals in a Retail context
As the system administrator
I perform a mass import of several virtual terminals and one real minion

Given I am authorized for the "Admin" section 0s

When I prepare the retail configuration file on server 0s

And I import the retail configuration using retail_yaml command 0s

And I am on the Systems page 0s

Then I should see the terminals imported from the configuration file 0s

When I create the bootstrap script for "proxy.example.org" hostname and "1-TERMINAL-KEY-x86_64" activation key on "server" 0s

And I bootstrap pxeboot minion via bootstrap script on the proxy 0s

And I wait at most 350 seconds until Salt master sees "pxeboot_minion" as "unaccepted" 0s

And I accept key of pxeboot minion in the Salt master 0s

Then I follow the left menu "Systems > System List > All" 0s

And I wait until I see the name of "pxeboot_minion", refreshing the page 0s

Given I am on the Systems page 0s

When I follow "pxeboot" terminal 0s

And I follow "Details" in the content area 0s

And I follow "Connection" in the content area 0s

Then I should see a "proxy.example.org" text 0s

Given I am on the Systems page 0s

When I follow "pxeboot" terminal 0s

And I follow "Software" in the content area 0s

And I follow "Install" 0s

And I enter "virgo" as the filtered package name 0s

And I click on the filter button 0s

And I check "virgo-dummy-2.0-1.1" in the list 0s

And I click on "Install Packages" 0s

And I click on "Confirm" 0s

Then I should see a "1 package install has been scheduled" text 0s

When I wait until event "Package Install/Upgrade scheduled by admin" is completed 0s

Given I am on the Systems page 0s

When I follow "pxeboot" terminal 0s

And I follow "Software" in the content area 0s

And I follow "List / Remove" 0s

And I enter "virgo" as the filtered package name 0s

And I click on the filter button 0s

And I check "virgo-dummy-2.0-1.1" in the list 0s

And I click on "Remove Packages" 0s

And I click on "Confirm" 0s

Then I should see a "1 package removal has been scheduled" text 0s

When I wait until event "Package Removal scheduled by admin" is completed 0s

When I wait until Salt client is inactive on the PXE boot minion 0s

Given I am on the Systems page 0s

When I delete all the imported terminals 0s

Then I should not see any terminals imported from the configuration file 0s

When I follow the left menu "Systems > System Groups" 0s

And I follow "HWTYPE:Intel-Genuine" in the content area 0s

And I follow "Delete Group" in the content area 0s

And I click on "Confirm Deletion" 0s

Then I should see a "deleted" text 0s

When I follow "example.org" in the content area 0s

And I follow "Delete Group" in the content area 0s

And I click on "Confirm Deletion" 0s

Then I should see a "deleted" text 0s

When I follow "TERMINALS" in the content area 0s

And I follow "Delete Group" in the content area 0s

And I click on "Confirm Deletion" 0s

Then I should see a "deleted" text 0s

When I follow "SERVERS" in the content area 0s

And I follow "Delete Group" in the content area 0s

And I click on "Confirm Deletion" 0s

Then I should see a "deleted" text 0s

@skip_if_github_validation @skip_if_containerized_server
Feature:Restart the spacewalk services via UI < 1ms 1

Given I am authorized for the "Admin" section 0s

When I follow the left menu "Admin > Manager Configuration > Restart" 0s

And I check "restart" 0s

And I click on "Restart" 0s

And I wait until I see "restarting. If this page" text 0s

And I wait at most "300" seconds until I do not see "restarting. If this page" text 0s

And I refresh the page 0s

Then I follow the left menu "Admin > Manager Configuration > Restart" 0s

@skip_if_github_validation @scope_visualization @sle_minion
Feature:Correct timezone display 1m 3s 87ms 11

Given I am authorized for the "Admin" section 2s 172ms

When I follow the left menu "Users > User List > Active" 187ms

And I follow "Create User" 419ms

And I enter "MalaysianUser" as "login" 66ms

And I enter "MalaysianUser" as "desiredpassword" 69ms

And I enter "MalaysianUser" as "desiredpasswordConfirm" 81ms

And I select "Mr." from "prefix" 55ms

And I enter "Test" as "firstNames" 58ms

And I enter "User" as "lastName" 54ms

And I enter "galaxy-noise@localhost" as "email" 75ms

And I select "(GMT+0800) Malaysia" from "timezone" 72ms

And I click on "Create Login" 6s 741ms

When I follow the left menu "Users > User List > Active" 96ms

And I follow "MalaysianUser" 447ms

And the "role_satellite_admin" checkbox should be disabled 10s

And I check "role_org_admin" 88ms

And I check "role_system_group_admin" 82ms

And I check "role_channel_admin" 83ms

And I check "role_activation_key_admin" 83ms

And I check "role_config_admin" 80ms

And I click on "Update" 897ms

Given I am authorized as "MalaysianUser" with password "MalaysianUser" 2s 636ms

Then I should see a "MalaysianUser" link 12ms

Given I am on the Systems overview page of this "sle_minion" 1s 851ms

When I follow "Remote Command" in the content area 72ms

And I enter as remote command this script in #!/bin/bash ls 54ms

And I click on "Schedule" 67ms

And I wait until I see "Remote Command has been scheduled successfully" text 78ms

And I follow "Events" in the content area 76ms

And I follow "Pending" in the content area 107ms

And I wait at most 180 seconds until I do not see "Remote Command on" text, refreshing the page 16s 558ms

And I follow "History" in the content area 71ms

And I follow first "scheduled by MalaysianUser" 520ms

Then I should see a "MYT" text 64ms

Given I am authorized as "MalaysianUser" with password "MalaysianUser" 512ms

Then I should see a "MalaysianUser" link 8ms

Given I am on the Systems overview page of this "sle_minion" 1s 691ms

When I follow "Remote Command" in the content area 68ms

And I enter as remote command this script in #!/bin/bash ls 51ms

And I enter "00:00" as "date_timepicker_widget_input" 74ms

And I click on "Schedule" 56ms

Then I should see a "00:00:00 MYT" text 79ms

Given I am authorized as "MalaysianUser" with password "MalaysianUser" 658ms

Then I should see a "MalaysianUser" link 8ms

- Try to cancel "Remote Command on uyuni-master-suse-minion.sumaci.aws. scheduled by MalaysianUser" action
- Removed "Remote Command on uyuni-master-suse-minion.sumaci.aws. scheduled by MalaysianUser" action

Given I am authorized for the "Admin" section 2s 516ms

And I cancel all scheduled actions via API 1s 344ms

When I follow the left menu "Users > User List > Active" 200ms

And I follow "MalaysianUser" 429ms

And I uncheck "role_org_admin" 10s 84ms

And I click on "Update" 659ms

Then I should see "role_org_admin" as unchecked 17ms

And I should see "role_system_group_admin" as checked 20ms

And I should see "role_channel_admin" as checked 19ms

And I should see "role_activation_key_admin" as checked 21ms

And I should see "role_config_admin" as checked 21ms

When I delete user "MalaysianUser" 459ms

* Related GitHub Card: https://github.com/SUSE/spacewalk/issues/30427

Given I am authorized for the "Admin" section 456ms

When I deploy testing playbooks and inventory files to "sle_minion" 3s 918ms

Given I am on the Systems overview page of this "sle_minion" 0s

When I follow "Software" in the content area 0s

And I follow "Software Channels" in the content area 0s

And I check "SLE-Module-Python3-15-SP7-Pool for x86_64" by label 0s

And I click on "Next" 0s

And I click on "Confirm" 0s

And I wait until I see "Changing the channels has been scheduled." text 0s

And I follow "scheduled" 0s

And I wait until I see "1 system successfully completed this action" text, refreshing the page 0s

Given I am on the Systems overview page of this "sle_minion" 974ms

When I follow "Properties" in the content area 75ms

And I check "ansible_control_node" 83ms

And I click on "Update Properties" 2s 16ms

Then I wait until I see "Ansible Control Node type has been applied." text 95ms

Given I am on the Systems overview page of this "sle_minion" 967ms

When I follow "States" in the content area 74ms

And I click on "Apply Highstate" 111ms

And I wait until event "Apply highstate scheduled" is completed 4s 139ms

Then "ansible" should be installed on "sle_minion" 674ms Show Error +
                                            
FAIL: rpm -q ansible returned status code = 1. Output: package ansible is not installed (ScriptError) ./features/support/remote_node.rb:172:in `run_local' ./features/support/remote_node.rb:120:in `run' ./features/step_definitions/command_steps.rb:217:in `/^"([^"]*)" should be installed on "([^"]*)"$/' features/secondary/min_ansible_control_node.feature:40:in `"ansible" should be installed on "sle_minion"'

19s 211ms Show Info +
16:02:07:000 - 16:02:14:000 | Current URL: https://uyuni-master-server.sumaci.aws/rhn/systems/details/history/Event.do?sid=1000010020&aid=198
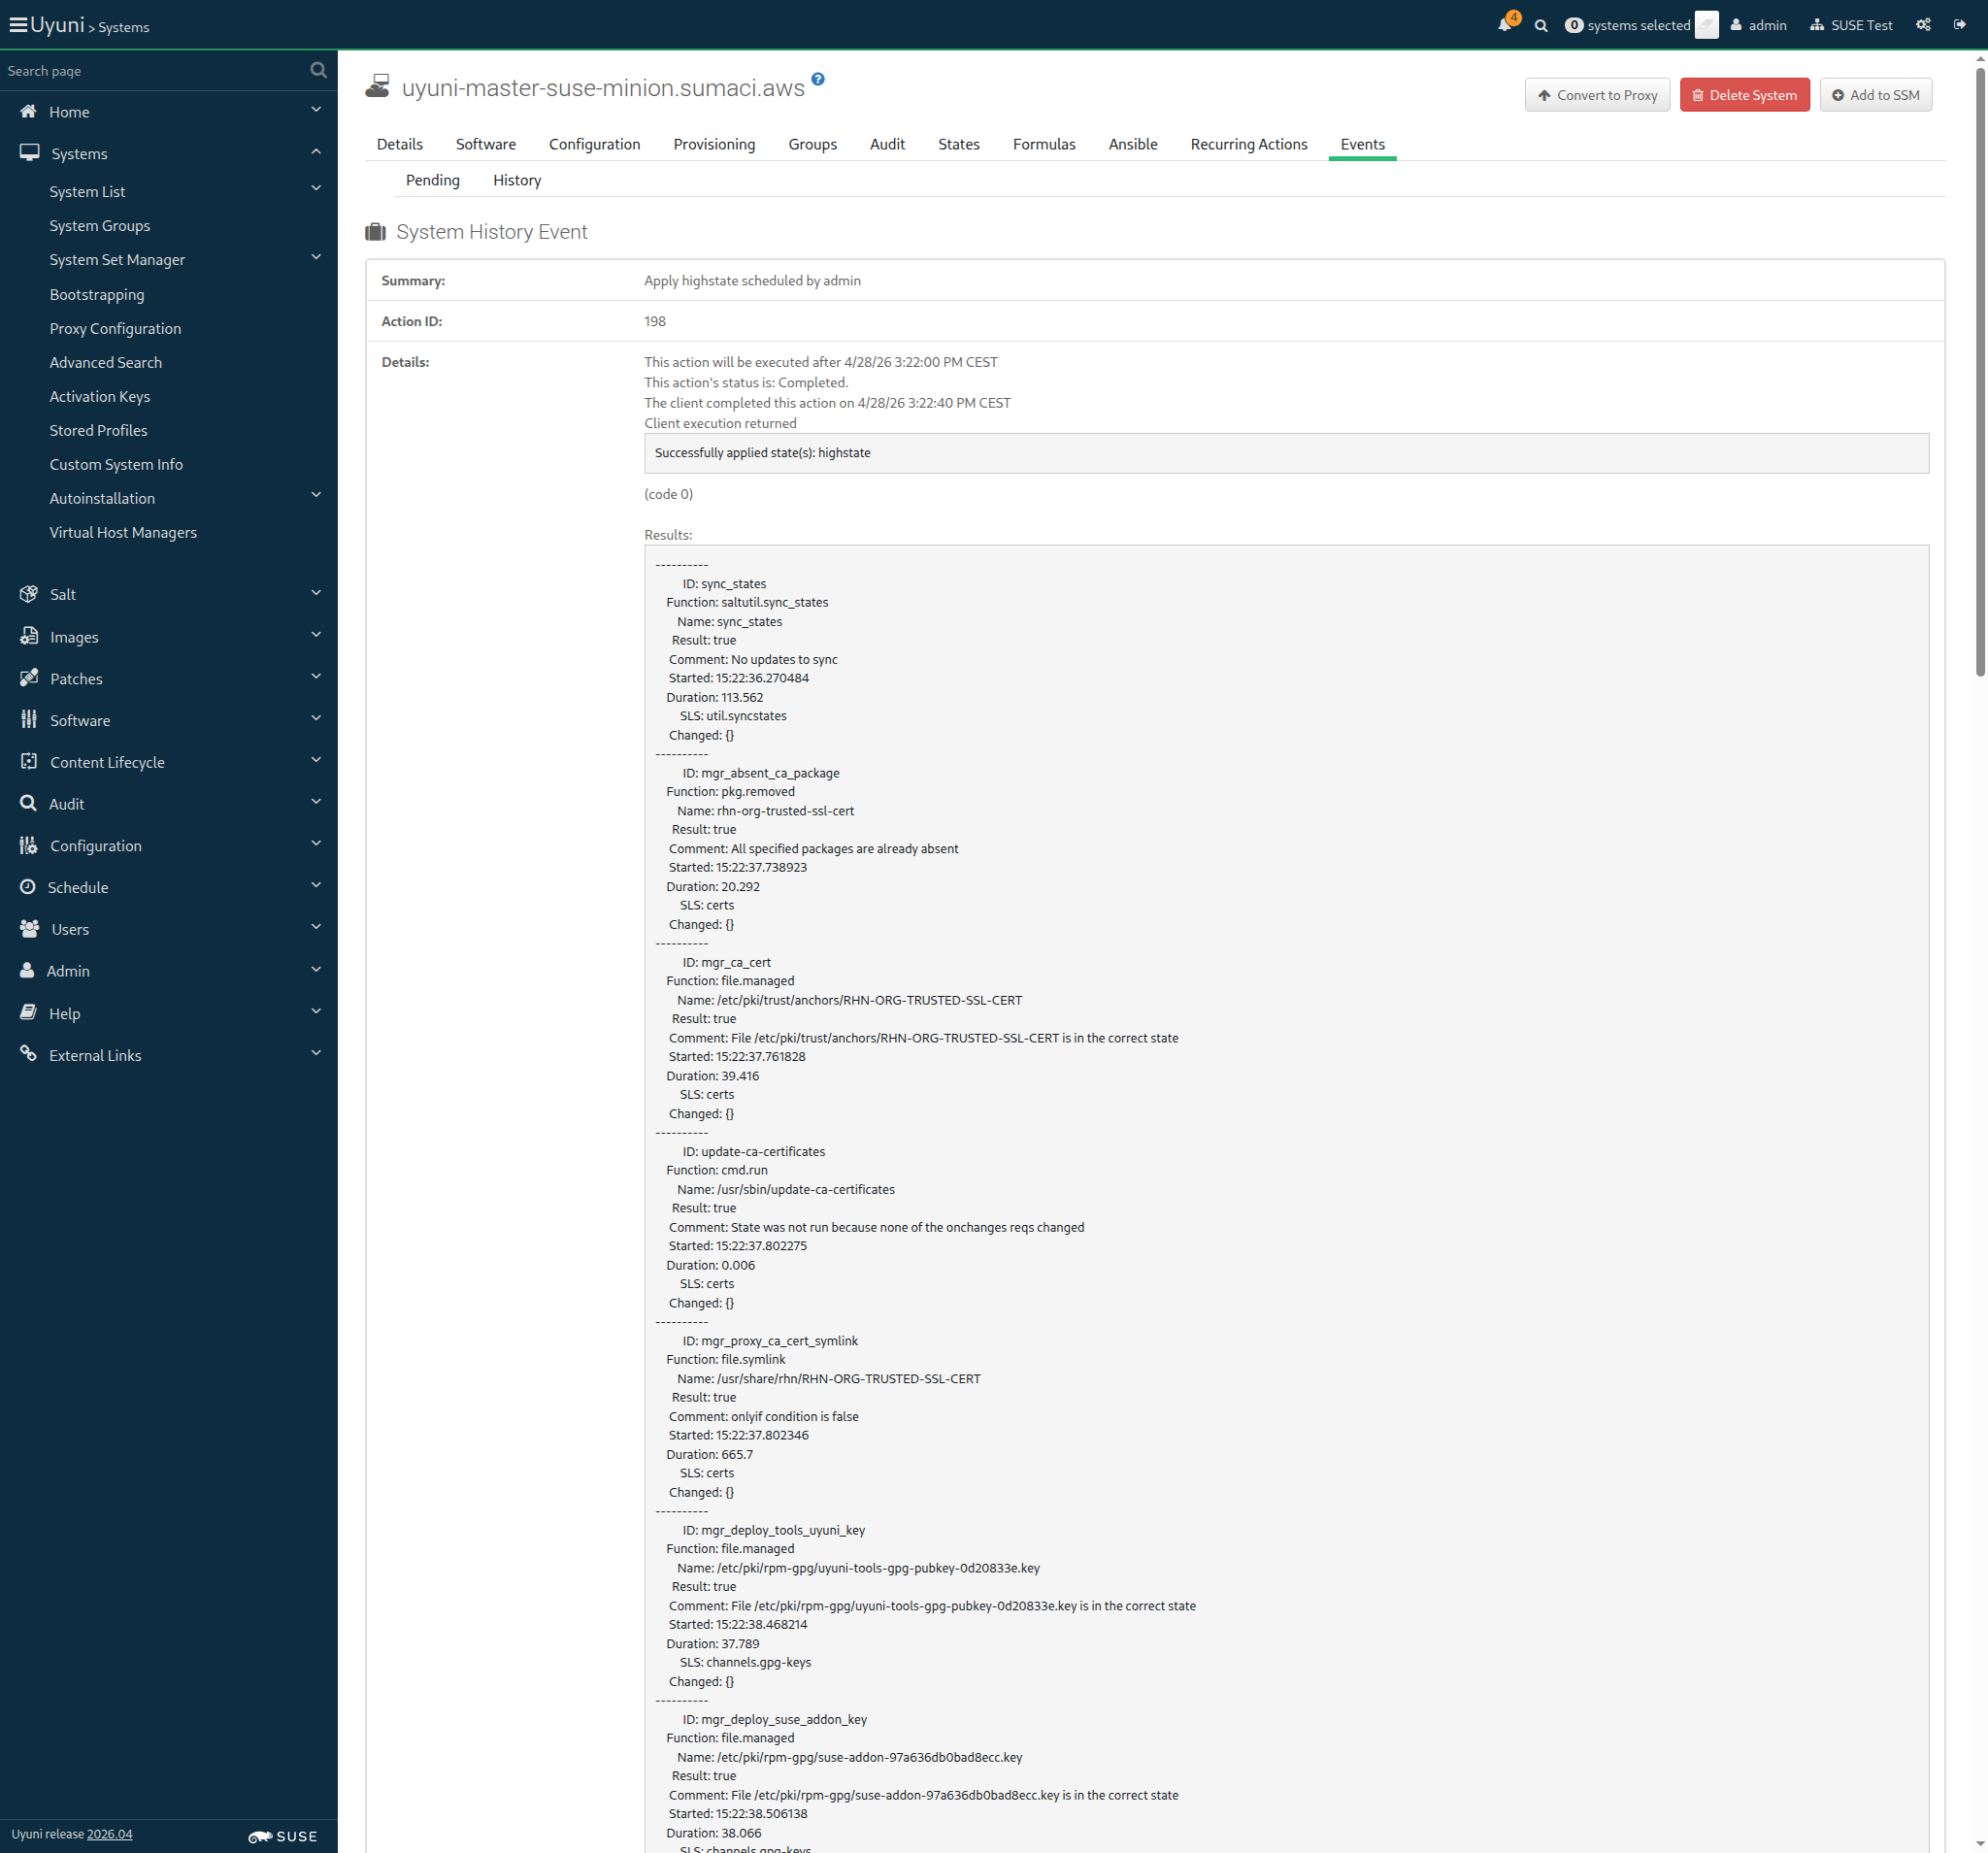
Screenshot +


Given I am on the Systems overview page of this "sle_minion" 937ms

When I follow "Ansible" in the content area 72ms

Then I should see a "Ansible Control Node Configuration" text 62ms

Given I am on the Systems overview page of this "sle_minion" 951ms

When I follow "Ansible" in the content area 65ms

Then I should see a "Ansible Control Node Configuration" text 63ms

And I enter "/srv/playbooks/" as "new_playbook_path_input" 173ms

And I click on "new_playbook_path_save" 60ms

And I enter "/srv/playbooks/orion_dummy/hosts" as "new_inventory_path_input" 103ms

And I click on "new_inventory_path_save" 66ms

Given I am on the Systems overview page of this "sle_minion" 1s 364ms

When I follow "Ansible" in the content area 62ms

And I follow "Inventories" in the content area 71ms

And I wait until I see "/srv/playbooks/orion_dummy/hosts" text 251ms

And I click on the inventory accordion for "/srv/playbooks/orion_dummy/hosts" 51ms

Then I wait until I see "myself" text 4m 10s 20ms Show Error +
                                            
Text 'myself' not found (ScriptError) ./features/step_definitions/navigation_steps.rb:40:in `/^I wait until I see "([^"]*)" text$/' features/secondary/min_ansible_control_node.feature:63:in `I wait until I see "myself" text'

18s 395ms Show Info +
16:02:37:000 - 16:06:49:000 | Current URL: https://uyuni-master-server.sumaci.aws/rhn/manager/systems/details/ansible/inventories?sid=1000010020&
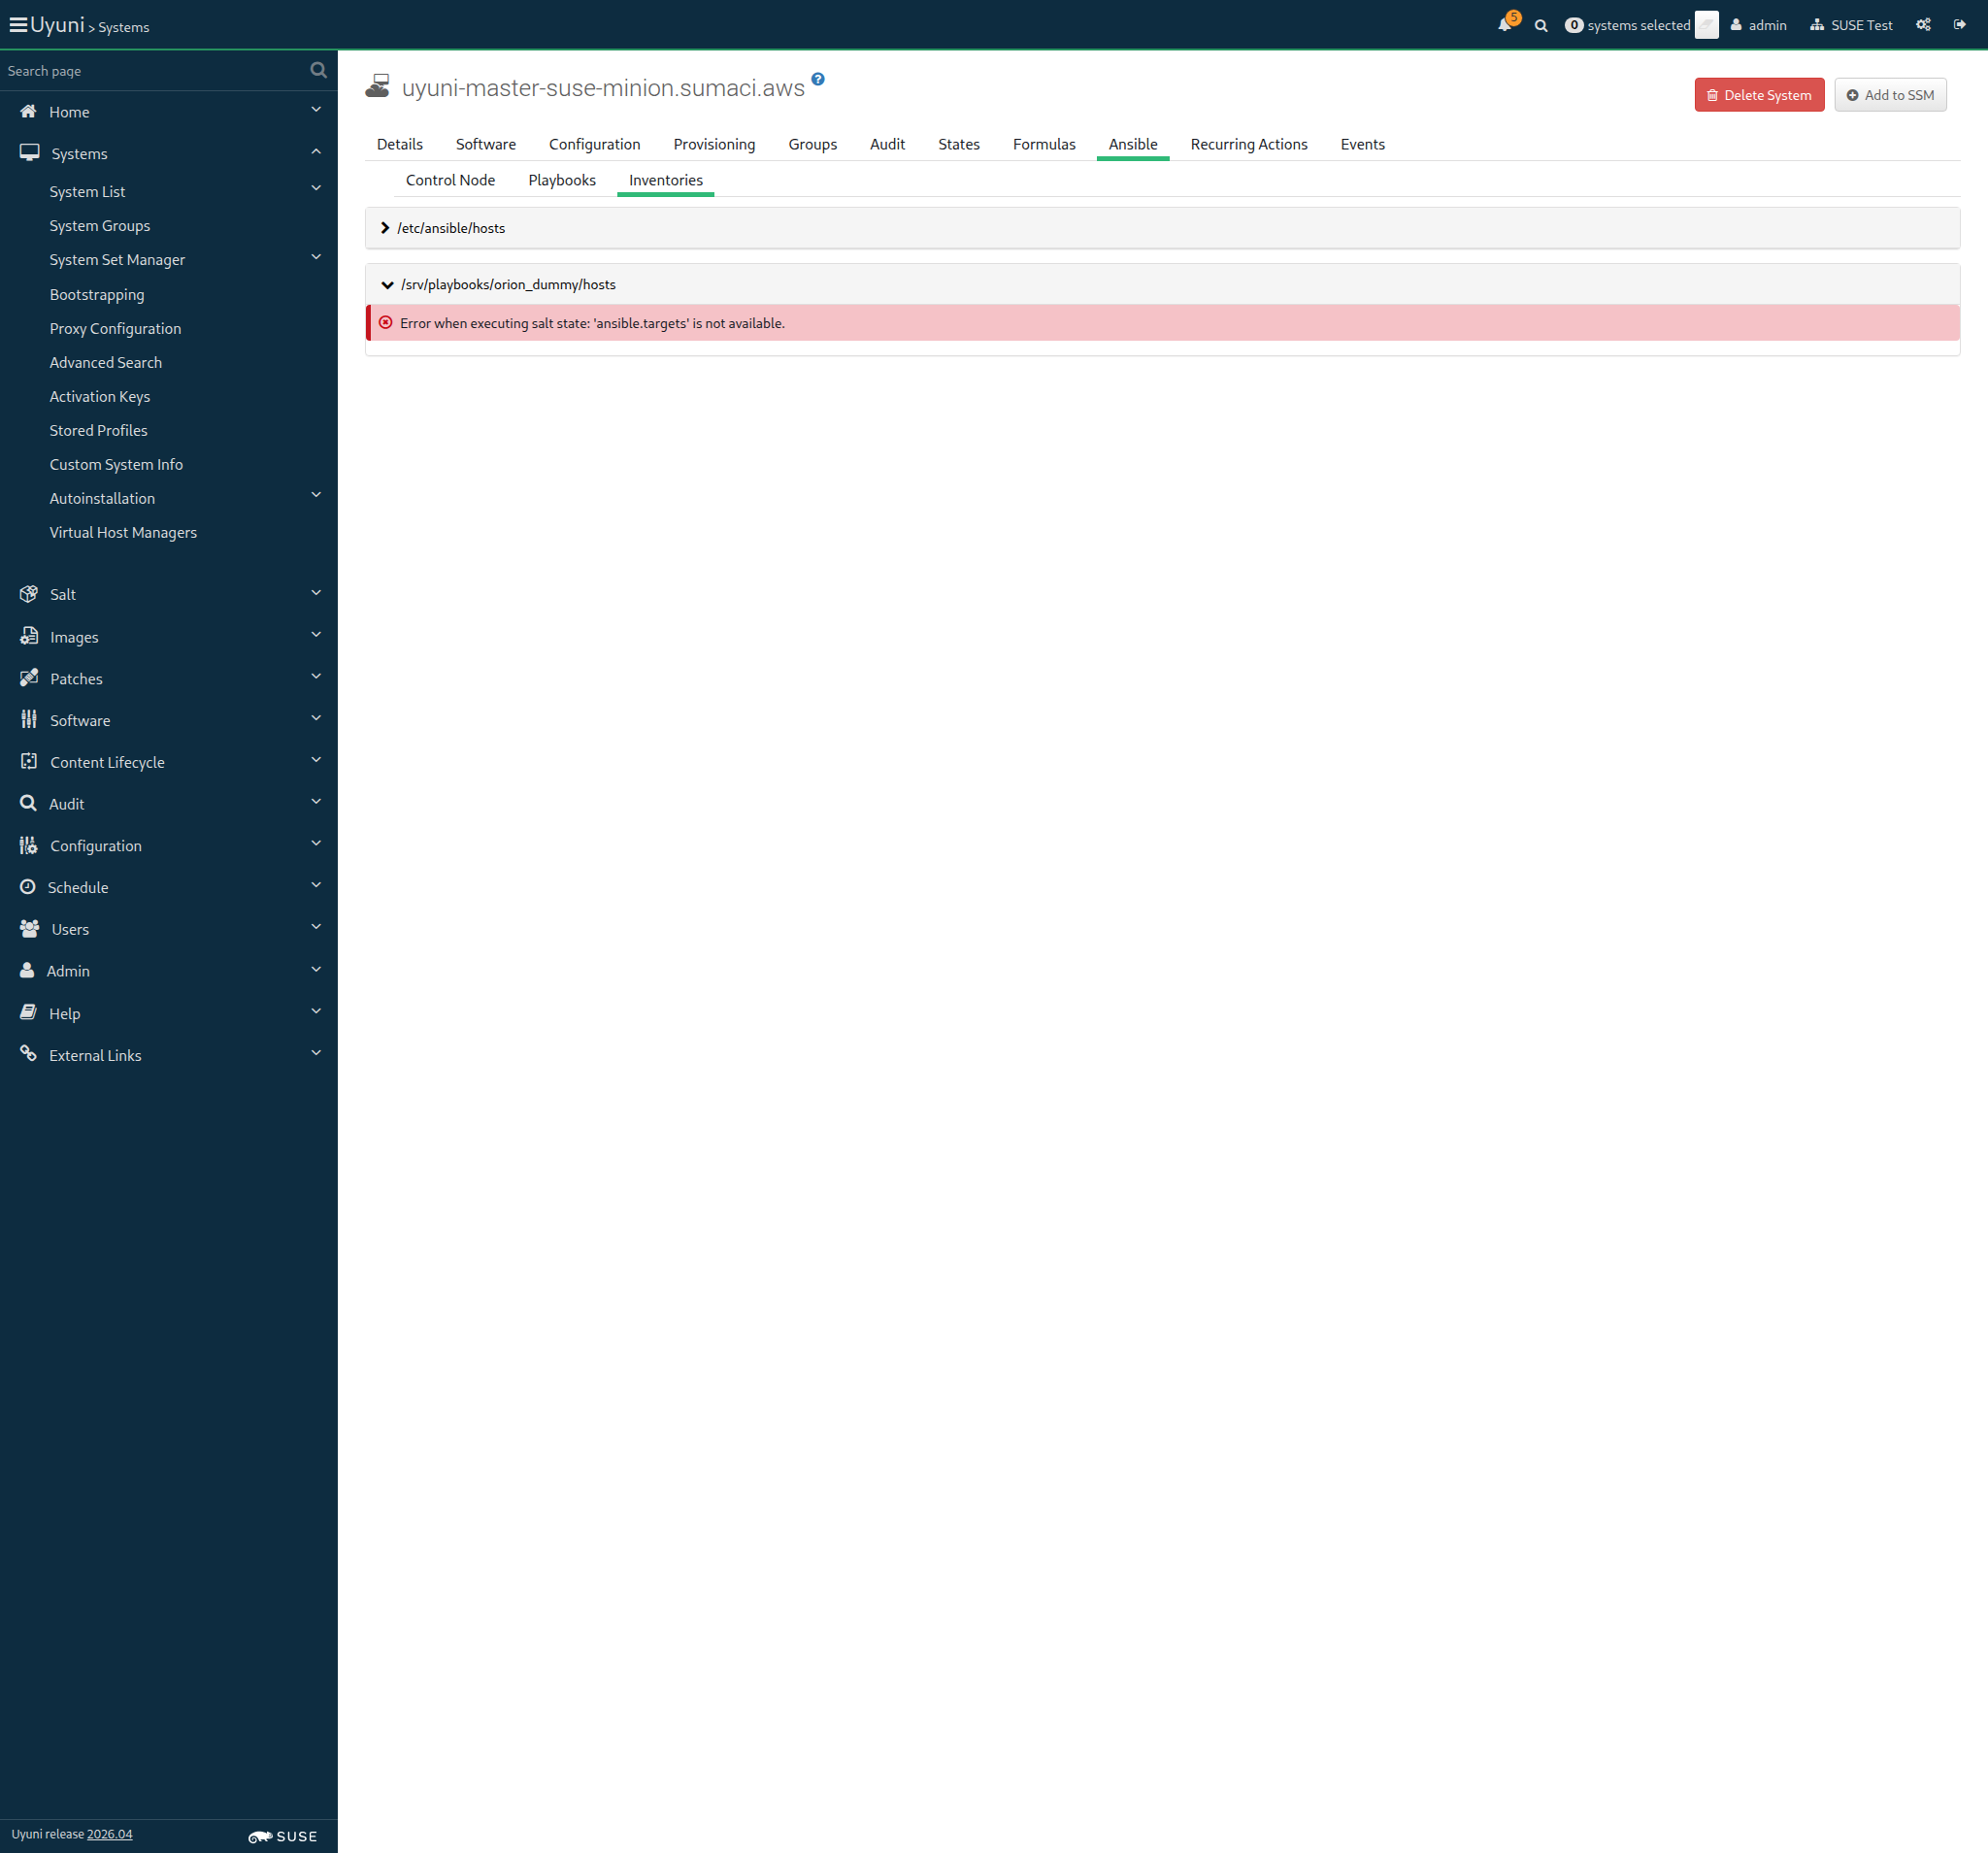
Screenshot +


Given I am on the Systems overview page of this "sle_minion" 1s 94ms

When I follow "Ansible" in the content area 80ms

And I follow "Playbooks" in the content area 68ms

And I wait until I see "/srv/playbooks" text 253ms

And I click on "/srv/playbooks" 60ms

Then I wait until I see "/srv/playbooks/orion_dummy/playbook_orion_dummy.yml" text 4m 10s 25ms Show Error +
                                            
Text '/srv/playbooks/orion_dummy/playbook_orion_dummy.yml' not found (ScriptError) ./features/step_definitions/navigation_steps.rb:40:in `/^I wait until I see "([^"]*)" text$/' features/secondary/min_ansible_control_node.feature:71:in `I wait until I see "/srv/playbooks/orion_dummy/playbook_orion_dummy.yml" text'

And I wait until I see "/srv/playbooks/basic_tests.yml" text 0s

18s 644ms Show Info +
16:07:08:000 - 16:11:20:000 | Current URL: https://uyuni-master-server.sumaci.aws/rhn/manager/systems/details/ansible/playbooks?sid=1000010020&
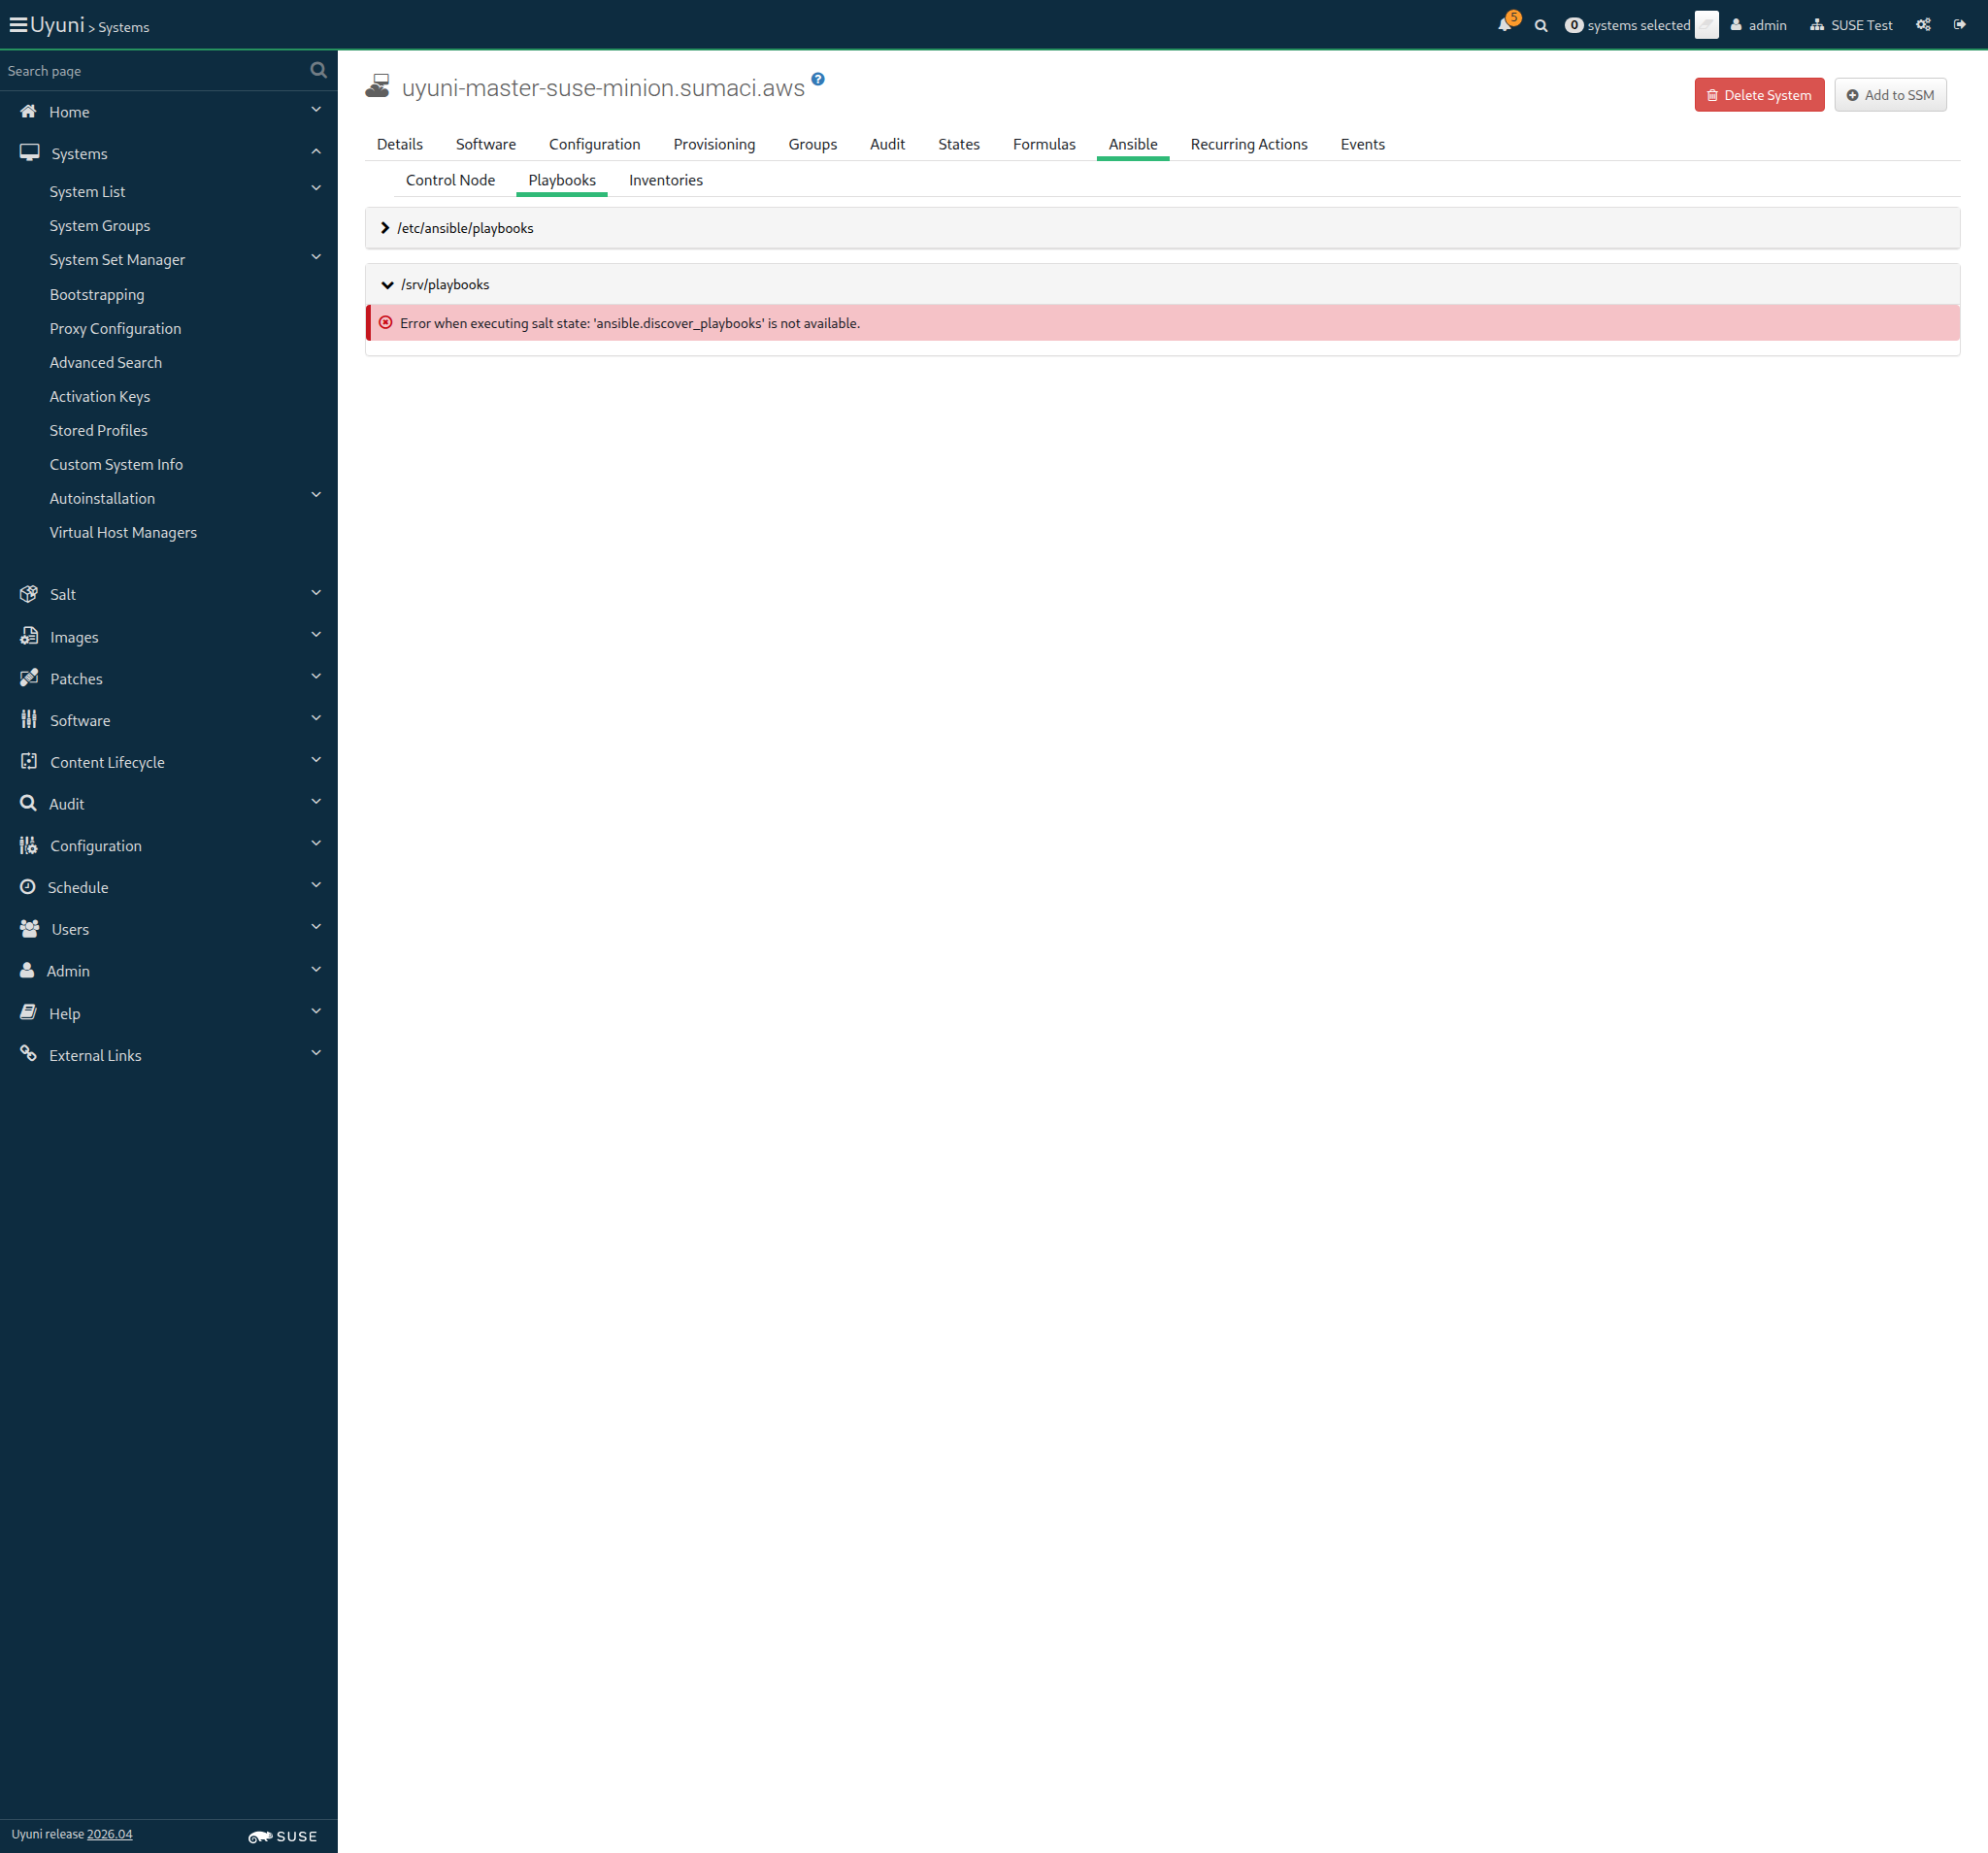
Screenshot +


Given I am on the Systems overview page of this "sle_minion" 933ms

When I follow "Ansible" in the content area 82ms

And I follow "Playbooks" in the content area 67ms

And I wait until I see "/srv/playbooks" text 250ms

And I click on "/srv/playbooks" 59ms

And I wait until I see "/srv/playbooks/orion_dummy/playbook_orion_dummy.yml" text 4m 10s 76ms Show Error +
                                            
Text '/srv/playbooks/orion_dummy/playbook_orion_dummy.yml' not found (ScriptError) ./features/step_definitions/navigation_steps.rb:40:in `/^I wait until I see "([^"]*)" text$/' features/secondary/min_ansible_control_node.feature:80:in `I wait until I see "/srv/playbooks/orion_dummy/playbook_orion_dummy.yml" text'

And I click on "orion_dummy/playbook_orion_dummy.yml" 0s

And I wait until I see "Playbook Content" text 0s

And I select "/srv/playbooks/orion_dummy/hosts" from "inventory-path-select" 0s

And I click on "Schedule" 0s

Then I should see a "Playbook execution has been scheduled" text 0s

And I wait until event "Execute playbook 'playbook_orion_dummy.yml' scheduled" is completed 0s

And file "/tmp/file.txt" should exist on "sle_minion" 0s

18s 556ms Show Info +
16:11:39:000 - 16:15:51:000 | Current URL: https://uyuni-master-server.sumaci.aws/rhn/manager/systems/details/ansible/playbooks?sid=1000010020&
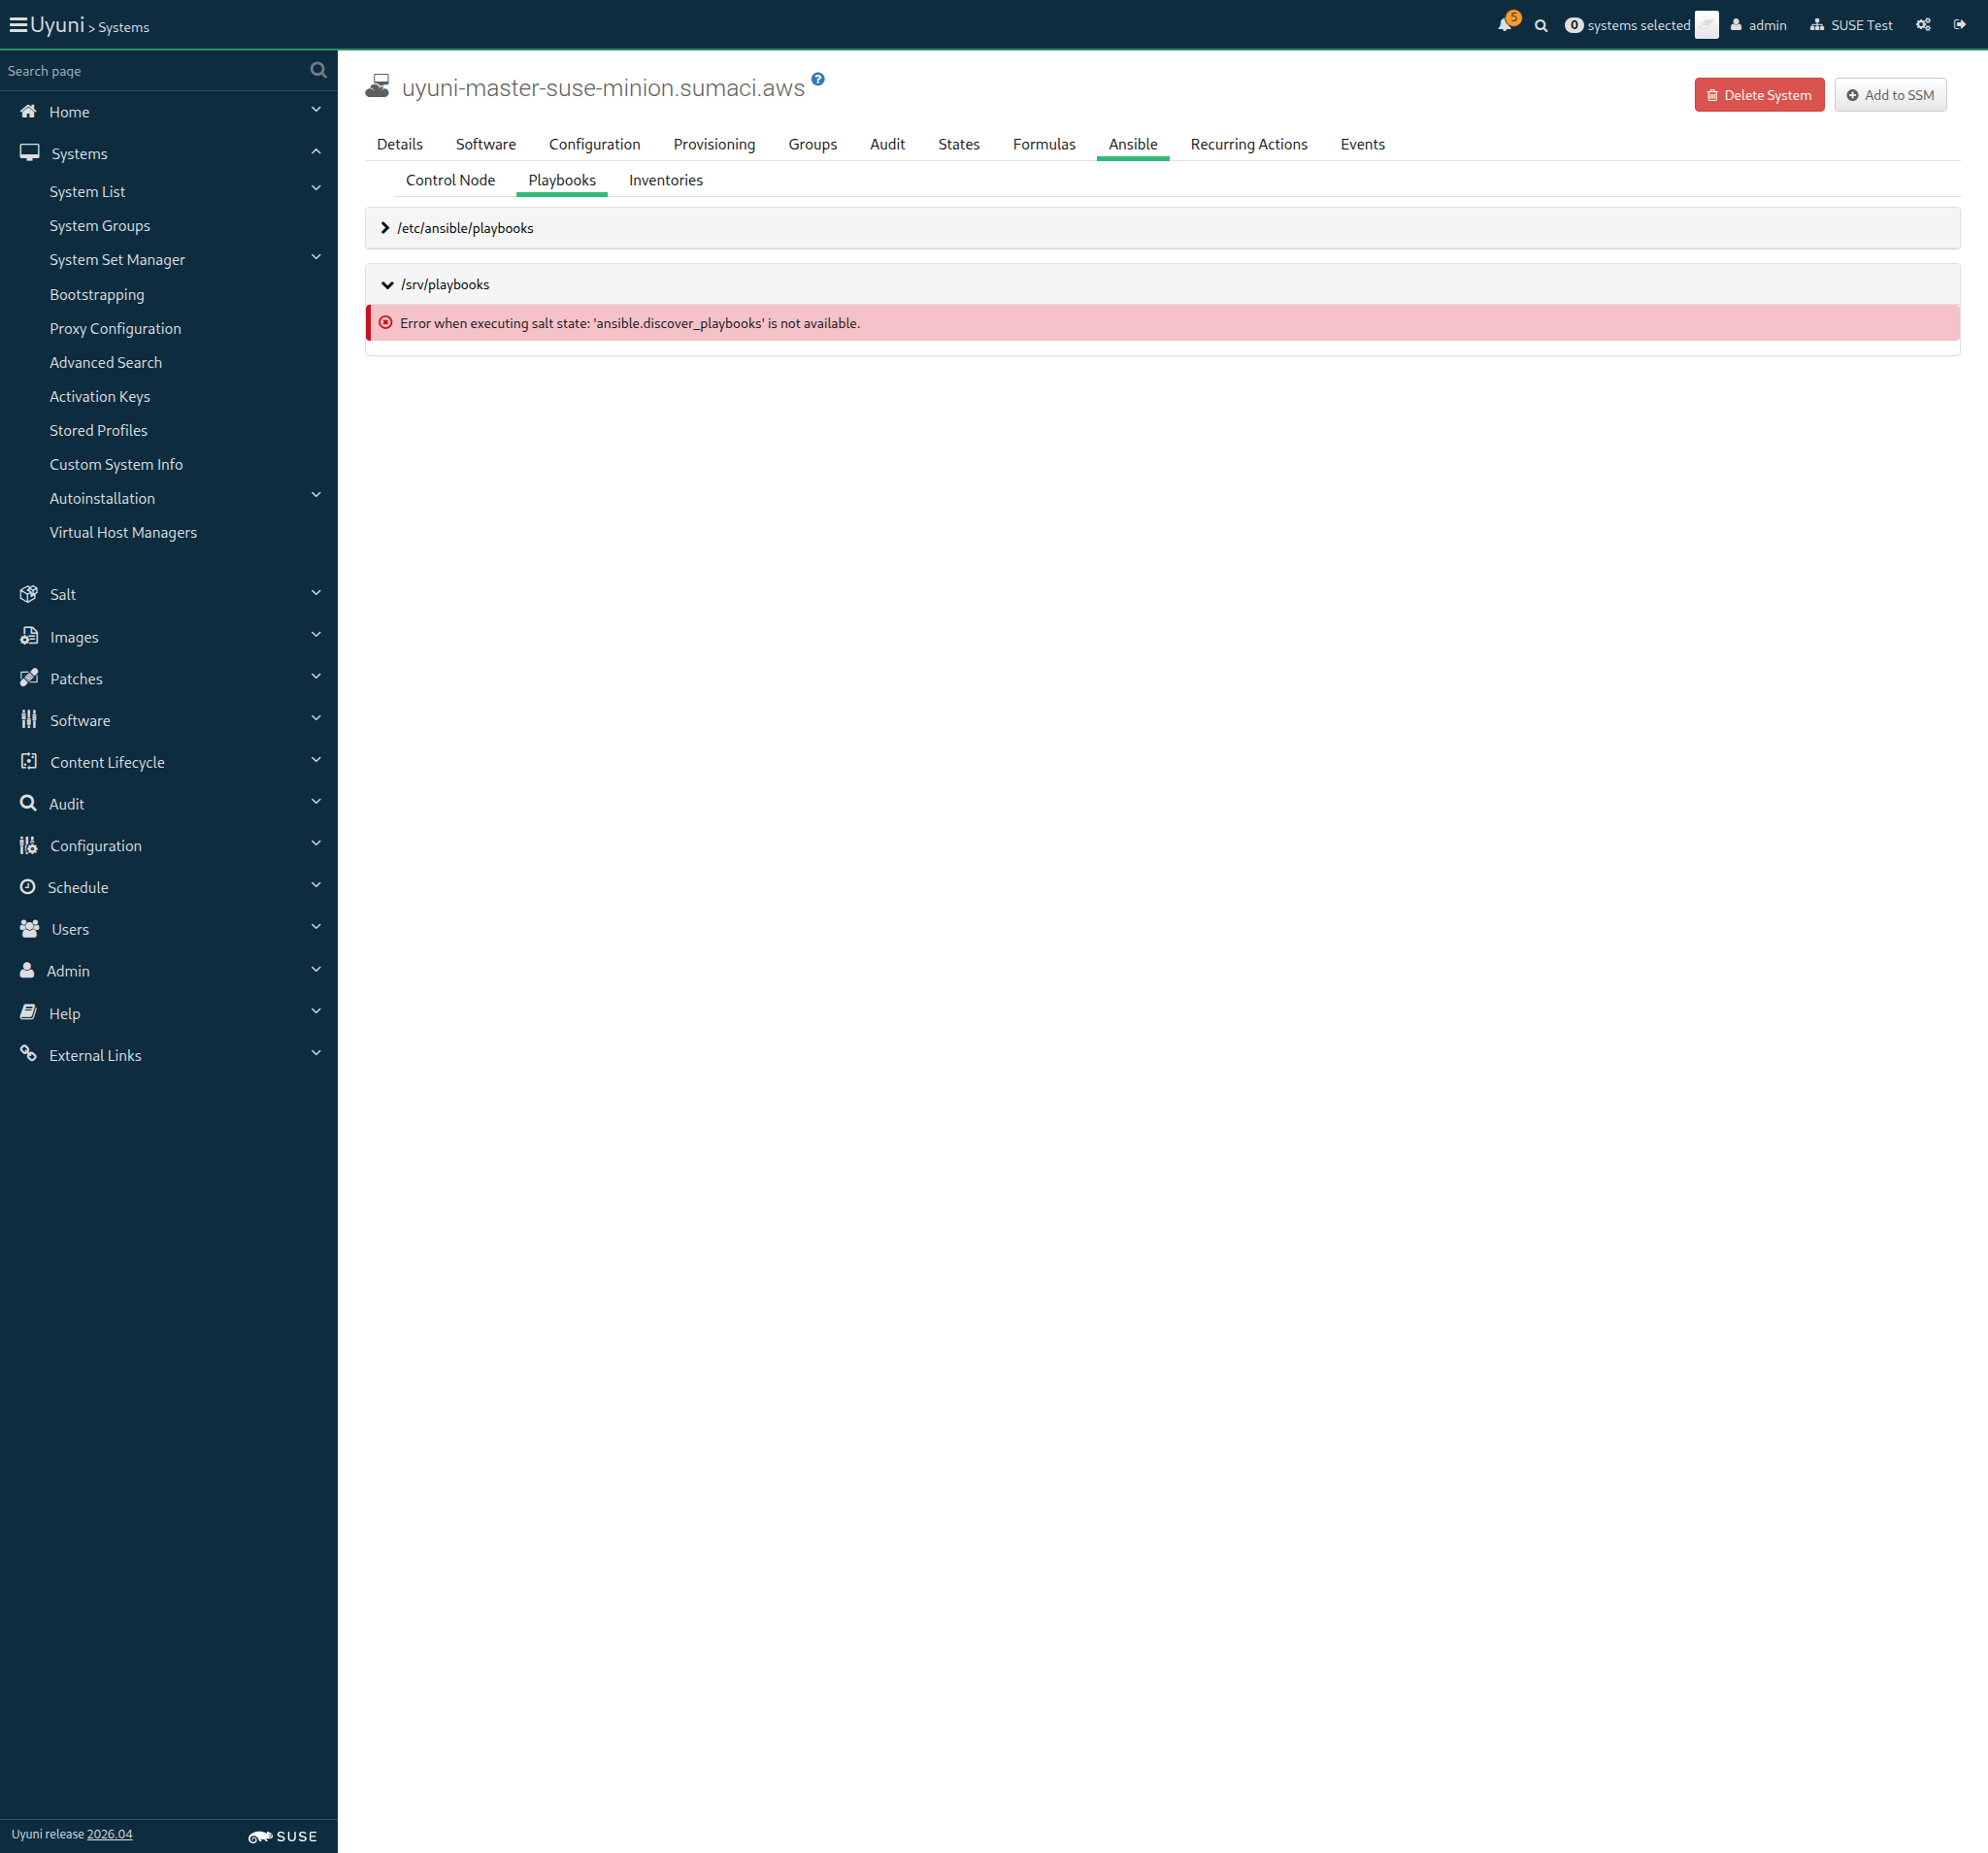
Screenshot +


Given I am on the Systems overview page of this "sle_minion" 963ms

When I follow "Ansible" in the content area 83ms

And I follow "Playbooks" in the content area 66ms

And I wait until I see "/srv/playbooks" text 241ms

And I click on "/srv/playbooks" 72ms

And I wait until I see "/srv/playbooks/basic_tests.yml" text 4m 10s 18ms Show Error +
                                            
Text '/srv/playbooks/basic_tests.yml' not found (ScriptError) ./features/step_definitions/navigation_steps.rb:40:in `/^I wait until I see "([^"]*)" text$/' features/secondary/min_ansible_control_node.feature:95:in `I wait until I see "/srv/playbooks/basic_tests.yml" text'

And I click on "basic_tests.yml" 0s

And I wait until I see "Playbook Content" text 0s

And I click on "Schedule" 0s

And I wait until I see "Playbook execution has been scheduled" text 0s

And I wait for "2" seconds 0s

And I follow "scheduled" in the content area 0s

Then I wait until I see "1 system successfully completed this action" text or "1 system failed to complete this action" text, refreshing the page 0s

When I follow "1 system" 0s

And I wait until I see the system name of "sle_minion" 0s

And I follow this "sle_minion" link 0s

Then I should see a "42" text 0s

And I should see a "101010" text 0s

And I should see a "(code 0)" text 0s

18s 292ms Show Info +
16:16:10:000 - 16:20:22:000 | Current URL: https://uyuni-master-server.sumaci.aws/rhn/manager/systems/details/ansible/playbooks?sid=1000010020&
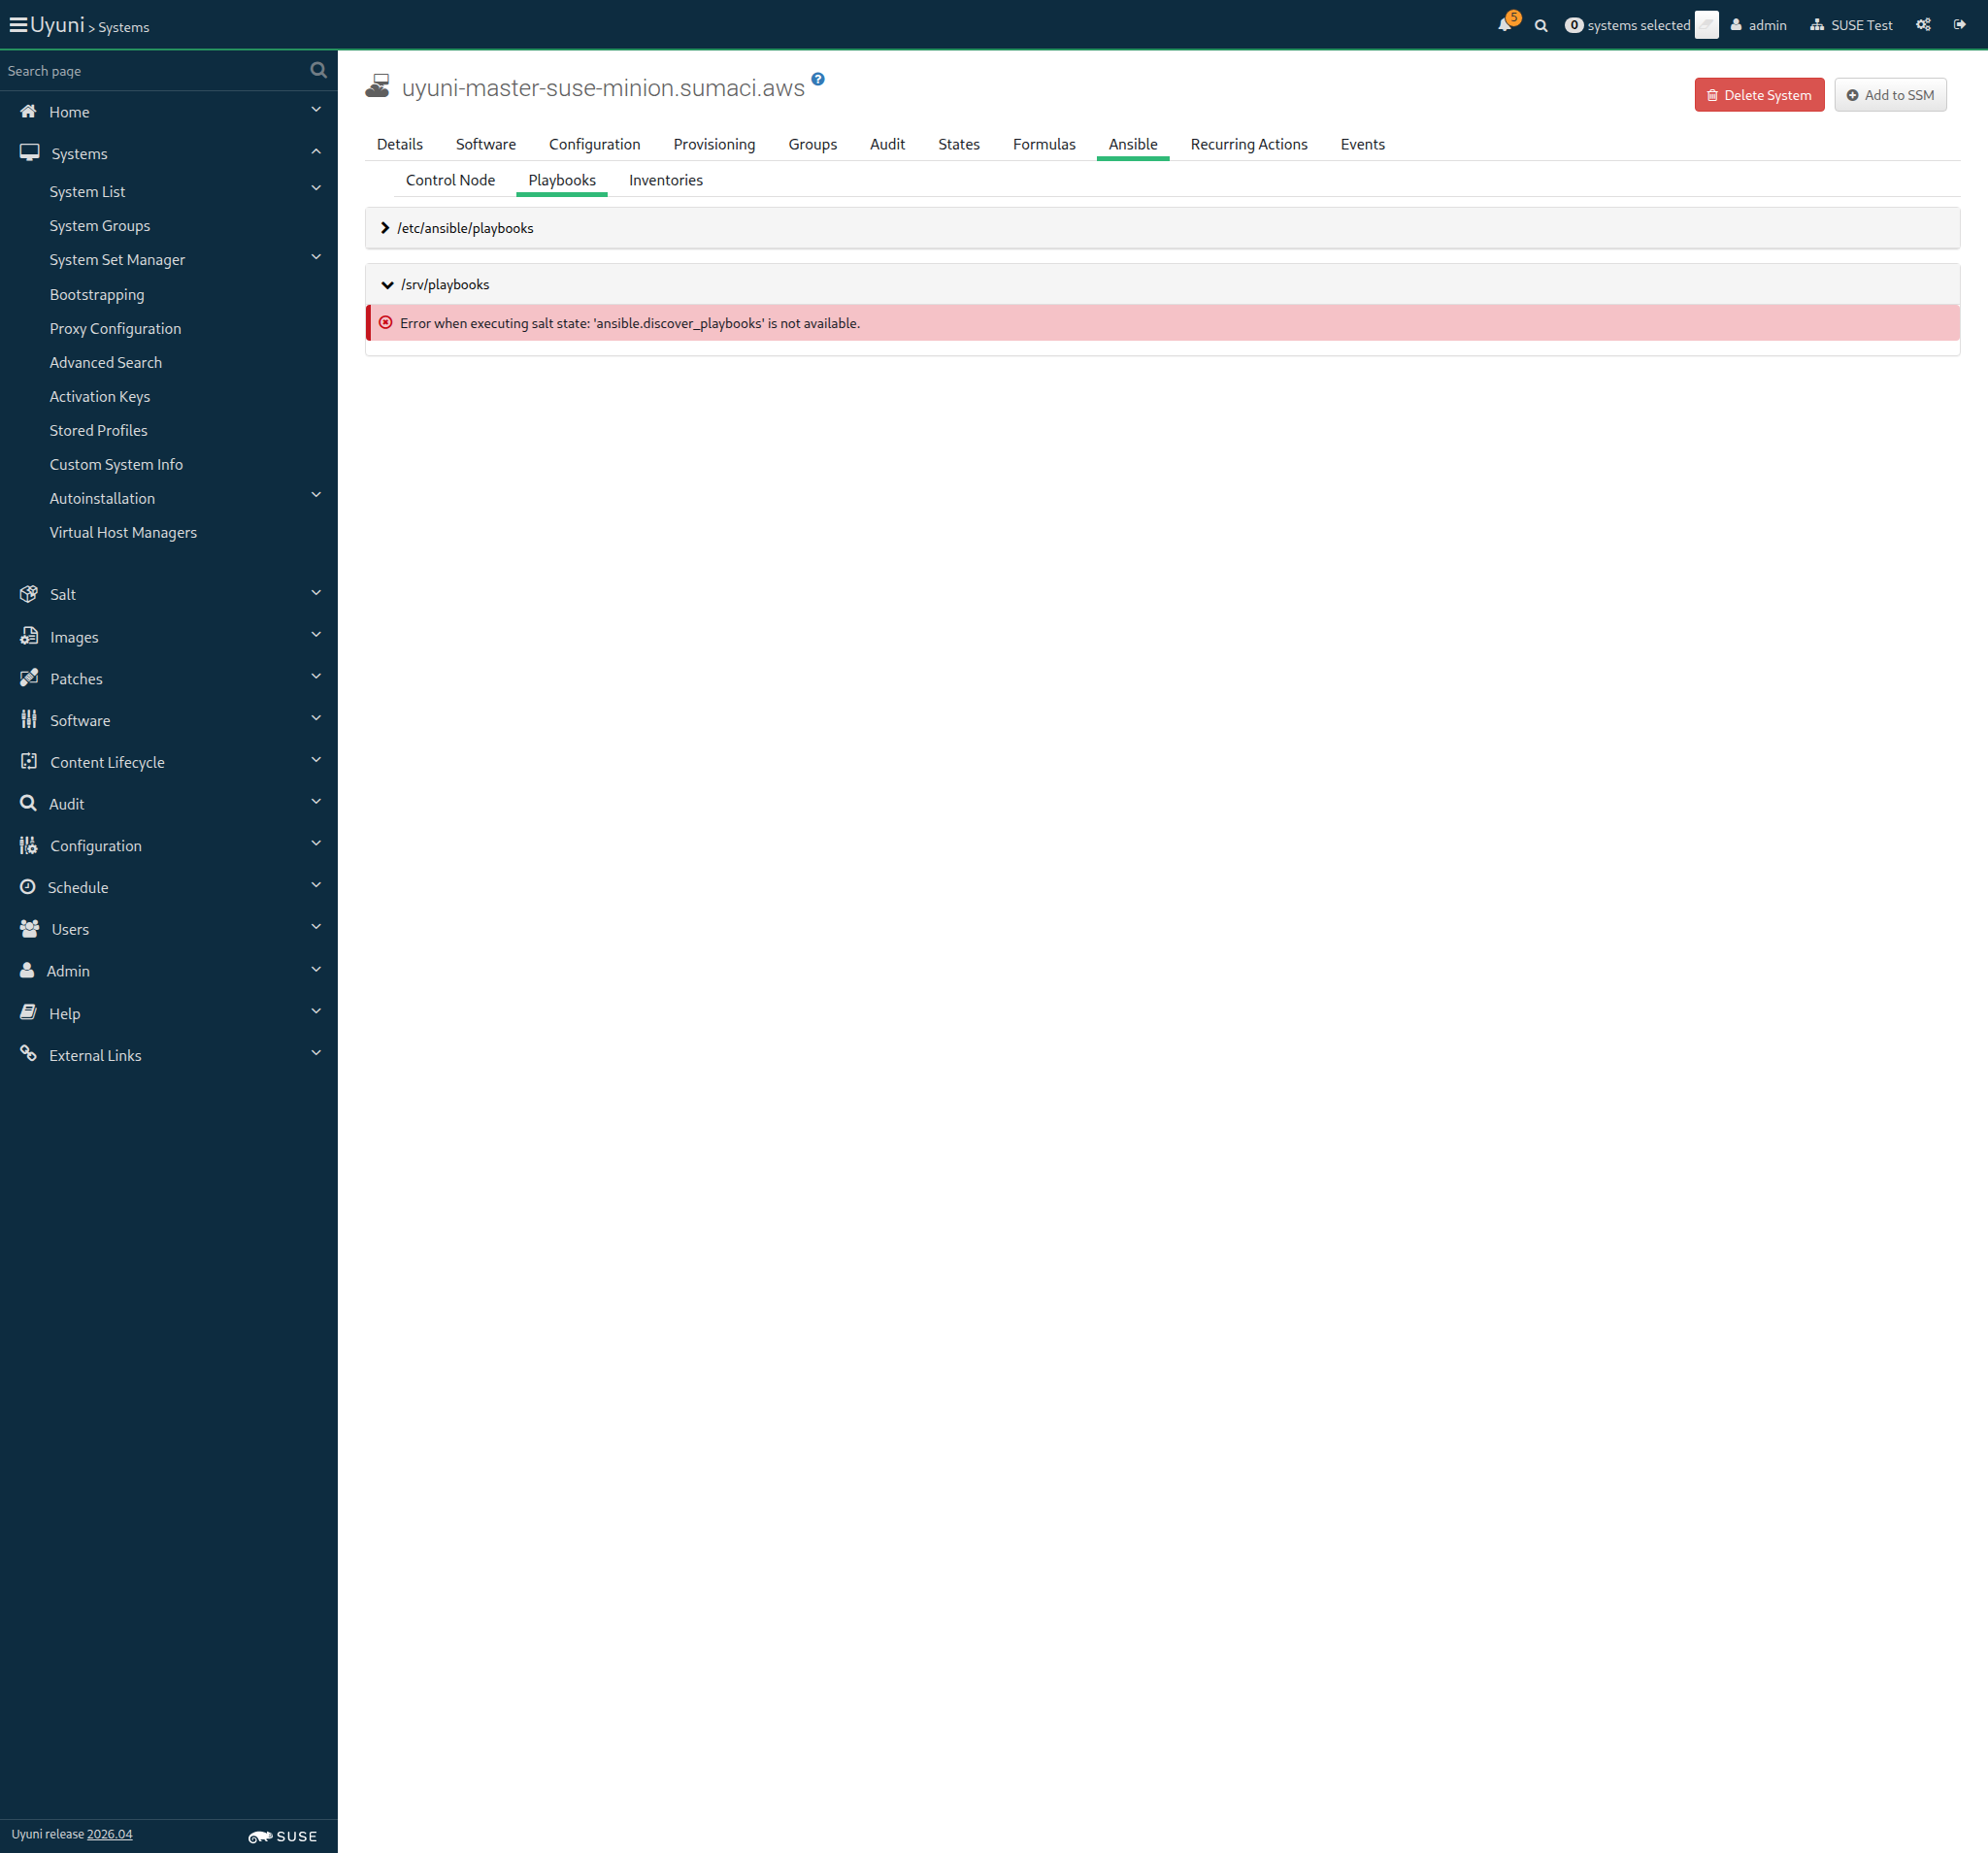
Screenshot +


Given I am on the Systems overview page of this "sle_minion" 1s 328ms

When I follow "Ansible" in the content area 84ms

And I follow "Playbooks" in the content area 69ms

And I wait until I see "/srv/playbooks" text 358ms

And I click on "/srv/playbooks" 60ms

And I wait until I see "/srv/playbooks/basic_tests.yml" text 4m 10s 23ms Show Error +
                                            
Text '/srv/playbooks/basic_tests.yml' not found (ScriptError) ./features/step_definitions/navigation_steps.rb:40:in `/^I wait until I see "([^"]*)" text$/' features/secondary/min_ansible_control_node.feature:116:in `I wait until I see "/srv/playbooks/basic_tests.yml" text'

And I click on "basic_tests.yml" 0s

And I wait until I see "Playbook Content" text 0s

And I click on "Edit variables" 0s

And I enter data from table with value as field name 0s
(21 + 21) * 100 p1
p2
p3
p4
p5

And I click on "Save" 0s

And I click on "Schedule" 0s

And I wait until I see "Playbook execution has been scheduled" text 0s

And I wait for "2" seconds 0s

And I follow "scheduled" in the content area 0s

Then I wait until I see "1 system successfully completed this action" text or "1 system failed to complete this action" text, refreshing the page 0s

When I follow "1 system" 0s

And I wait until I see the system name of "sle_minion" 0s

And I follow this "sle_minion" link 0s

Then I should see a "4200" text 0s

And I should see a "(code 0)" text 0s

20s 308ms Show Info +
16:20:41:000 - 16:24:54:000 | Current URL: https://uyuni-master-server.sumaci.aws/rhn/manager/systems/details/ansible/playbooks?sid=1000010020&
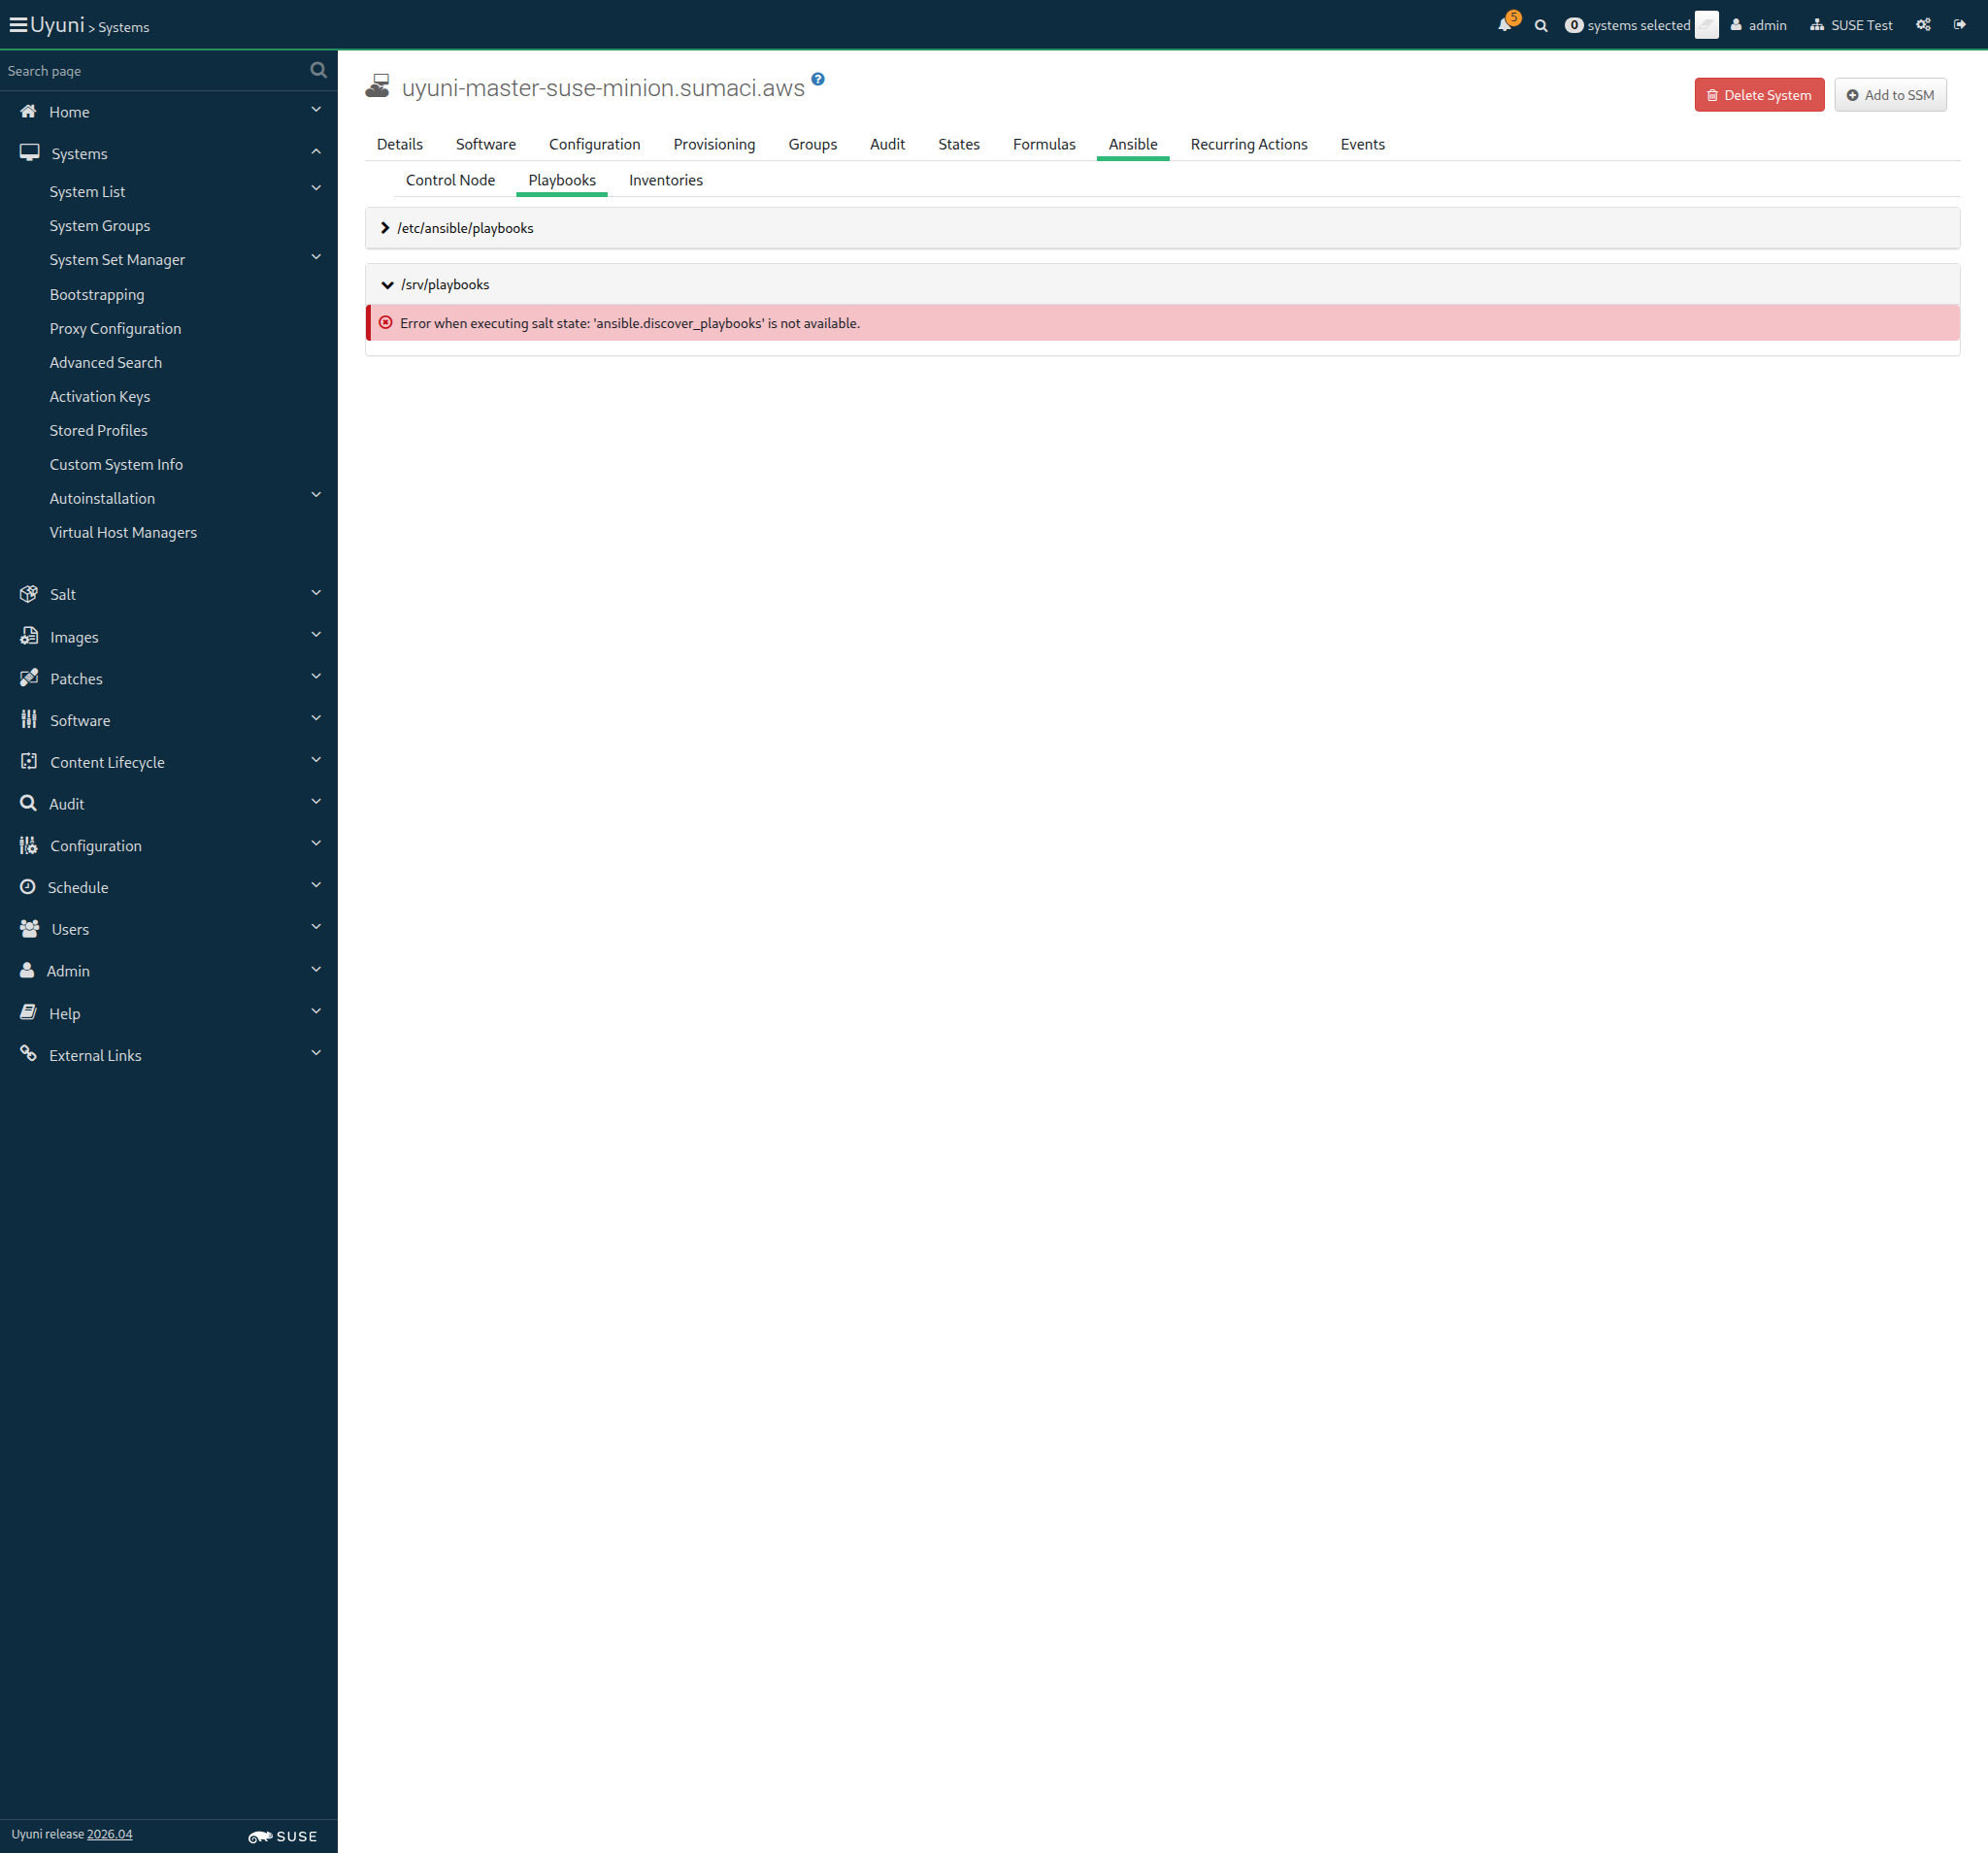
Screenshot +


Given I am on the Systems overview page of this "sle_minion" 1s 43ms

When I follow "Ansible" in the content area 80ms

And I follow "Playbooks" in the content area 68ms

And I wait until I see "/srv/playbooks" text 247ms

And I click on "/srv/playbooks" 60ms

And I wait until I see "/srv/playbooks/basic_tests.yml" text 4m 10s 67ms Show Error +
                                            
Text '/srv/playbooks/basic_tests.yml' not found (ScriptError) ./features/step_definitions/navigation_steps.rb:40:in `/^I wait until I see "([^"]*)" text$/' features/secondary/min_ansible_control_node.feature:144:in `I wait until I see "/srv/playbooks/basic_tests.yml" text'

And I click on "basic_tests.yml" 0s

And I wait until I see "Playbook Content" text 0s

And I click on "Edit variables" 0s

And I enter data from table with value as field name 0s
1 p1
2 p2
3 p3
4 p4
5 p5
(21 + 21) * 1000 p1_empty
(21 + 21) * 100 + (21 + 21) p2_empty

And I click on "Save" 0s

And I click on "Schedule" 0s

And I wait until I see "Playbook execution has been scheduled" text 0s

And I wait for "2" seconds 0s

And I follow "scheduled" in the content area 0s

Then I wait until I see "1 system successfully completed this action" text or "1 system failed to complete this action" text, refreshing the page 0s

When I follow "1 system" 0s

And I wait until I see the system name of "sle_minion" 0s

And I follow this "sle_minion" link 0s

Then I should see a "42000" text 0s

And I should see a "4242" text 0s

And I should see a "(code 0)" text 0s

20s 635ms Show Info +
16:25:14:000 - 16:29:26:000 | Current URL: https://uyuni-master-server.sumaci.aws/rhn/manager/systems/details/ansible/playbooks?sid=1000010020&
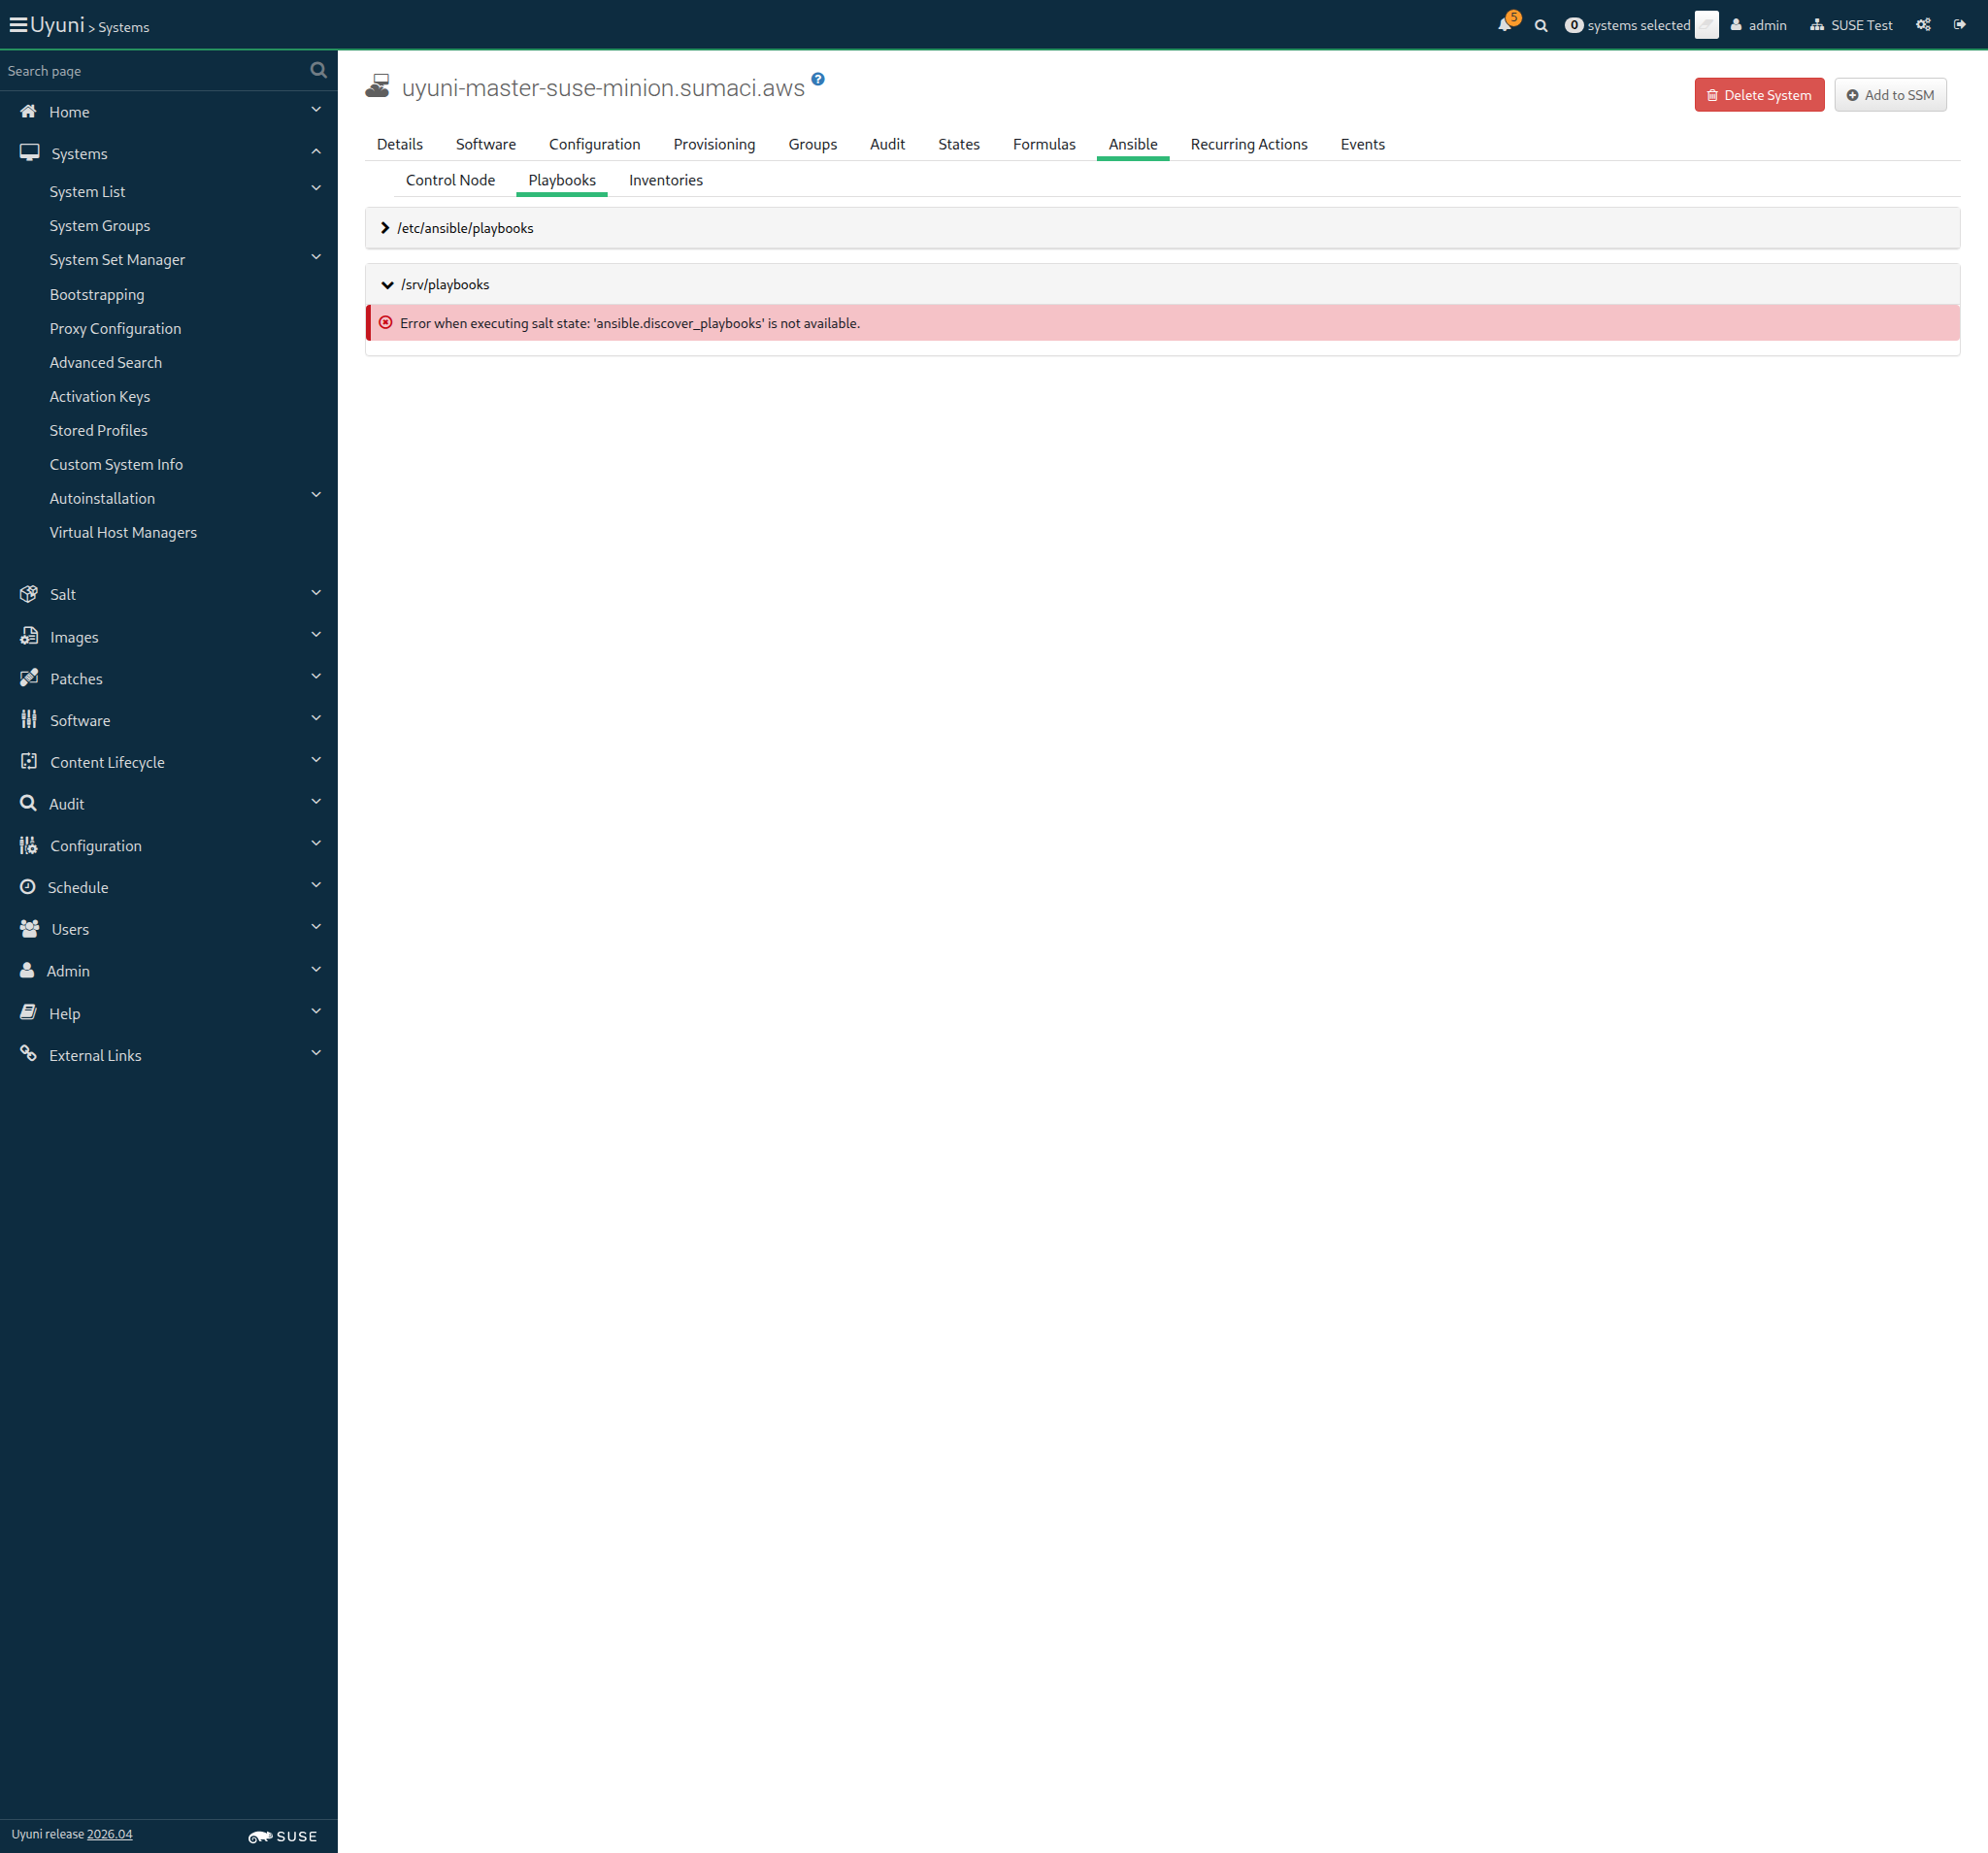
Screenshot +


Given I am on the Systems overview page of this "sle_minion" 987ms

When I follow "Ansible" in the content area 86ms

And I follow "Playbooks" in the content area 74ms

And I wait until I see "/srv/playbooks" text 252ms

And I click on "/srv/playbooks" 60ms

And I wait until I see "/srv/playbooks/basic_tests.yml" text 4m 10s 7ms Show Error +
                                            
Text '/srv/playbooks/basic_tests.yml' not found (ScriptError) ./features/step_definitions/navigation_steps.rb:40:in `/^I wait until I see "([^"]*)" text$/' features/secondary/min_ansible_control_node.feature:176:in `I wait until I see "/srv/playbooks/basic_tests.yml" text'

And I click on "basic_tests.yml" 0s

And I wait until I see "Playbook Content" text 0s

And I click on "Edit variables" 0s

And I enter data from table with value as field name 0s
1 p1
2 p2
3 p3
4 p4
5 p5
1e p1_empty
2e p2_empty
256 * 256 p_null

And I click on "Save" 0s

And I click on "Schedule" 0s

And I wait until I see "Playbook execution has been scheduled" text 0s

And I wait for "2" seconds 0s

And I follow "scheduled" in the content area 0s

Then I wait until I see "1 system successfully completed this action" text or "1 system failed to complete this action" text, refreshing the page 0s

When I follow "1 system" 0s

And I wait until I see the system name of "sle_minion" 0s

And I follow this "sle_minion" link 0s

Then I should see a "65536" text 0s

And I should see a "(code 0)" text 0s

19s 229ms Show Info +
16:29:47:000 - 16:33:59:000 | Current URL: https://uyuni-master-server.sumaci.aws/rhn/manager/systems/details/ansible/playbooks?sid=1000010020&
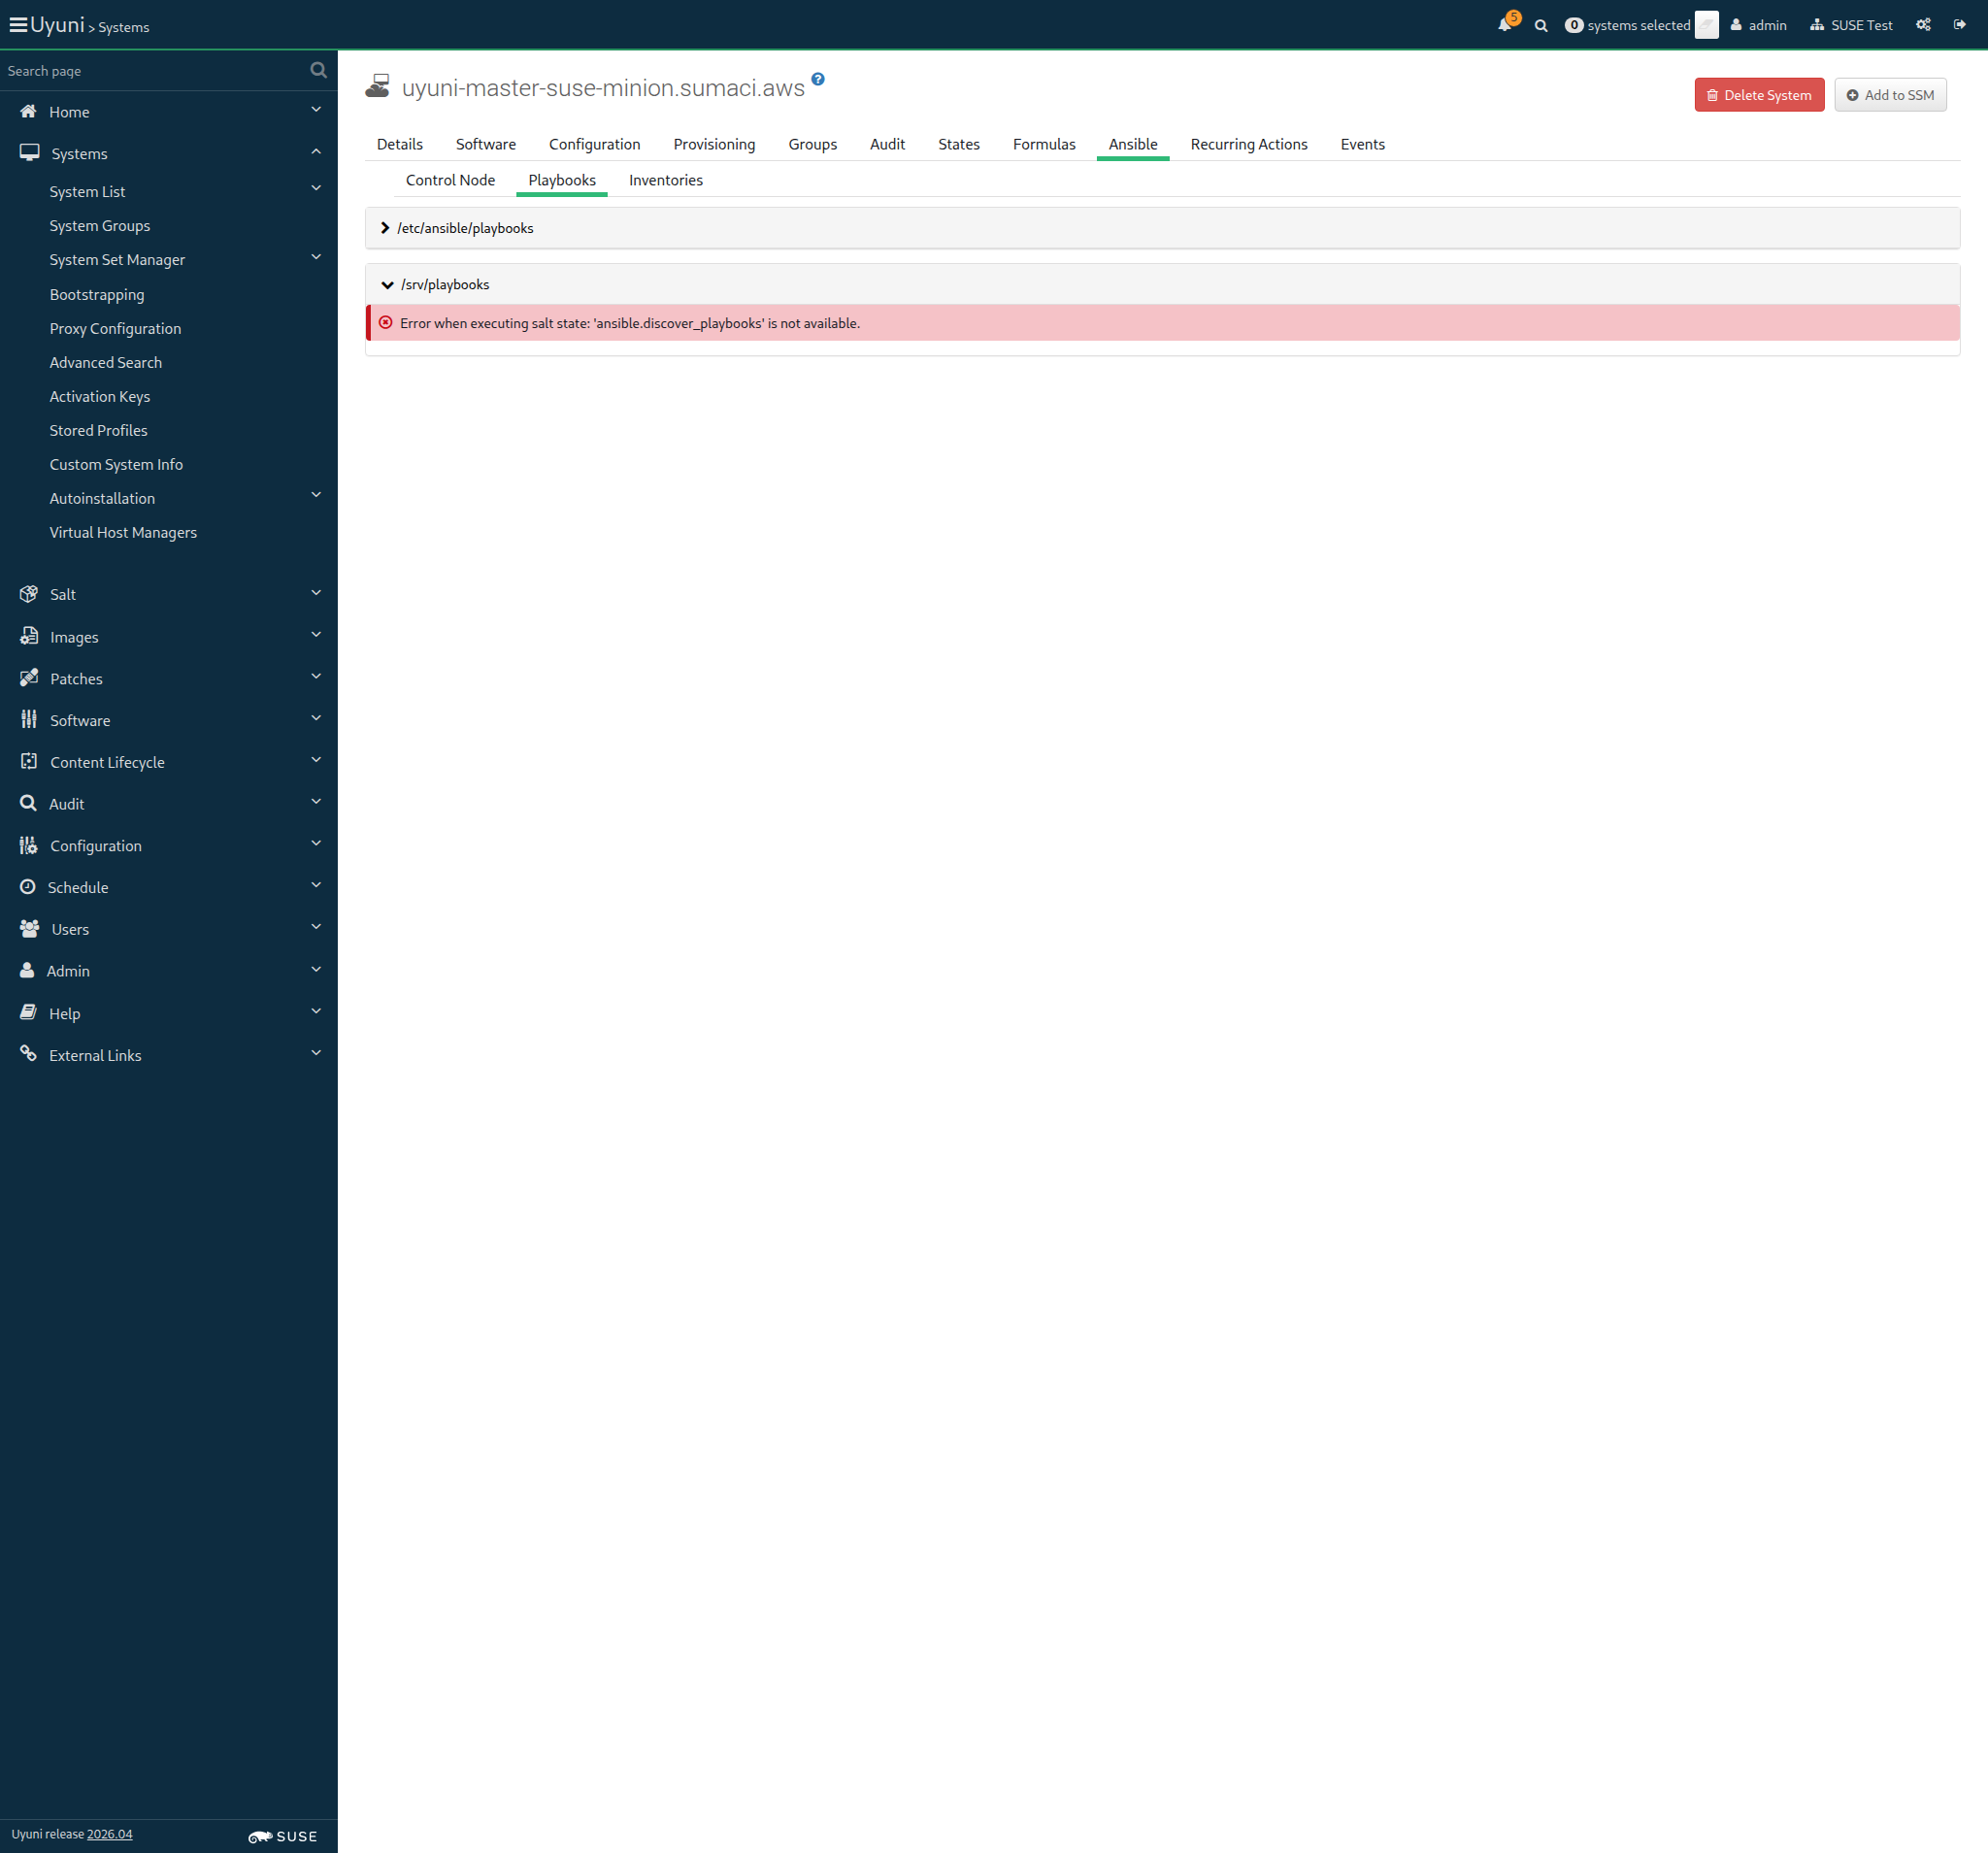
Screenshot +


Given I am on the Systems overview page of this "sle_minion" 888ms

When I follow "Ansible" in the content area 79ms

And I follow "Playbooks" in the content area 70ms

And I wait until I see "/srv/playbooks" text 253ms

And I click on "/srv/playbooks" 61ms

And I wait until I see "/srv/playbooks/basic_tests.yml" text 4m 10s 74ms Show Error +
                                            
Text '/srv/playbooks/basic_tests.yml' not found (ScriptError) ./features/step_definitions/navigation_steps.rb:40:in `/^I wait until I see "([^"]*)" text$/' features/secondary/min_ansible_control_node.feature:208:in `I wait until I see "/srv/playbooks/basic_tests.yml" text'

And I click on "basic_tests.yml" 0s

And I wait until I see "Playbook Content" text 0s

And I click on "Edit variables" 0s

And I click on "Edit YAML" 0s

And I click on "Save" 0s

And I click on "Schedule" 0s

And I wait until I see "Playbook execution has been scheduled" text 0s

And I wait for "2" seconds 0s

And I follow "scheduled" in the content area 0s

Then I wait until I see "1 system successfully completed this action" text or "1 system failed to complete this action" text, refreshing the page 0s

When I follow "1 system" 0s

And I wait until I see the system name of "sle_minion" 0s

And I follow this "sle_minion" link 0s

Then I should see a "42" text 0s

And I should see a "101010" text 0s

And I should see a "(code 0)" text 0s

18s 781ms Show Info +
16:34:19:000 - 16:38:31:000 | Current URL: https://uyuni-master-server.sumaci.aws/rhn/manager/systems/details/ansible/playbooks?sid=1000010020&
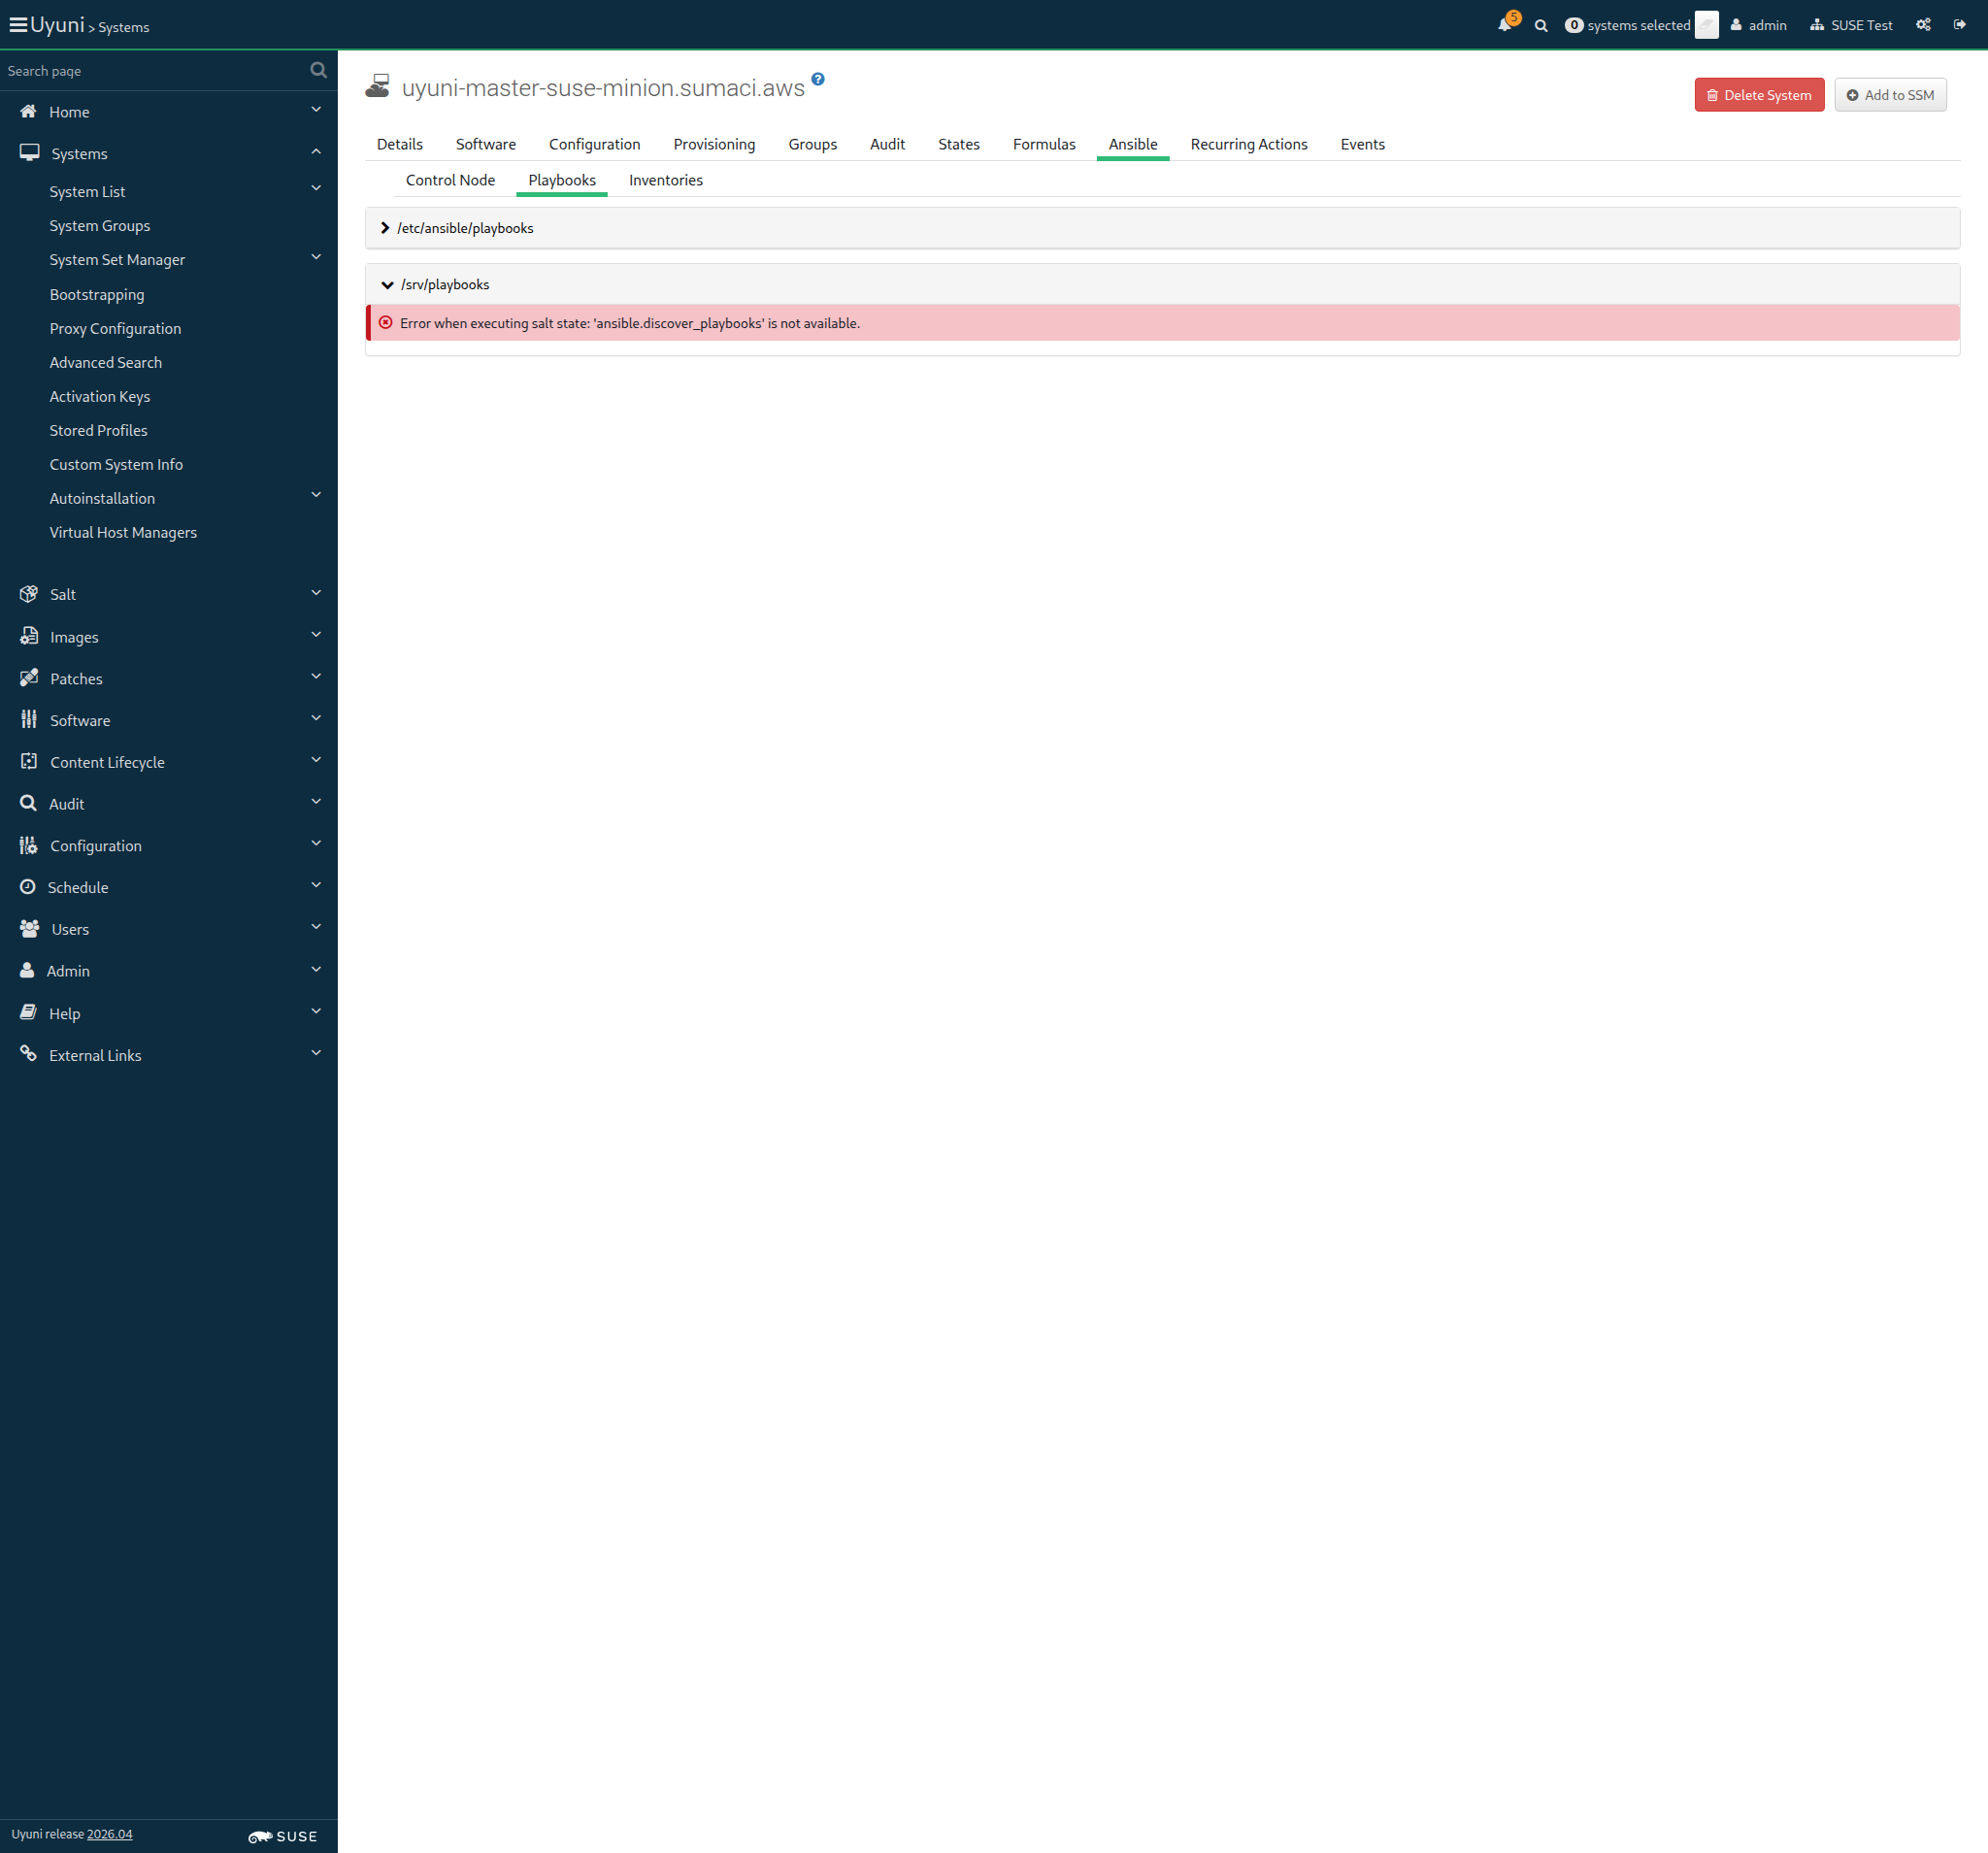
Screenshot +


Given I am on the Systems overview page of this "sle_minion" 946ms

When I follow "Ansible" in the content area 80ms

And I follow "Playbooks" in the content area 70ms

And I wait until I see "/srv/playbooks" text 158ms

And I click on "/srv/playbooks" 63ms

And I wait until I see "/srv/playbooks/basic_tests.yml" text 4m 10s 30ms Show Error +
                                            
Text '/srv/playbooks/basic_tests.yml' not found (ScriptError) ./features/step_definitions/navigation_steps.rb:40:in `/^I wait until I see "([^"]*)" text$/' features/secondary/min_ansible_control_node.feature:232:in `I wait until I see "/srv/playbooks/basic_tests.yml" text'

And I click on "basic_tests.yml" 0s

And I wait until I see "Playbook Content" text 0s

And I click on "Edit variables" 0s

And I enter data from table with value as field name 0s
abc p1
def p2
ghi p3
jkl p4
16 * 16 * 16 p5

And I click on "Edit YAML" 0s

And I click on "Save" 0s

And I click on "Schedule" 0s

And I wait until I see "Playbook execution has been scheduled" text 0s

And I wait for "2" seconds 0s

And I follow "scheduled" in the content area 0s

Then I wait until I see "1 system successfully completed this action" text or "1 system failed to complete this action" text, refreshing the page 0s

When I follow "1 system" 0s

And I wait until I see the system name of "sle_minion" 0s

And I follow this "sle_minion" link 0s

Then I should see a "abc" text 0s

And I should see a "def" text 0s

And I should see a "ghi" text 0s

And I should see a "jkl" text 0s

And I should see a "4096" text 0s

And I should see a "(code 0)" text 0s

18s 521ms Show Info +
16:38:50:000 - 16:43:02:000 | Current URL: https://uyuni-master-server.sumaci.aws/rhn/manager/systems/details/ansible/playbooks?sid=1000010020&
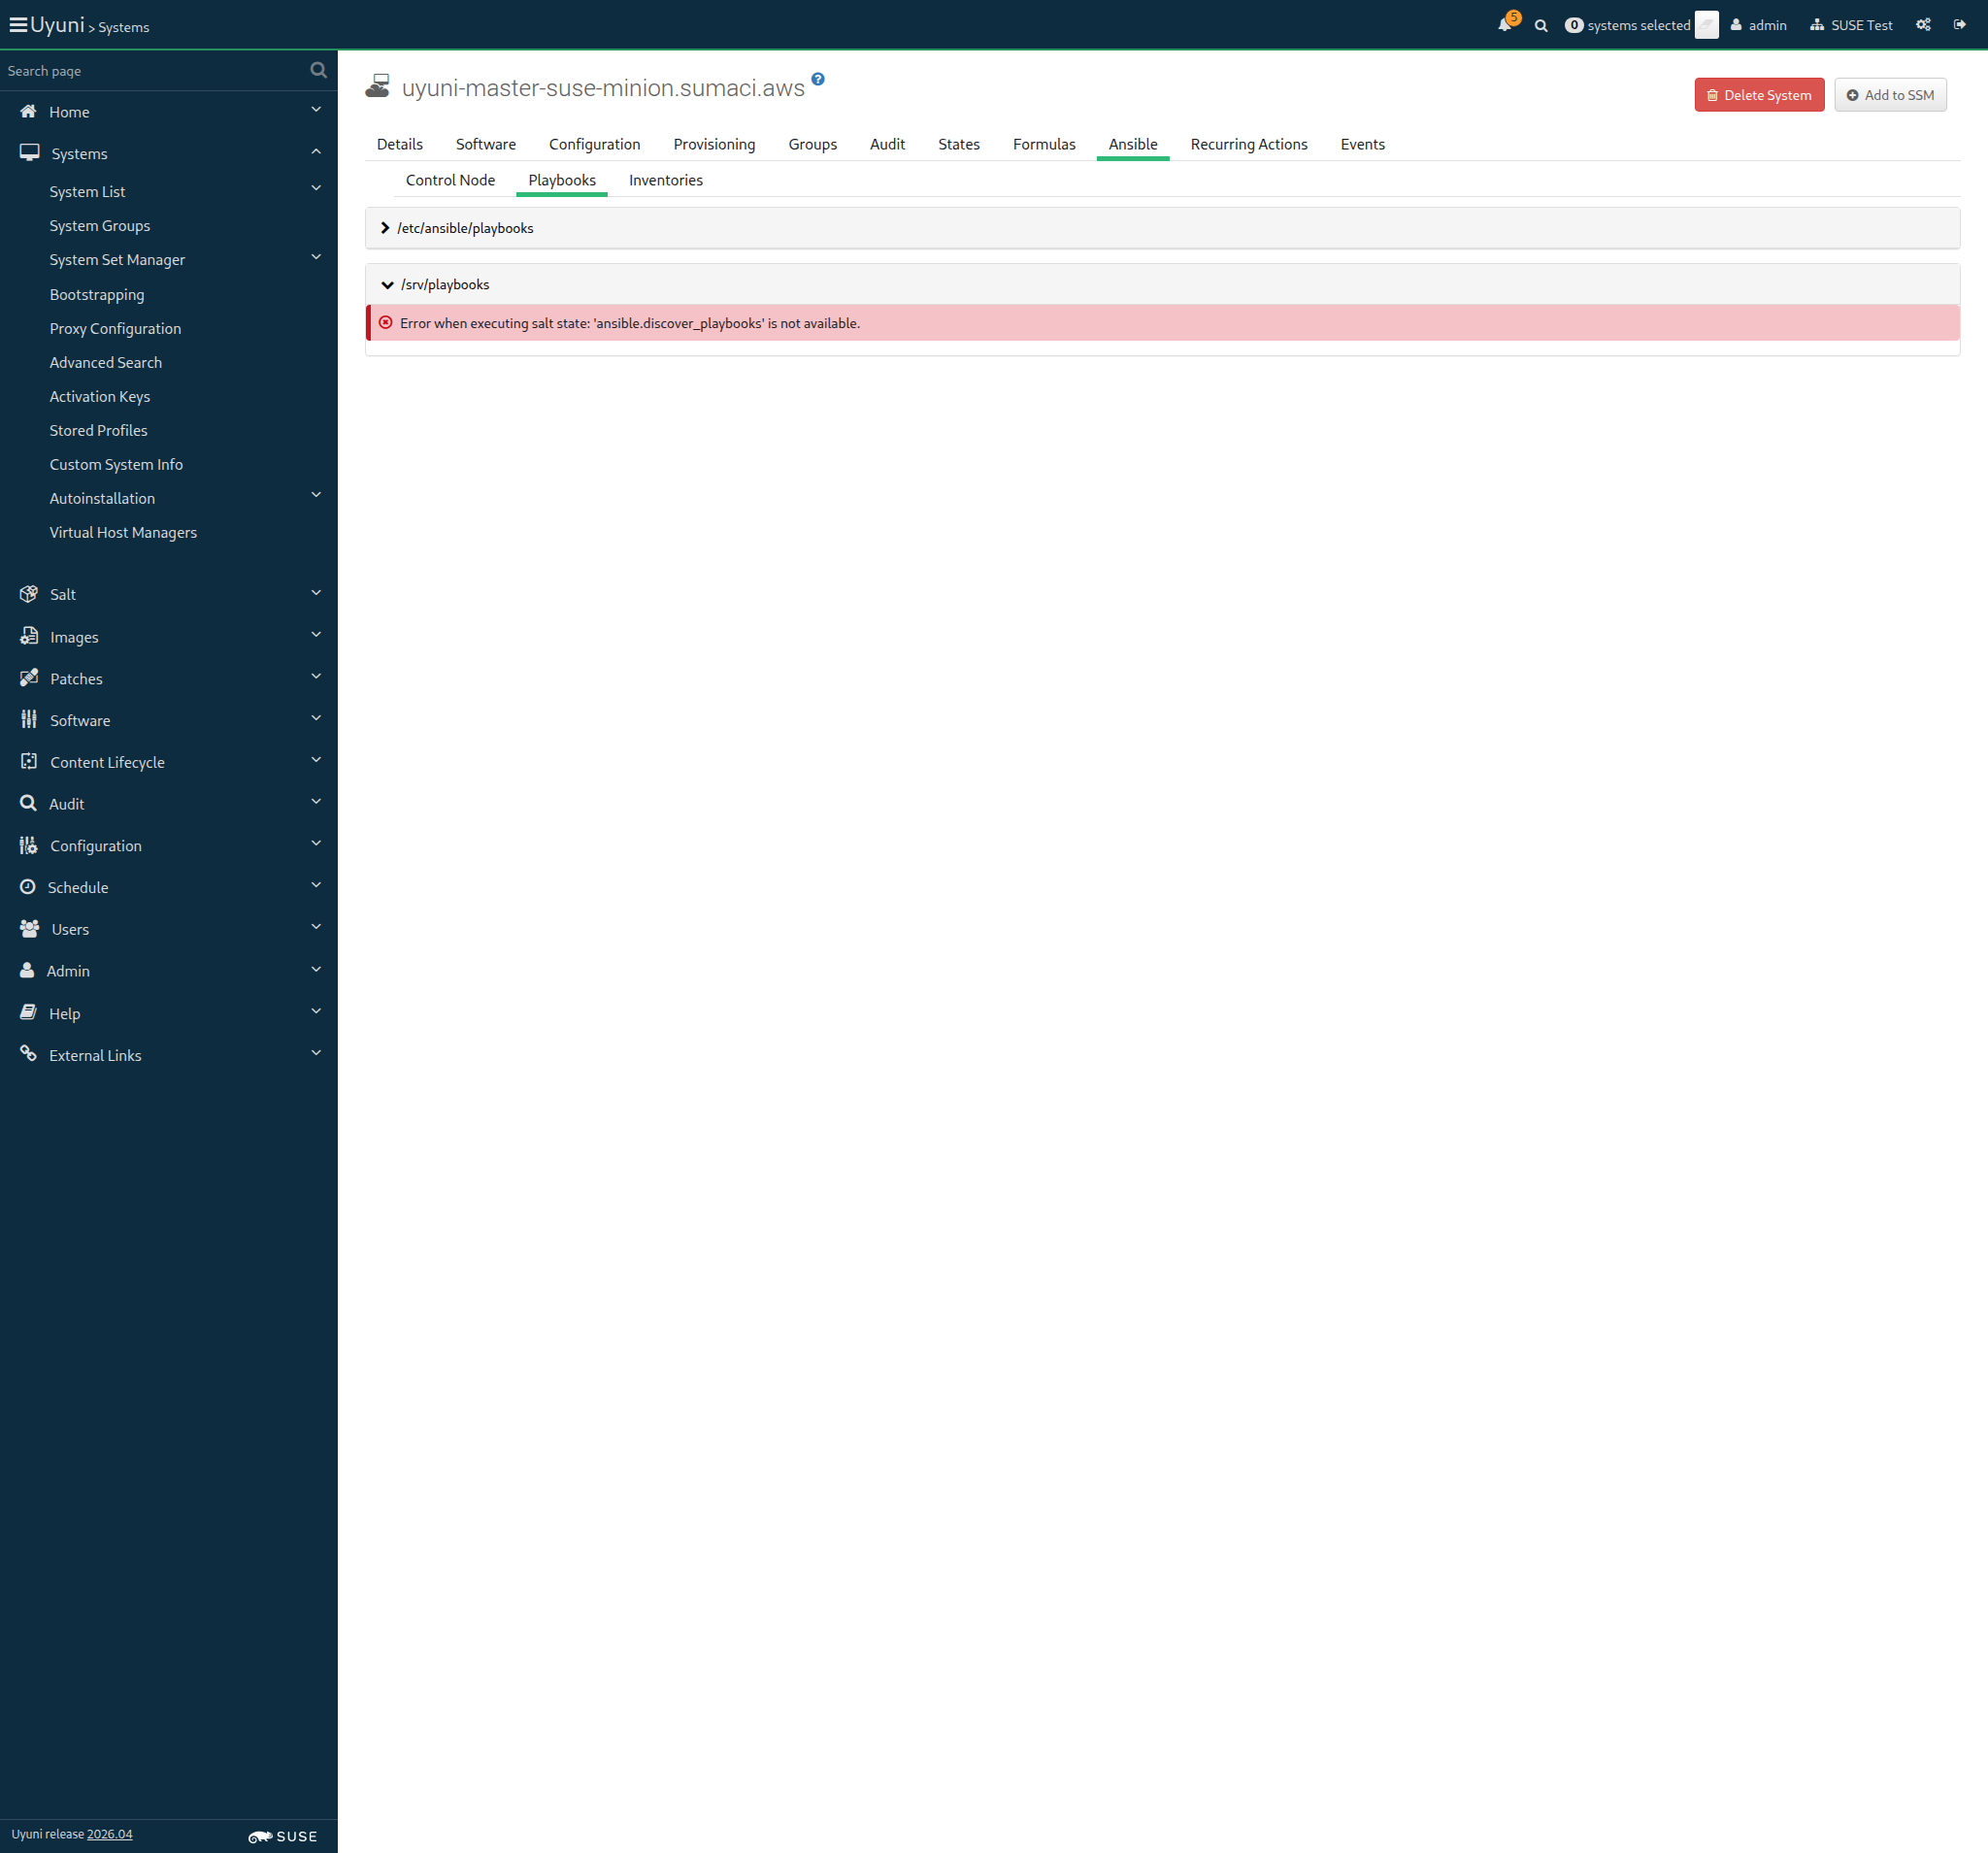
Screenshot +


Given I am on the Systems overview page of this "sle_minion" 1s 351ms

When I follow "Properties" in the content area 84ms

And I uncheck "ansible_control_node" 10s 75ms

And I click on "Update Properties" 1s 893ms

Then I should see a "System properties changed" text 92ms

And I remove package "orion-dummy" from this "sle_minion" without error control 1s 249ms

And I remove "/tmp/file.txt" from "sle_minion" 418ms

Given I am on the Systems overview page of this "sle_minion" 0s

When I follow "Software" in the content area 0s

And I follow "Software Channels" in the content area 0s

And I uncheck "SLE-Module-Python3-15-SP7-Pool for x86_64" by label 0s

And I click on "Next" 0s

And I click on "Confirm" 0s

And I wait until I see "Changing the channels has been scheduled." text 0s

And I follow "scheduled" 0s

And I wait until I see "1 system successfully completed this action" text, refreshing the page 0s

Given I am on the Systems overview page of this "sle_minion" 890ms

When I follow "States" in the content area 79ms

And I click on "Apply Highstate" 65ms

And I wait until event "Apply highstate scheduled" is completed 22s 275ms

Given I am authorized 1s 892ms

Given I am on the Systems overview page of this "sle_minion" 2s 878ms

When I follow "Delete System" 487ms

Then I should see a "Confirm System Profile Deletion" text 63ms

When I click on "Delete Profile" 66ms

And I wait until I see "has been deleted" text 4m 3s 932ms

And I wait until Salt client is inactive on "sle_minion" 750ms

Then "sle_minion" should not be registered 368ms

The hostname of sle_minion is uyuni-master-suse-minion.sumaci.aws

When I follow the left menu "Systems > Bootstrapping" 85ms

Then I should see a "Bootstrap Minions" text 72ms

When I enter the hostname of "sle_minion" as "hostname" 160ms

And I enter "22" as "port" 58ms

And I enter "root" as "user" 66ms

And I enter "linux" as "password" 69ms

And I select "1-SUSE-KEY-x86_64" from "activationKeys" 79ms

And I select the hostname of "proxy" from "proxies" if present 69ms

And I click on "Bootstrap" 66ms

And I wait until I see "Bootstrap process initiated." text 27s 472ms

And I wait until onboarding is completed for "sle_minion" 1m 22s 973ms

It took 5 seconds to contact the minion

When I follow the left menu "Salt > Keys" 149ms

Then I should see a "accepted" text 450ms

And the Salt master can reach "sle_minion" 5s 134ms

Given I am on the Systems overview page of this "sle_minion" 1s 58ms

When I follow "Details" in the content area 78ms

And I follow "Connection" in the content area 71ms

Then I should see "proxy" short hostname 65ms

Given I am on the Systems overview page of this "proxy" 1s 47ms

When I follow "Details" in the content area 64ms

And I follow "Proxy" in the content area 70ms

Then I should see "sle_minion" hostname 98ms

Given I am on the Systems overview page of this "sle_minion" 945ms

When I follow "Details" in the content area 67ms

And I follow "Connection" in the content area 62ms

And I follow "Change" in the content area 71ms

And I select "None" from "proxies" 79ms

And I click on "Change Proxy" 62ms

And I wait until I see "scheduled" text 453ms

And I follow "Events" 405ms

And I follow "History" 718ms

And I wait until I see the event "Apply states [bootstrap.set_proxy] scheduled" completed during last minute, refreshing the page 11s 493ms

And I wait until I see the event "Apply states [channels] scheduled" completed during last minute, refreshing the page 23s 23ms

Given I am on the Systems overview page of this "sle_minion" 978ms

When I follow "Details" in the content area 63ms

And I follow "Connection" in the content area 66ms

Then I should see a "This system connects directly and not through a Proxy" text 60ms

Given I wait for "120" seconds 2m

When I follow the left menu "Systems > System List > All" 143ms

And I click on the clear SSM button 67ms

And I check the "sle_minion" client 453ms

And I should see "1" systems selected for SSM 105ms

And I follow the left menu "Systems > System Set Manager > Overview" 480ms

And I follow "proxy server" in the content area 76ms

And I select the hostname of "proxy" from "proxies" if present 76ms

And I click on "Change Proxy" 63ms

And I wait until I see "scheduled" text 279ms

Given I am on the Systems overview page of this "sle_minion" 1s 7ms

And I follow "Events" 379ms

And I follow "History" 384ms

And I wait until I see the event "Apply states [bootstrap.set_proxy] scheduled" completed during last minute, refreshing the page 12ms

And I wait until I see the event "Apply states [channels] scheduled" completed during last minute, refreshing the page 34s 396ms

Given I am on the Systems overview page of this "proxy" 1s 232ms

When I follow "Details" in the content area 70ms

And I follow "Proxy" in the content area 75ms

Then I should see "sle_minion" hostname 94ms

Given I am on the Systems overview page of this "sle_minion" 1s 1ms

When I follow "Details" in the content area 70ms

And I follow "Connection" in the content area 72ms

Then I should see "proxy" short hostname 70ms

Given I am on the Systems overview page of this "sle_minion" 935ms

Then I check for failed events on history event page 1m 20s 981ms

Given I am authorized 2s 511ms

Given I am on the Systems overview page of this "ssh_minion" 2s 39ms

When I follow "Delete System" 383ms

Then I should see a "Confirm System Profile Deletion" text 64ms

When I click on "Delete Profile" 67ms

And I wait until I see "has been deleted" text 15s 259ms

Then "ssh_minion" should not be registered 448ms

The hostname of ssh_minion is uyuni-master-suse-sshminion.sumaci.aws

When I follow the left menu "Systems > Bootstrapping" 86ms

Then I should see a "Bootstrap Minions" text 69ms

When I check "manageWithSSH" 94ms

And I enter the hostname of "ssh_minion" as "hostname" 153ms

And I enter "root" as "user" 62ms

And I enter "linux" as "password" 68ms

And I select "1-SUSE-SSH-KEY-x86_64" from "activationKeys" 77ms

And I select the hostname of "proxy" from "proxies" if present 71ms

And I click on "Bootstrap" 65ms

And I wait at most 480 seconds until I see "Bootstrap process initiated." text 42s 317ms

And I wait until onboarding is completed for "ssh_minion" 1m 23s 881ms

Given I am on the Systems overview page of this "ssh_minion" 1s 44ms

When I follow "Details" in the content area 74ms

And I follow "Connection" in the content area 67ms

Then I should see "proxy" short hostname 67ms

Given I am on the Systems overview page of this "proxy" 942ms

When I follow "Details" in the content area 67ms

And I follow "Proxy" in the content area 71ms

Then I should see "ssh_minion" hostname 94ms

Given I am on the Systems overview page of this "ssh_minion" 1s 52ms

When I follow "Details" in the content area 70ms

And I follow "Connection" in the content area 61ms

And I follow "Change" in the content area 66ms

And I select "None" from "proxies" 72ms

And I click on "Change Proxy" 61ms

And I wait until I see "scheduled" text 254ms

And I follow "Events" 403ms

And I follow "History" 616ms

And I wait until I see the event "Apply states [channels] scheduled" completed during last minute, refreshing the page 34s 868ms

Given I am on the Systems overview page of this "ssh_minion" 957ms

When I follow "Details" in the content area 66ms

And I follow "Connection" in the content area 63ms

Then I should see a "This system connects directly and not through a Proxy" text 59ms

Given I wait for "120" seconds 2m

Given I am on the Systems overview page of this "ssh_minion" 1s 34ms

When I follow "Details" in the content area 64ms

And I follow "Connection" in the content area 63ms

And I follow "Change" in the content area 69ms

And I select the hostname of "proxy" from "proxies" if present 78ms

And I click on "Change Proxy" 61ms

And I wait until I see "scheduled" text 375ms

And I follow "Events" 400ms

And I follow "History" 421ms

And I wait until I see the event "Apply states [channels] scheduled" completed during last minute, refreshing the page 45s 905ms

Given I am on the Systems overview page of this "proxy" 1s 60ms

When I follow "Details" in the content area 65ms

And I follow "Proxy" in the content area 71ms

Then I should see "ssh_minion" hostname 91ms

Given I am on the Systems overview page of this "ssh_minion" 991ms

When I follow "Details" in the content area 64ms

And I follow "Connection" in the content area 61ms

Then I should see "proxy" short hostname 63ms

Given I am on the Systems overview page of this "ssh_minion" 1s 117ms

Then I check for failed events on history event page 1m 1s 61ms

In order to be secure
As an authorized user
I want to watch different logfiles

Then I wait until file "/var/log/rhn/rhn_web_ui.log" exists on server 4s 765ms

And I wait until file "/var/log/rhn/rhn_web_api.log" exists on server 2s 591ms

And I wait until file "/var/log/rhn/rhn_web_frontend.log" exists on server 2s 514ms

And I wait until file "/var/log/rhn/rhn_taskomatic_daemon.log" exists on server 2s 560ms

And I wait until file "/var/log/rhn/search/rhn_search_daemon.log" exists on server 2s 713ms

And I wait until file "/var/log/rhn/search/rhn_search.log" exists on server 4s 136ms

And I wait until file "/var/log/rhn/reposync.log" exists on server 2s 516ms

And I wait until file "/var/log/salt/master" exists on server 2s 491ms

And I wait until file "/var/log/salt/api" exists on server 2s 609ms

Given I am authorized for the "Admin" section 2s 472ms

When I start local monitoring of Cobbler 14s 360ms

And I backup Cobbler settings file 2s 505ms

When I follow the left menu "Admin > Manager Configuration > Cobbler" 421ms

Then I should see a "Uyuni Configuration - Cobbler. " text 64ms

And I should see a "Setup your Uyuni Cobbler settings below. " text 57ms

And I should see a "Cobbler sync is used to repair or rebuild the contents /srv/tftpboot or /srv/www/cobbler when manual modification of cobbler has occurred. " text 60ms

And I should see a "For more information refer to the 'cobbler' man page. " text 58ms

And I should see a "Run Cobbler Sync" text in the content area 22ms

And I should see a "Update" button 17ms

When I follow the left menu "Admin > Manager Configuration > Cobbler" 0s

Then I should see a "SUSE Multi-Linux Manager Configuration - Cobbler. " text 0s

And I should see a "Setup your SUSE Multi-Linux Manager Cobbler settings below. " text 0s

And I should see a "Cobbler sync is used to repair or rebuild the contents /srv/tftpboot or /srv/www/cobbler when manual modification of cobbler has occurred. " text 0s

And I should see a "For more information refer to the 'cobbler' man page. " text 0s

And I should see a "Run Cobbler Sync" text in the content area 0s

And I should see a "Update" button 0s

When I follow the left menu "Admin > Manager Configuration > Cobbler" 71ms

And I click on "Update" 354ms

Then I should see a "Cobbler Sync action was successfully executed. Look at /var/log/cobbler/*.log for more information" text 66ms

When I follow the left menu "Admin > Manager Configuration > Cobbler" 76ms

And I click on "Update" 334ms

And I follow the left menu "Admin > Task Engine Status > Last Execution Times" 436ms

Then I should see the correct timestamp for task "Cobbler Sync:" 10s 11ms

Then the local logs for Cobbler should not contain errors 9s 474ms

When I start local monitoring of Cobbler 13s 795ms

And I backup Cobbler settings file 2s 682ms

Given I am authorized as "testing" with password "testing" 2s 271ms

And I am logged in via the Cobbler API as user "testing" with password "testing" 1s 345ms

When I copy autoinstall mocked files on server 8s 140ms

Given cobblerd is running 2ms

When I create "testdistro" kickstart tree via the API 658ms

Given cobblerd is running 2ms

When I create a "testprofile" profile via the API using import file for "testdistro" distribution 857ms

When I follow the left menu "Systems > Autoinstallation > Profiles" 214ms

Then I should see a "testprofile" text 72ms

And I should see a "testdistro" text 66ms

When I follow the left menu "Systems > Autoinstallation > Distributions" 78ms

And I follow "Create Distribution" 311ms

And I enter "SLE-15-FAKE" as "label" 64ms

And I enter "/var/autoinstall/SLES15-SP7-x86_64/DVD1/" as "basepath" 95ms

And I select "SLE-Product-SLES15-SP7-Pool for x86_64" from "channelid" 283ms

And I select "SUSE Linux Enterprise 15" from "installtype" 66ms

And I click on "Create Autoinstallable Distribution" 790ms

And I wait until I see "Autoinstallable Distribution Created" text 70ms

Then I should see a "Autoinstallable Distributions" text 68ms

And I should see a "SLE-15-FAKE" link 12ms

When I follow "SLE-15-FAKE" 327ms

Then I should see "self_update=http://" in field identified by "kernelopts" 31ms

When I follow the left menu "Systems > Autoinstallation > Distributions" 71ms

And I follow "Create Distribution" 462ms

When I enter "fedora_kickstart_distro" as "label" 69ms

And I enter "/var/autoinstall/Fedora_12_i386/" as "basepath" 79ms

And I select "Fedora" from "installtype" 61ms

And I click on "Create Autoinstallable Distribution" 52ms

Then I should see a "Autoinstallable Distributions" text 72ms

And I should see a "fedora_kickstart_distro" link 12ms

When I create "fedora_kickstart_distro_api" kickstart tree via the API 1s 354ms

When I follow the left menu "Systems > Autoinstallation > Distributions" 75ms

Then I should see a "fedora_kickstart_distro_api" link 14ms

When I create a kickstart tree with kernel options via the API 685ms

When I follow the left menu "Systems > Autoinstallation > Distributions" 95ms

Then I should see a "fedora_kickstart_distro_kernel_api" link 11ms

When I update a kickstart tree via the API 1s 323ms

When I follow the left menu "Systems > Autoinstallation > Distributions" 70ms

And I follow "fedora_kickstart_distro_api" 338ms

Then option "Generic RPM" is selected as "installtype" 77ms

And I should see "self_update=0" in field identified by "kernelopts" 21ms

And I should see "self_update=1" in field identified by "postkernelopts" 23ms

When I follow the left menu "Systems > Autoinstallation > Profiles" 75ms

And I follow "Create Kickstart Profile" 306ms

When I enter "fedora_kickstart_profile" as "kickstartLabel" 74ms

And I click on "Next" 61ms

And I click on "Next" 371ms

And I enter "linux" as "rootPassword" 50ms

And I enter "linux" as "rootPasswordConfirm" 60ms

And I click on "Finish" 63ms

Then I should see a "Autoinstallation: fedora_kickstart_profile" text 73ms

And I should see a "Autoinstallation Details" link 12ms

When I follow the left menu "Systems > Autoinstallation > Profiles" 75ms

And I follow "Upload Kickstart/AutoYaST File" 375ms

When I enter "fedora_kickstart_profile_upload" as "kickstartLabel" 81ms

And I select "fedora_kickstart_distro" from "kstreeId" 50ms

And I attach the file "/example.ks" to "fileUpload" 33ms

And I click on "Create" 1s 630ms

Then I should see a "Autoinstallation: fedora_kickstart_profile_upload" text 98ms

And I should see a "Autoinstallation Details" text 91ms

When I follow the left menu "Systems > Autoinstallation > Profiles" 78ms

And I follow "fedora_kickstart_profile" 570ms

And I follow "Unprovisioned Autoinstallation" 410ms

And I enter "10" as "octet1a" 51ms

And I enter "10" as "octet1b" 56ms

And I enter "0" as "octet1c" 51ms

And I enter "100" as "octet1d" 53ms

And I enter "10" as "octet2a" 55ms

And I enter "10" as "octet2b" 51ms

And I enter "0" as "octet2c" 54ms

And I enter "200" as "octet2d" 55ms

And I click on "Add IP Range" 1s 106ms

Then I should see a "Successfully added IP Range" text 70ms

When I follow the left menu "Systems > Autoinstallation > Profiles" 78ms

And I follow "fedora_kickstart_profile_upload" 778ms

And I follow "Variables" 888ms

And I enter "my_var=A_Test_String" as "variables" 76ms

And I click on "Update Variables" 630ms

And I follow "Autoinstallation File" 653ms

Then I should see a "A_Test_String" text 60ms

When I follow the left menu "Systems > Autoinstallation > Profiles" 73ms

And I follow "fedora_kickstart_profile" 562ms

And I enter "kernel_option=a_value" as "kernel_options" 81ms

And I click on "Update" 71ms

And I wait until file "/srv/tftpboot/pxelinux.cfg/default" contains "kernel_option=a_value" on server 3s 7ms

When I follow the left menu "Systems > Autoinstallation > Profiles" 78ms

And I follow "fedora_kickstart_profile_upload" 479ms

And I enter "kernel_option2=a_value2" as "kernel_options" 70ms

And I click on "Update" 1s 134ms

And I wait until file "/srv/tftpboot/pxelinux.cfg/default" contains "kernel_option2=a_value2" on server 2s 678ms

When I follow the left menu "Systems > Autoinstallation > Autoinstallation Snippets" 120ms

And I follow "Default Snippets" 330ms

And I enter "spacewalk/sles_no_signature_checks" as the filtered snippet name 101ms

And I click on the filter button 491ms

And I follow "spacewalk/sles_no_signature_checks" 314ms

Then I should see "<signature-handling>" in the textarea 16ms

When I follow the left menu "Systems > Autoinstallation > Autoinstallation Snippets" 73ms

And I follow "Create Snippet" 309ms

And I enter "created_test_snippet" as "name" 80ms

And I enter "<test_element>a text string</test_element>" in the editor 4ms

And I click on "Create Snippet" 349ms

Then I should see a "created_test_snippet created successfully." text 77ms

When I follow the left menu "Systems > Autoinstallation > Autoinstallation Snippets" 78ms

And I follow "created_test_snippet" 315ms

And I follow "Delete Snippet" 316ms

And I click on "Delete Snippet" 480ms

Then I should see a "created_test_snippet deleted successfully." text 68ms

Given cobblerd is running 25ms

When I wait until file "/srv/tftpboot/pxelinux.cfg/default" exists on server 2s 514ms

And I wait until file "/srv/tftpboot/pxelinux.cfg/default" contains "inst.ks=.*fedora_kickstart_profile:1" on server 2s 465ms

And I wait until file "/srv/tftpboot/pxelinux.cfg/default" contains "inst.ks=.*fedora_kickstart_profile_upload:1" on server 2s 497ms

And I wait until file "/srv/tftpboot/images/fedora_kickstart_distro:1:SUSETest/initrd.img" exists on server 2s 578ms

And I wait until file "/srv/tftpboot/images/fedora_kickstart_distro:1:SUSETest/vmlinuz" exists on server 2s 491ms

And I wait until file "/srv/tftpboot/menu.c32" exists on server 4s 109ms

And I wait until file "/srv/tftpboot/pxelinux.0" exists on server 2s 556ms

When I clear the caches on the server 2s 942ms

And I am on the Systems overview page of this "sle_minion" 971ms

And I follow "Provisioning" 670ms

And I click on profile "testprofile" 54ms

And I click on "Create PXE installation configuration" 1s 183ms

Then I should see a "System record created" text 87ms

And I wait until file "/srv/tftpboot/pxelinux.cfg/01-*" contains "autoyast=" on server 4s 468ms

When I create a system record 565ms

And I wait until file "/srv/tftpboot/pxelinux.cfg/01-00-22-22-77-ee-cc" contains "inst.ks=.*testserver:1" on server 2s 561ms

Then the cobbler report should contain "testserver.example.com" for cobbler system name "testserver:1" 3s 383ms

And the cobbler report should contain "1.1.1.1" for cobbler system name "testserver:1" 3s 221ms

And the cobbler report should contain "00:22:22:77:ee:cc" for cobbler system name "testserver:1" 3s 203ms

When I wait for "10" seconds 10s

When I delete profile and distribution using the API for "testdistro" kickstart tree 507ms

When I delete profile and distribution using the API for "fedora_kickstart_distro" kickstart tree 490ms

When I delete profile and distribution using the API for "fedora_kickstart_distro_api" kickstart tree 375ms

When I delete profile and distribution using the API for "fedora_kickstart_distro_kernel_api" kickstart tree 1s 101ms

When I delete profile and distribution using the API for "SLE-15-FAKE" kickstart tree 1s 800ms

When I follow the left menu "Systems > Autoinstallation > Distributions" 149ms

And I should not see a "testdistro" text 64ms

And I should not see a "fedora_kickstart_distro" text 60ms

And I should not see a "fedora_kickstart_distro_api" text 60ms

And I should not see a "fedora_kickstart_distro_kernel_api" text 58ms

And I should not see a "SLE-15-FAKE" text 58ms

When I wait for "5" seconds 5s

Then the local logs for Cobbler should not contain errors 7s 760ms

When I log out from Cobbler via the API 4ms

@scope_cobbler @skip_if_github_validation
Feature:Cobbler buildiso 3m 40s 601ms 19

Builds several ISOs with Cobbler and checks the configuration files and ISOs afterwards.

When I start local monitoring of Cobbler 12s 824ms

And I backup Cobbler settings file 2s 587ms

Given I am authorized as "testing" with password "testing" 461ms

And I am logged in via the Cobbler API as user "testing" with password "testing" 780ms

Given cobblerd is running 3ms

When I create distro "buildisodistro" 58ms

Given distro "buildisodistro" exists 4ms

When I create profile "orchid" for distro "buildisodistro" 79ms

And I create profile "flame" for distro "buildisodistro" 80ms

And I create profile "pearl" for distro "buildisodistro" 108ms

When I follow the left menu "Systems > Autoinstallation > Profiles" 202ms

Then I should see a "buildisodistro" text 73ms

And I should see a "orchid" text 70ms

And I should see a "flame" text 71ms

And I should see a "pearl" text 67ms

Given profile "orchid" exists 10ms

When I create system "testsystem" for profile "orchid" 51ms

And I add the Cobbler parameter "name-servers" with value "9.9.9.9" to item "system" with name "testsystem" 3s 301ms

When I prepare Cobbler for the buildiso command 9s 118ms

When I run Cobbler buildiso for distro "buildisodistro" and all profiles 22s 990ms

And I check Cobbler buildiso ISO "profile_all" with xorriso 9s 753ms

And I check the Cobbler parameter "nameserver" with value "9.9.9.9" in the isolinux.cfg 2s 468ms

And I cleanup xorriso temp files 2s 671ms

When I run Cobbler buildiso for distro "buildisodistro" and profile "orchid" 4s 325ms

And I check Cobbler buildiso ISO "orchid" with xorriso 9s 805ms

And I cleanup xorriso temp files 2s 492ms

When I run Cobbler buildiso for distro "buildisodistro" and profile "orchid" without dns entries 8s 896ms

And I check Cobbler buildiso ISO "orchid" with xorriso 7s 542ms

And I cleanup xorriso temp files 2s 609ms

When I run Cobbler buildiso "airgapped" for distro "buildisodistro" 33s 274ms

And I check Cobbler buildiso ISO "airgapped" with xorriso 9s 982ms

And I cleanup xorriso temp files 2s 485ms

When I run Cobbler buildiso "standalone" for distro "buildisodistro" 34s 489ms

And I check Cobbler buildiso ISO "standalone" with xorriso 9s 609ms

And I cleanup xorriso temp files 2s 498ms

Given I am authorized as "testing" with password "testing" 463ms

When I remove system "testsystem" 21ms

Given I am authorized as "testing" with password "testing" 1s 71ms

And I remove profile "orchid" 131ms

And I remove profile "flame" 64ms

And I remove profile "pearl" 23ms

When I follow the left menu "Systems > Autoinstallation > Profiles" 173ms

Then I should not see a "orchid" text 63ms

And I should not see a "flame" text 59ms

And I should not see a "flame" text 61ms

Given I am authorized as "testing" with password "testing" 452ms

And I remove distro "buildisodistro" 16ms

And I follow the left menu "Systems > Autoinstallation > Profiles" 176ms

Then I should not see a "buildisodistro" text 62ms

Then the local logs for Cobbler should not contain errors 7s 881ms

When I log out from Cobbler via the API 3ms

@scope_cobbler @skip_if_github_validation
Feature:Edit Cobbler profiles 1m 26s 637ms 12

When I copy autoinstall mocked files on server 8s 520ms

And I backup Cobbler settings file 4s 399ms

Given I am authorized as "testing" with password "testing" 10s 818ms

When I start local monitoring of Cobbler 14s 360ms

When I follow the left menu "Systems > Autoinstallation > Distributions" 220ms

And I follow "Create Distribution" 286ms

When I enter "isedistro_ui" as "label" 63ms

And I enter "/var/autoinstall/Fedora_12_i386/" as "basepath" 84ms

And I select "Fedora" from "installtype" 69ms

And I click on "Create Autoinstallable Distribution" 674ms

Then I should see a "Autoinstallable Distributions" text 73ms

And I should see a "isedistro_ui" link 12ms

When I follow the left menu "Systems > Autoinstallation > Distributions" 79ms

Then I should see a "isedistro_ui" text 71ms

When I follow the left menu "Systems > Autoinstallation > Profiles" 75ms

And I follow "Create Kickstart Profile" 355ms

When I enter "iseprofile_ui" as "kickstartLabel" 62ms

And I click on "Next" 331ms

And I click on "Next" 384ms

And I enter "linux" as "rootPassword" 53ms

And I enter "linux" as "rootPasswordConfirm" 59ms

And I click on "Finish" 68ms

Then I should see a "Autoinstallation: iseprofile_ui" text 76ms

And I should see a "Autoinstallation Details" link 11ms

When I follow the left menu "Systems > Autoinstallation > Profiles" 74ms

Then I should see a "iseprofile_ui" text 68ms

When I follow the left menu "Systems > Autoinstallation > Profiles" 70ms

And I follow "iseprofile_ui" 1s 325ms

And I follow "Variables" 410ms

And I enter "ise_ui_test=ISE_UI_TEST" as "variables" 79ms

And I click on "Update Variables" 67ms

And I refresh the page 10s 893ms

Then I should see a "ISE_UI_TEST" text 64ms

When I follow the left menu "Systems > Autoinstallation > Distributions" 73ms

And I follow "Create Distribution" 394ms

When I enter "isedistro_api" as "label" 78ms

And I enter "/var/autoinstall/Fedora_12_i386/" as "basepath" 81ms

And I select "Fedora" from "installtype" 54ms

And I click on "Create Autoinstallable Distribution" 1s 132ms

Then I should see a "Autoinstallable Distributions" text 68ms

And I should see a "isedistro_api" link 11ms

When I follow the left menu "Systems > Autoinstallation > Distributions" 76ms

Then I should see a "isedistro_api" text 66ms

When I follow the left menu "Systems > Autoinstallation > Profiles" 71ms

And I follow "Create Kickstart Profile" 388ms

When I enter "iseprofile_api" as "kickstartLabel" 59ms

And I click on "Next" 52ms

And I click on "Next" 671ms

And I enter "linux" as "rootPassword" 48ms

And I enter "linux" as "rootPasswordConfirm" 55ms

And I click on "Finish" 1s 291ms

Then I should see a "Autoinstallation: iseprofile_api" text 75ms

And I should see a "Autoinstallation Details" link 9ms

When I follow the left menu "Systems > Autoinstallation > Profiles" 78ms

Then I should see a "iseprofile_api" text 72ms

When I create a system record with name "isesystem_api" and kickstart label "iseprofile_api" 510ms

When I create and modify the kickstart system "isesystem_api" with kickstart label "iseprofile_api" and hostname "ise-system.test" via XML-RPC 1s 533ms
inst.repo http://ise.cobbler.test
self_update http://ise.cobbler.test

When I wait for "10" seconds 10s

When I delete profile and distribution using the API for "isedistro_ui" kickstart tree 518ms

When I delete profile and distribution using the API for "isedistro_api" kickstart tree 478ms

When I follow the left menu "Systems > Autoinstallation > Distributions" 73ms

And I should not see a "isedistro_ui" text 65ms

And I should not see a "isedistro_api" text 59ms

When I wait for "5" seconds 5s

Then the local logs for Cobbler should not contain errors 9s 218ms

Given I am authorized for the "Admin" section 38s 21ms

When I follow the left menu "Users > User List > Active" 219ms

Then I should see a "Active Users" text 190ms

And I should see a "Create User" link 20ms

And I should see a "User List" link in the left menu 26ms

And I should see a "Active" link in the left menu 21ms

And I should see a "Deactivated" link in the left menu 21ms

And I should see a "All" link in the left menu 26ms

And I should see a "admin" link in the table first column 11ms

And I should see a "Download CSV" link 11ms

When I follow the left menu "Users > User List > Active" 74ms

And I follow "Create User" 293ms

And I enter "user1" as "login" 58ms

And I enter "user1" as "desiredpassword" 57ms

And I enter "user1" as "desiredpasswordConfirm" 60ms

And I select "Mr." from "prefix" 53ms

And I enter "Test" as "firstNames" 60ms

And I enter "User" as "lastName" 57ms

And I enter "galaxy-noise@localhost" as "email" 78ms

And I click on "Create Login" 6s 178ms

Then I should see a "Account user1 created, login information sent to galaxy-noise@localhost" text 189ms

And I should see a "user1" link 13ms

And I should see a "normal user" text 172ms

Given I am authorized as "user1" with password "user1" 1s 731ms

Then I should see a "user1" link 7ms

Given I am authorized for the "Admin" section 1s 452ms

When I follow the left menu "Users > User List > Active" 158ms

And I follow "user1" 486ms

Then I should see a "User Details" text 77ms

And I should see a "Delete User" link 11ms

And I should see a "Deactivate User" link 11ms

And I should see a "Details" link 14ms

And I should see a "System Groups" link 16ms

And I should see a "Systems" link in the content area 25ms

And I should see a "Channel Permissions" link 11ms

And I should see a "Preferences" link in the content area 26ms

And I should see a "Addresses" link 15ms

And I should see a "user1" text 73ms

And option "Mr." is selected as "prefix" 65ms

And I should see "Test" in field identified by "firstNames" 25ms

And I should see "User" in field identified by "lastName" 24ms

And I should see a "galaxy-noise@localhost" text 70ms

And I should see a "Administrative Roles" text 71ms

And I should see a "Roles:" text 75ms

And I should see a "Created:" text 73ms

And I should see a "Last Sign In:" text 72ms

When I follow the left menu "Users > User List > Active" 0s

And I follow "user1" 0s

When the "role_satellite_admin" checkbox should be disabled 0s

And I check "role_org_admin" 0s

And I check "role_system_group_admin" 0s

And I check "role_channel_admin" 0s

And I check "role_activation_key_admin" 0s

And I check "role_config_admin" 0s

And I click on "Update" 0s

Then the "role_satellite_admin" checkbox should be disabled 0s

And I should see a "SUSE Multi-Linux Manager Administrator" text 0s

And I should see "role_org_admin" as checked 0s

And I should see a "Organization Administrator" text 0s

And I should see "role_system_group_admin" as checked 0s

And I should see a "System Group Administrator" text 0s

And I should see "role_channel_admin" as checked 0s

And I should see a "Channel Administrator" text 0s

And I should see "role_activation_key_admin" as checked 0s

And I should see a "Activation Key Administrator" text 0s

And I should see "role_config_admin" as checked 0s

And I should see a "Configuration Administrator" text 0s

And I should see "role_regular_user" as checked 0s

And I should see a "Regular User" text 0s

When I follow the left menu "Users > User List > Active" 75ms

And I follow "user1" 307ms

When the "role_satellite_admin" checkbox should be disabled 10s 9ms

And I check "role_org_admin" 82ms

And I check "role_system_group_admin" 78ms

And I check "role_channel_admin" 79ms

And I check "role_activation_key_admin" 77ms

And I check "role_config_admin" 77ms

And I click on "Update" 2s 467ms

Then the "role_satellite_admin" checkbox should be disabled 10s 12ms

And I should see a "Uyuni Administrator" text 75ms

And I should see "role_org_admin" as checked 15ms

And I should see a "Organization Administrator" text 72ms

And I should see "role_system_group_admin" as checked 16ms

And I should see a "System Group Administrator" text 78ms

And I should see "role_channel_admin" as checked 17ms

And I should see a "Channel Administrator" text 73ms

And I should see "role_activation_key_admin" as checked 16ms

And I should see a "Activation Key Administrator" text 71ms

And I should see "role_config_admin" as checked 16ms

And I should see a "Configuration Administrator" text 73ms

And I should see "role_regular_user" as checked 18ms

And I should see a "Regular User" text 71ms

When I follow the left menu "Users > User List > Active" 72ms

Then table row for "user1" should contain "Organization Administrator" 27ms

When I follow the left menu "Users > User List > Active" 72ms

And I follow "user1" 466ms

When I follow "Deactivate User" 433ms

Then I should see a "This action will deactivate this user. This user will no longer be able to log in or perform actions unless it is reactivated." text 51ms

When I click on "Deactivate User" 724ms

Then I should see a "You cannot deactivate another organization administrator. Please remove the 'Organization Administrator' role from this user before attempting to deactivate their account." text 81ms

When I follow "Deactivated" 256ms

Then I should see a "No deactivated users." text 59ms

When I follow the left menu "Users > User List > Active" 73ms

And I follow "user1" 506ms

When I uncheck "role_org_admin" 10s 77ms

And I click on "Update" 761ms

Then I should see "role_org_admin" as unchecked 16ms

And I should see "role_system_group_admin" as checked 19ms

And I should see "role_channel_admin" as checked 15ms

And I should see "role_activation_key_admin" as checked 16ms

And I should see "role_config_admin" as checked 17ms

And I should see "role_regular_user" as checked 16ms

When I follow the left menu "Users > User List > Active" 75ms

And I follow "user1" 495ms

Then I should see "role_org_admin" as unchecked 30ms

When I follow "Deactivate User" 330ms

Then I should see a "This action will deactivate this user. This user will no longer be able to log in or perform actions unless it is reactivated." text 51ms

When I click on "Deactivate User" 567ms

Then I should see a "Active Users" text 185ms

And I should not see a "user1" link 9ms

When I follow "Deactivated" 288ms

Then I should see a "Deactivated Users" text 67ms

And I should see a "user1" link 9ms

When I follow "All" 408ms

Then I should see a "user1" link 11ms

When I follow the left menu "Users > User List > Active" 0s

And I follow "Deactivated" 0s

And I follow "user1" 0s

Then I should see a "Reactivate User" link 0s

When I follow "Reactivate User" 0s

Then I should see a "This action will allow this user to access SUSE Multi-Linux Manager. This user will retain all permissions, roles, and data that he or she had before being deactivated." text 0s

When I click on "Reactivate User" 0s

Then I should see a "Active Users" text 0s

And I should see a "user1" link 0s

When I follow "Deactivated" 0s

Then I should not see a "user1" link 0s

When I follow the left menu "Users > User List > Active" 73ms

And I follow "Deactivated" 265ms

And I follow "user1" 394ms

Then I should see a "Reactivate User" link 12ms

When I follow "Reactivate User" 417ms

Then I should see a "This action will allow this user to access Uyuni. This user will retain all permissions, roles, and data that he or she had before being deactivated." text 53ms

When I click on "Reactivate User" 615ms

Then I should see a "Active Users" text 180ms

And I should see a "user1" link 9ms

When I follow "Deactivated" 278ms

Then I should not see a "user1" link 5ms

When I follow the left menu "Users > User List > Active" 73ms

And I follow "user1" 408ms

When I follow "Delete User" 398ms

Then I should see a "Confirm User Deletion" text 52ms

And I should see a "This will delete this user permanently." text 50ms

When I click on "Delete User" 562ms

Then I should see a "Active Users" text 178ms

And I should not see a "user1" link 5ms

Given I am authorized as "testing" with password "testing" 1s 815ms

When I follow the left menu "Home > My Preferences" 70ms

Then I should see a "CSV Files" text 108ms

And I should see a "Configure a separator character to be used in downloadable CSV files:" text 103ms

And I should see a "Comma" text 102ms

And I should see a "Semicolon" text 97ms

Given I am authorized as "testing" with password "testing" 487ms

When I follow the left menu "Home > My Preferences" 61ms

And I choose ";" 61ms

And I click on "Save Preferences" 377ms

Then I should see a "Preferences modified" text 107ms

And radio button "radio-semicolon" should be checked 20ms

Given I am authorized as "testing" with password "testing" 602ms

When I follow the left menu "Home > My Preferences" 62ms

And I choose "," 56ms

And I click on "Save Preferences" 56ms

Then I should see a "Preferences modified" text 110ms

And radio button "radio-comma" should be checked 21ms

Given I am authorized for the "Admin" section 1s 754ms

When I follow the left menu "Home" 59ms

And I should see a "Overview" link in the left menu 29ms

Then I should see a "Overview" text 55ms

And I should see a "Notification Messages" link in the left menu 22ms

And I should see a "User Account" link in the left menu 24ms

And I should see a "My Preferences" link in the left menu 23ms

And I should see a "My Organization" link in the left menu 20ms

When I follow the left menu "Home > User Account" 69ms

Then I should see a "My Account" text 71ms

And I should see a "My Account" link in the left menu 23ms

And I should see a "Addresses" link in the left menu 21ms

And I should see a "Change Email" link in the left menu 22ms

And I should see a "Account Deactivation" link in the left menu 22ms

When I follow the left menu "Home > My Organization" 67ms

Then I should see a "Organization Configuration" text 63ms

And I should see a "Configuration" link in the left menu 26ms

And I should see a "Organization Trusts" link in the left menu 25ms

And I should see a "Configuration Channels" link in the left menu 24ms

When I follow the left menu "Salt" 56ms

Then I should see a "Keys" text 59ms

And I should see a "Keys" link in the left menu 25ms

And I should see a "Remote Commands" link in the left menu 23ms

And I should see a "Formula Catalog" link in the left menu 22ms

When I follow the left menu "Content Lifecycle" 69ms

Then I should see a "Content Lifecycle Projects" text 54ms

And I should see a "Projects" link in the left menu 25ms

And I should see a "Filters" link in the left menu 23ms

When I follow the left menu "Images" 57ms

Then I should see a "Images" text 55ms

And I should see a "Image List" link in the left menu 22ms

And I should see a "Build" link in the left menu 23ms

And I should see a "Profiles" link in the left menu 21ms

And I should see a "Stores" link in the left menu 24ms

When I follow the left menu "Audit" 57ms

Then I should see a "CVE Audit" text 74ms

And I should see a "CVE Audit" link in the left menu 24ms

And I should see a "Subscription Matching" link in the left menu 22ms

And I should see a "OpenSCAP" link in the left menu 23ms

And I should see a "Confidential Computing" link in the left menu 21ms

When I follow the left menu "Audit > OpenSCAP" 74ms

Then I should see a "OpenSCAP Scans" text 62ms

And I should see a "All Scans" link in the left menu 25ms

And I should see a "XCCDF Diff" link in the left menu 22ms

And I should see a "Advanced Search" link in the left menu 22ms

When I follow the left menu "Configuration" 58ms

Then I should see a "Configuration Overview" text 59ms

And I should see a "Overview" link in the left menu 21ms

And I should see a "Channels" link in the left menu 24ms

And I should see a "Files" link in the left menu 26ms

When I follow the left menu "Configuration > Files" 72ms

Then I should see a "Centrally-Managed Configuration Files" text 53ms

And I should see a "Centrally Managed" link in the left menu 23ms

And I should see a "Locally Managed" link in the left menu 22ms

When I follow the left menu "Configuration > Systems" 66ms

Then I should see a "Managed Systems" text 57ms

And I should see a "Managed" link in the left menu 22ms

And I should see a "Target" link in the left menu 25ms

When I follow the left menu "Schedule" 55ms

Then I should see a "Pending Actions" text 56ms

And I should see a "Pending Actions" link in the left menu 22ms

And I should see a "Failed Actions" link in the left menu 23ms

And I should see a "Archived Actions" link in the left menu 22ms

And I should see a "Action Chains" link in the left menu 20ms

When I follow the left menu "Users" 55ms

Then I should see a "Active Users" text 189ms

And I should see a "Users" link in the left menu 23ms

And I should see a "User List" link in the left menu 22ms

And I should see a "Active" link in the left menu 22ms

And I should see a "Deactivated" link in the left menu 22ms

And I should see a "All" link in the left menu 52ms

And I should see a "System Group Configuration" link in the left menu 22ms

When I follow the left menu "Admin" 58ms

Then I should see a "Setup Wizard" text 72ms

And I should see a "Setup Wizard" link in the left menu 24ms

And I should see a "Organizations" link in the left menu 22ms

And I should see a "Users" link in the left menu 19ms

And I should see a "Manager Configuration" link in the left menu 24ms

And I should see a "Hub Configuration" link in the left menu 22ms

And I should see a "Task Schedules" link in the left menu 22ms

And I should see a "Task Engine Status" link in the left menu 21ms

And I should see a "Show Tomcat Logs" link in the left menu 21ms

When I follow the left menu "Admin > Setup Wizard" 71ms

Then I should see a "HTTP Proxy" link in the left menu 23ms

And I should see a "Organization Credentials" link in the left menu 22ms

And I should see a "Products" link in the left menu 22ms

When I follow the left menu "Admin > Manager Configuration" 69ms

Then I should see a "Configuration - General Configuration" text 69ms

And I should see a "General" link in the left menu 24ms

And I should see a "Bootstrap Script" link in the left menu 26ms

And I should see a "Organizations" link in the left menu 20ms

And I should see a "Restart" link in the left menu 24ms

And I should see a "Cobbler" link in the left menu 23ms

And I should see a "Monitoring" link in the left menu 24ms

When I follow the left menu "Admin > Hub Configuration" 68ms

Then I should see a "Peripherals Configuration" text 65ms

And I should see a "Peripherals Configuration" link in the left menu 24ms

And I should see a "Hub Details" link in the left menu 26ms

And I should see a "Access Tokens" link in the left menu 26ms

When I follow the left menu "Admin > Task Engine Status" 70ms

Then I should see a "Last Execution Times" link in the left menu 24ms

And I should see a "Runtime Status" link in the left menu 21ms

When I follow the left menu "Patches > Patch List" 129ms

Then I should see a "Patches Relevant to Your Systems" text in the content area 215ms

And I should not see a "The following patch list represents all patches accessible by your organization." text in the content area 207ms

When I follow the left menu "Configuration > Files" 155ms

Then I should see a "Centrally-Managed Configuration Files" text in the content area 18ms

And I should not see a "Locally Managed Configuration Files" text in the content area 17ms

When I follow the left menu "Software > Manage" 126ms

Then I should see a "Software Channel Management" text in the content area 54ms

When I follow the left menu "Software > Manage > Channels" 83ms

Then I should see a "Software Channel Management" text in the content area 54ms

When I am on the Systems page 299ms

Then I should see a "Systems" text in the content area 29ms

And I should see a "All" link in the left menu 25ms

And I should see a "Systems" link in the left menu 27ms

And I should see a "System Groups" link in the left menu 23ms

And I should see a "System Set Manager" link in the left menu 29ms

And I should see a "Advanced Search" link in the left menu 20ms

And I should see a "Activation Keys" link in the left menu 23ms

And I should see a "Stored Profiles" link in the left menu 23ms

And I should see a "Custom System Info" link in the left menu 23ms

And I should see a "Autoinstallation" link in the left menu 23ms

And I should see a "Download CSV" link 11ms

And I should see a Sign Out link 7ms

When I follow the left menu "Systems > System List" 95ms

Then I should see a "All" link in the left menu 23ms

And I should see a "Virtual Systems" link in the left menu 23ms

And I should see a "Duplicate Systems" link in the left menu 23ms

And I should see a "System Currency" link in the left menu 23ms

And I should see a "System Types" link in the left menu 23ms

And I should see a "Systems" text 73ms

When I follow the left menu "Systems > System List > Virtual Systems" 83ms

Then I should see a "Virtual Systems" text 75ms

And the current path is "/rhn/manager/systems/list/virtual" 3ms

When I follow the left menu "Systems > System List > Duplicate Systems" 86ms

Then I should see a "Duplicate Systems" text 72ms

And the current path is "/rhn/systems/DuplicateIPList.do" 2ms

And I should see a "Duplicate IP Address" link 12ms

And I should see a "Duplicate Hostname" link 11ms

And I should see a "Duplicate IPv6 Address" link 11ms

And I should see a "Duplicate MAC Address" link 11ms

When I follow the left menu "Systems > System List > System Currency" 78ms

Then I should see a "System Currency Report" text 99ms

And the current path is "/rhn/systems/SystemCurrency.do" 2ms

When I follow the left menu "Systems > System List > System Types" 81ms

Then I should see a "System Types" text 120ms

And I should see a "Management:" text 108ms

And I should see a "Salt:" text 112ms

And I should see a "Foreign:" text 132ms

And I should see a "Virtualization Host:" text 110ms

And the current path is "/rhn/systems/SystemEntitlements.do" 2ms

When I follow the left menu "Systems > System Groups" 72ms

Then I should see a "System Groups" text 62ms

And I should see a "Create Group" link 13ms

And I should see a "Your organization has no system groups." text 58ms

When I follow the left menu "Systems > System Set Manager > Overview" 474ms

Then I should see a "System Set Manager" text 85ms

And I should see a "Task Log" link in the left menu 23ms

And I should see a "Overview" link in the content area 21ms

And I should see a "Systems" link in the content area 19ms

And I should see a "Patches" link in the content area 25ms

And I should see a "Packages" link in the content area 25ms

And I should see a "Groups" link in the content area 23ms

And I should see a "Channels" link in the content area 19ms

And I should see a "Configuration" link in the content area 19ms

And I should see a "Provisioning" link in the content area 23ms

And I should see a "Misc" link in the content area 22ms

When I follow the left menu "Systems > Advanced Search" 69ms

Then I should see a "Advanced Search" text 72ms

When I follow the left menu "Systems > Activation Keys" 68ms

Then I should see a "Activation Keys" text 81ms

And I should see a "Create Key" link 13ms

And I should see a "The following activation keys have been created for use by your organization." text 77ms

When I follow the left menu "Systems > Stored Profiles" 67ms

Then I should see a "Stored Profiles" text 63ms

And I should see a "No stored profiles." text 56ms

When I follow the left menu "Systems > Custom System Info" 68ms

Then I should see a "Custom System Info Keys" text 56ms

And I should see a "Create Key" link 9ms

And I should see a "No Custom Info Keys Found" text 56ms

When I follow the left menu "Systems > Autoinstallation > Overview" 132ms

Then I should see a "Autoinstallation Overview" text 73ms

And I should see a "Profiles" link in the left menu 20ms

And I should see a "Unprovisioned" link in the left menu 26ms

And I should see a "GPG and SSL Keys" link in the left menu 22ms

And I should see a "Distributions" link in the left menu 25ms

And I should see a "File Preservation" link in the left menu 23ms

And I should see a "Autoinstallation Snippets" link in the left menu 22ms

And I should see a "Create Kickstart Profile" link 11ms

And I should see a "Upload Kickstart/AutoYaST File" link 11ms

And I should see a "View a List of Autoinstallation Profiles" link 12ms

And I should see a "Create a New Kickstart Profile" link 12ms

And I should see a "Upload a New Kickstart/AutoYaST File" link 11ms

When I follow the left menu "Systems > Autoinstallation > Profiles" 88ms

Then I should see a "Autoinstallation Profiles" text 70ms

And I should see a "Create Kickstart Profile" link 10ms

And I should see a "Upload Kickstart/AutoYaST File" link 8ms

When I follow the left menu "Systems > Autoinstallation > Unprovisioned" 78ms

Then I should see a "Unprovisioned Autoinstallation By IP" text 65ms

And I should see a "No Ip Ranges Found" text 63ms

When I follow the left menu "Systems > Autoinstallation > GPG and SSL Keys" 75ms

Then I should see a "GPG Public Keys and SSL Certificates" text 68ms

And I should see a "Create Stored Key/Cert" link 30ms

And I should see a "Reference Guide" link 25ms

And I should see a "RHN-ORG-TRUSTED-SSL-CERT" link 13ms

When I follow the left menu "Systems > Autoinstallation > Distributions" 79ms

Then I should see a "Autoinstallable Distributions" text 64ms

And I should see a "No autoinstallable distributions available." text 60ms

And I should see a "Create Distribution" link 11ms

When I follow the left menu "Systems > Autoinstallation > File Preservation" 76ms

Then I should see a "File Preservation" text 60ms

And I should see a "Reference Guide" link 8ms

And I should see a "Create File Preservation List" link 11ms

When I follow the left menu "Systems > Autoinstallation > Autoinstallation Snippets" 83ms

Then I should see a "Autoinstallation Snippets" text 64ms

And I should see a "No autoinstallation snippets found." text 63ms

And I should see a "Create Snippet" link 12ms

And I should see a "Default Snippets" link in the content area 22ms

And I should see a "Custom Snippets" link in the content area 21ms

And I should see a "All Snippets" link in the content area 21ms

When I follow the left menu "Systems > Autoinstallation > Profiles" 77ms

And I follow "Create Kickstart Profile" 304ms

Then I should see a "Step 1: Create Kickstart Profile" text 70ms

When I follow the left menu "Systems > Autoinstallation > Profiles" 72ms

And I follow "Upload Kickstart/AutoYaST File" 225ms

Then I should see a "Create Autoinstallation Profile" text 82ms

And I should see a "File Contents:" text 72ms

And I should see a "Autoinstallation Details" text 68ms

When I follow the left menu "Systems > Autoinstallation > Distributions" 73ms

And I follow "Create Distribution" 309ms

Then I should see a "Create Autoinstallable Distribution" text 67ms

And I should see a "Distribution Label" text 68ms

Given I am authorized 1s 831ms

When I follow the left menu "Software > Channel List > All" 185ms

And I follow "Show All Child Channels" 79ms

And I follow "Fake-RPM-SUSE-Channel" 597ms

And I follow "Packages" 504ms

And I follow "virgo-dummy-2.0-1.1.noarch" 562ms

Then I should see a "virgo-dummy-2.0-1.1.src.rpm" text 68ms

When I follow the left menu "Software > Channel List > All" 123ms

And I follow "Show All Child Channels" 47ms

And I follow "Fake-RPM-SUSE-Channel" 599ms

And I follow "Packages" 497ms

And I follow "blackhole-dummy-1.0-1.1.x86_64" 771ms

Then I should see a "blackhole-dummy-1.0-1.1.src.rpm" text 69ms

In order to change my password
As an authorized user
I want enter a new password

Given I am authorized for the "Admin" section 1s 860ms

When I follow the left menu "Home > User Account > My Account" 138ms

And I enter "GoodPass" as "desiredpassword" 60ms

And I enter "GoodPass" as "desiredpasswordConfirm" 66ms

And I click on "Update" 448ms

Then I should see a "User information updated" text 72ms

When I sign out 366ms

And I enter "admin" as "username" 50ms

And I enter "GoodPass" as "password" 62ms

And I click on "Sign In" 56ms

Then I should be logged in 361ms

When I follow the left menu "Home > User Account > My Account" 130ms

And I enter "admin" as "desiredpassword" 52ms

And I enter "admin" as "desiredpasswordConfirm" 51ms

And I click on "Update" 443ms

Then I should see a "User information updated" text 73ms

When I sign out 551ms

And I enter "admin" as "username" 51ms

And I enter "admin" as "password" 55ms

And I click on "Sign In" 55ms

Then I should be logged in 373ms

When I follow the left menu "Home > User Account > My Account" 121ms

And I enter "A" as "desiredpassword" 49ms

And I enter "A" as "desiredpasswordConfirm" 46ms

And I click on "Update" 312ms

Then I should see a "Passwords must be at least 4 characters." text 71ms

When I sign out 317ms

And I enter "admin" as "username" 53ms

And I enter "A" as "password" 49ms

And I click on "Sign In" 57ms

Then I should not be authorized 10s 6ms

@scope_configuration_channels
Feature:Clone a channel 40s 428ms 12

Given I am authorized 10s 785ms

When I follow the left menu "Software > Manage > Channels" 196ms

And I follow "Clone Channel" 651ms

And I select "Fake-RPM-SUSE-Channel" as the origin channel 76ms

And I choose "original" 53ms

And I click on "Clone Channel" 453ms

And I enter "Fake-Clone-RPM-SLES15SP7-Channel" as "Channel Name" 126ms

And I should see a "Create Software Channel" text 83ms

And I should see a "Original state of the channel" text 76ms

And I click on "Clone Channel" 795ms

Then I should see a "Fake-Clone-RPM-SLES15SP7-Channel" text 80ms

When I follow the left menu "Software > Manage > Channels" 79ms

And I follow "Fake-Clone-RPM-SLES15SP7-Channel" 588ms

And I follow "Patches" in the content area 72ms

And I follow "List/Remove Patches" 628ms

Then I should see a "There are no patches associated with this channel." text 61ms

When I follow the left menu "Software > Manage > Channels" 69ms

And I follow "Clone Channel" 468ms

And I select "Fake-RPM-SUSE-Channel" as the origin channel 54ms

And I choose "current" 50ms

And I click on "Clone Channel" 439ms

And I enter "Fake-Clone-2-RPM-SLES15SP7-Channel" as "Channel Name" 125ms

And I should see a "Create Software Channel" text 78ms

And I should see a "Current state of the channel" text 75ms

And I click on "Clone Channel" 829ms

Then I should see a "Fake-Clone-2-RPM-SLES15SP7-Channel" text 74ms

When I follow the left menu "Software > Manage > Channels" 76ms

And I follow "Fake-Clone-2-RPM-SLES15SP7-Channel" 587ms

And I follow "Patches" in the content area 59ms

And I follow "List/Remove Patches" 755ms

Then I should see a "CL-hoag-dummy-7890" link 14ms

And I should see a "CL-virgo-dummy-3456" link 11ms

And I should see a "CL-milkyway-dummy-2345" link 12ms

And I should see a "CL-andromeda-dummy-6789" link 12ms

When I follow the left menu "Software > Manage > Channels" 72ms

And I follow "Clone Channel" 466ms

And I select "Fake-RPM-SUSE-Channel" as the origin channel 55ms

And I choose "select" 55ms

And I click on "Clone Channel" 471ms

And I enter "Fake-Clone-3-RPM-SLES15SP7-Channel" as "Channel Name" 121ms

And I should see a "Create Software Channel" text 82ms

And I should see a "Select patches" text 78ms

And I click on "Clone Channel" 1s 360ms

And I should see a "Fake-Clone-3-RPM-SLES15SP7-Channel" text 90ms

And I should see a "Channel Fake-Clone-3-RPM-SLES15SP7-Channel cloned from channel Fake-RPM-SUSE-Channel." text 91ms

And I should see a "You may now wish to clone the patches associated with Fake-RPM-SUSE-Channel." text 85ms

And I check the row with the "hoag-dummy-7890" link 65ms

And I check the row with the "virgo-dummy-3456" link 56ms

And I click on "Clone Patches" 1s 265ms

And I click on "Confirm" 1s 88ms

Then I should see a "CL-hoag-dummy-7890" link 8ms

And I should see a "CL-virgo-dummy-3456" link 8ms

When I follow the left menu "Patches > Patch List > All" 186ms

And I enter "dummy" as the filtered synopsis 44ms

And I click on the filter button 692ms

And I select "500" from "1154021400_PAGE_SIZE_LABEL" 509ms

Then I should see a "CL-hoag-dummy-7890" link 11ms

And I should see a "CL-virgo-dummy-3456" link 9ms

And I should see a "CL-milkyway-dummy-2345" link 8ms

And I should see a "CL-andromeda-dummy-6789" link 8ms

When I follow the left menu "Patches > Patch List > All" 83ms

And I enter "dummy" as the filtered synopsis 39ms

And I click on the filter button 702ms

And I select "500" from "1154021400_PAGE_SIZE_LABEL" 491ms

And I follow "CL-hoag-dummy-7890" 561ms

Then I should see a "CL-hoag-dummy-7890 - Security Advisory" text 62ms

And I should see a "mcalmer" text 60ms

And I should see a "https://bugzilla.opensuse.org/show_bug.cgi?id=704608" link 11ms

When I follow the left menu "Patches > Patch List > All" 94ms

And I enter "dummy" as the filtered synopsis 45ms

And I click on the filter button 678ms

And I select "500" from "1154021400_PAGE_SIZE_LABEL" 501ms

And I follow "CL-virgo-dummy-3456" 429ms

Then I should see a "CL-virgo-dummy-3456 - Bug Fix Advisory" text 67ms

And I should see a "mcalmer" text 60ms

And I should see a "CVE-1999-9998" link 32ms

When I follow the left menu "Software > Manage > Channels" 186ms

And I follow "Fake-Clone-2-RPM-SLES15SP7-Channel" 587ms

And I follow "Packages" in the content area 71ms

And I follow "Compare" 2s 46ms

And I select "Fake-Clone-3-RPM-SLES15SP7-Channel" from "selected_channel" 67ms

And I click on "View Packages" 566ms

Then I should see a "andromeda-dummy" text 94ms

And I should see a "2.0-1.1" link 15ms

And I should see a "This channel only" text 90ms

When I follow the left menu "Software > Manage > Channels" 77ms

And I follow "Fake-Clone-RPM-SLES15SP7-Channel" 777ms

And I follow "Delete Channel" 400ms

And I check "unsubscribeSystems" 102ms

And I click on "Delete Channel" 744ms

Then I should see a "Fake-Clone-RPM-SLES15SP7-Channel" text 64ms

And I should see a "has been deleted." text 61ms

Given I follow the left menu "Software > Manage > Channels" 80ms

When I follow "Fake-Clone-2-RPM-SLES15SP7-Channel" 576ms

And I follow "Delete Channel" 396ms

And I check "unsubscribeSystems" 69ms

And I click on "Delete Channel" 1s 676ms

Then I should see a "Fake-Clone-2-RPM-SLES15SP7-Channel" text 70ms

And I should see a "has been deleted." text 60ms

Given I follow the left menu "Software > Manage > Channels" 78ms

When I follow "Fake-Clone-3-RPM-SLES15SP7-Channel" 571ms

And I follow "Delete Channel" 398ms

And I check "unsubscribeSystems" 69ms

And I click on "Delete Channel" 704ms

Then I should see a "Fake-Clone-3-RPM-SLES15SP7-Channel" text 63ms

And I should see a "has been deleted." text 62ms

In order to register systems to the spacewalk server
As the testing user
I want to create and edit activation keys

Given I am authorized 1s 956ms

When I follow the left menu "Systems > Activation Keys" 124ms

And I follow "Create Key" 442ms

And I wait until I do not see "Loading..." text 369ms

And I enter "SUSE Test Key i586" as "description" 73ms

And I enter "SUSE-TEST-i586" as "key" 69ms

And I check "virtualization_host" 83ms

And I click on "Create Activation Key" 63ms

Then I should see a "Activation key SUSE Test Key i586 has been created." text 73ms

When I follow the left menu "Systems > Activation Keys" 64ms

And I follow "SUSE Test Key i586" 341ms

And I wait until I do not see "Loading..." text 402ms

And I enter "20" as "usageLimit" 56ms

And I click on "Update Activation Key" 716ms

Then I wait until I see "Activation key SUSE Test Key i586 has been modified." text 74ms

And I should see "20" in field identified by "usageLimit" 26ms

When I follow the left menu "Systems > Activation Keys" 67ms

And I follow "SUSE Test Key i586" 357ms

And I wait until I do not see "Loading..." text 550ms

And I select "Fake-Base-Channel-i586" from "selectedBaseChannel" 75ms

And I click on "Update Activation Key" 670ms

Then I wait until I see "Activation key SUSE Test Key i586 has been modified." text 73ms

When I follow the left menu "Systems > Activation Keys" 72ms

And I follow "SUSE Test Key i586" in the content area 70ms

And I wait until I do not see "Loading..." text 469ms

And I follow "Delete Key" 318ms

And I click on "Delete Activation Key" 495ms

Then I should see a "Activation key SUSE Test Key i586 has been deleted." text 76ms

When I follow the left menu "Systems > Activation Keys" 70ms

And I follow "Create Key" 332ms

And I wait until I do not see "Loading..." text 146ms

And I enter "SUSE Test PKG Key i586" as "description" 79ms

And I enter "SUSE-TEST-2-i586" as "key" 70ms

And I enter "20" as "usageLimit" 53ms

And I select "Fake-Base-Channel-i586" from "selectedBaseChannel" 53ms

And I click on "Create Activation Key" 864ms

And I follow "Packages" 324ms

And I enter "sed" as "packages" 49ms

And I click on "Update Activation Key" 506ms

Then I should see a "Activation key SUSE Test PKG Key i586 has been modified." text 57ms

When I follow the left menu "Systems > Activation Keys" 63ms

And I follow "SUSE Test PKG Key i586" in the content area 75ms

And I follow "Delete Key" 297ms

And I click on "Delete Activation Key" 535ms

Then I should see a "Activation key SUSE Test PKG Key i586 has been deleted." text 83ms

When I follow the left menu "Systems > Activation Keys" 0s

And I follow "Create Key" 0s

And I wait until I do not see "Loading..." text 0s

And I enter "SUSE Test PKG Key x86_64" as "description" 0s

And I enter "SUSE-TEST-x86_64" as "key" 0s

And I enter "20" as "usageLimit" 0s

And I select "SLE-Product-SLES15-SP7-Pool for x86_64" from "selectedBaseChannel" 0s

And I click on "Create Activation Key" 0s

And I follow "Packages" 0s

And I enter "sed" as "packages" 0s

And I click on "Update Activation Key" 0s

Then I should see a "Activation key SUSE Test PKG Key x86_64 has been modified." text 0s

When I follow the left menu "Systems > Activation Keys" 66ms

And I follow "Create Key" 343ms

And I wait until I do not see "Loading..." text 293ms

And I enter "SUSE Test PKG Key x86_64" as "description" 78ms

And I enter "SUSE-TEST-x86_64" as "key" 72ms

And I enter "20" as "usageLimit" 48ms

And I select "openSUSE Tumbleweed (x86_64)" from "selectedBaseChannel" 64ms

And I click on "Create Activation Key" 1s 113ms

And I follow "Packages" 395ms

And I enter "sed" as "packages" 47ms

And I click on "Update Activation Key" 53ms

Then I should see a "Activation key SUSE Test PKG Key x86_64 has been modified." text 487ms

When I follow the left menu "Systems > Activation Keys" 65ms

And I follow "SUSE Test PKG Key x86_64" in the content area 71ms

And I follow "Delete Key" 305ms

And I click on "Delete Activation Key" 56ms

Then I should see a "Activation key SUSE Test PKG Key x86_64 has been deleted." text 77ms

Then I should get some activation keys 397ms

When I create an activation key with id "testkey", description "Key for testing", limit of 10 and contact method "default" 795ms

Then I should get the new activation key "1-testkey" 372ms

Key details:
entitlements: []
usage_limit: 10
universal_default: false
description: Key description
base_channel_label: none
child_channel_labels: []
app_streams: {}
packages: []
server_group_ids: []
contact_method: default
package_names: []
disabled: false
key: 1-testkey

When I set the description of the activation key "1-testkey" to "Key description" 348ms

Then I get the description "Key description" for the activation key "1-testkey" 358ms

When I delete the activation key "1-testkey" 1s 79ms

Given I am not authorized 413ms

When I go to the home page 136ms

Then I should see a "Sign In" text 20ms

Given I am not authorized 10s 203ms

When I go to the home page 137ms

And I follow "API Documentation" 148ms

Then I should see a "API Overview" text 56ms

Given I am authorized 0s

When I follow the left menu "Help" 0s

And I switch to last opened window 0s

Then I should see a "SUSE Multi-Linux Manager Guides" text 0s

When I click on the Legal button 0s

And I wait until I see "Copyright Notice" text 0s

And I follow "Copyright Notice" 0s

Then I should see a "Copyright Notice" text 0s

And I should see a "SUSE Multi-Linux Manager LICENSE AGREEMENT" text 0s

When I close the last opened window 0s

Given I am authorized 0s

When I follow the left menu "Help" 0s

And I switch to last opened window 0s

Then I should see a "SUSE Multi-Linux Manager Guides" text 0s

When I click on the Legal button 0s

And I wait until I see "End User License Agreement" text 0s

And I follow "End User License Agreement" 0s

Then I should see a "End User License Agreement" text 0s

And I should see a "End User License Agreement for SUSE Software" text 0s

When I close the last opened window 0s

Given I am not authorized 10s 231ms

When I go to the home page 194ms

And I enter "testing" as "username" 65ms

And I enter "testing" as "password" 61ms

And I click on "Sign In" 64ms

Then I should be logged in 466ms

Given I am authorized 4s 231ms

When I sign out 961ms

Then I should not be authorized 10s 13ms

Given I am authorized for the "Admin" section 10s 729ms

When I go to the home page 986ms

And I should see a "Manage" link 17ms

And I should see a "admin" text 53ms

And I should see a "SUSE Test" link 12ms

And I should see a "Preferences" link 12ms

And I should see a Sign Out link 7ms

Given I am authorized as "testing" with password "testing" 2s 767ms

Then I should see a "Home" link 12ms

And I should see a "Systems" link 14ms

And I should see a "Salt" link 11ms

And I should see a "Images" link 11ms

And I should see a "Patches" link 14ms

And I should see a "Software" link 11ms

And I should see a "Content Lifecycle" link 11ms

And I should see a "Audit" link 11ms

And I should see a "Configuration" link 14ms

And I should see a "Schedule" link 12ms

And I should see a "Users" link 11ms

And I should not see a "Admin" link 8ms

And I should see a "Help" link 12ms

And I should see a "External Links" link 11ms

Given I am authorized for the "Admin" section 2s 890ms

Then I should see a "Home" link 9ms

And I should see a "Systems" link 10ms

And I should see a "Salt" link 9ms

And I should see a "Images" link 8ms

And I should see a "Patches" link 9ms

And I should see a "Software" link 8ms

And I should see a "Audit" link 7ms

And I should see a "Configuration" link 10ms

And I should see a "Schedule" link 9ms

And I should see a "Users" link 8ms

And I should see a "Admin" link 9ms

And I should see a "Help" link 8ms

And I should see a "External Links" link 8ms

Given I am authorized 2s 702ms

Then I should see a "Tasks" text 528ms

And I should see a "Inactive Systems" text 65ms

And I should see a "Most Critical Systems" text 63ms

And I should see a "Recently Scheduled Actions" text 388ms

And I should see a "Relevant Security Patches" text 124ms

And I should see a "System Group Name" text 129ms

And I should see a "Recently Registered Systems" text 125ms

When I call user.list_users() 7s 800ms

Then I should get at least user "admin" < 1ms

When I call user.list_roles() on user "admin" 360ms

Then I should get at least one role that matches "_admin" suffix < 1ms

When I make sure "testuser" is not present 7s 632ms

And I call user.create() with login "testuser" 1s 376ms

And I call user.list_users() 7s 160ms

Then I should get at least user "testuser" < 1ms

When I call user.add_role() on "testuser" with the role "org_admin" 356ms

And I call user.list_roles() on user "testuser" 415ms

Then I should get role "org_admin" < 1ms

When I call user.remove_role() on "testuser" with the role "org_admin" 424ms

And I call user.list_roles() on user "testuser" 433ms

Then I should not get role "org_admin" < 1ms

When I delete user "testuser" 425ms

In order to distribute software to the clients
As an authorized user
I want to download packages from the channels

Given I try to download "virgo-dummy-2.0-1.1.noarch.rpm" from channel "fake-rpm-suse-channel" 27ms

Then the download should get a 403 response < 1ms

e9602b2591a20eaa18b8b2ee17271c299e39f52e924a93450f81cd22241389d2

Given I have a valid token for organization "1" 2s 818ms

When I try to download "virgo-dummy-2.0-1.1.noarch.rpm" from channel "fake-rpm-suse-channel" 52ms

Then the download should get no error < 1ms

ed46182dc0e49b0f6653fb5d3055561b41b2930f10bd674c4d35cfb29354438bbac078d722319021b379af3c434c66f47b300937c4dd99ef4b614e193efe93c6

Given I have an invalid token for organization "1" < 1ms

When I try to download "virgo-dummy-2.0-1.1.noarch.rpm" from channel "fake-rpm-suse-channel" 30ms

Then the download should get a 403 response < 1ms

e9602b2591a20eaa18b8b2ee17271c299e39f52e924a93450f81cd22241389d2

Given I have an expired valid token for organization "1" 4s 509ms

When I try to download "virgo-dummy-2.0-1.1.noarch.rpm" from channel "fake-rpm-suse-channel" 29ms

Then the download should get a 403 response < 1ms

e9602b2591a20eaa18b8b2ee17271c299e39f52e924a93450f81cd22241389d2

Given I have a valid token expiring tomorrow for organization "1" 2s 517ms

When I try to download "virgo-dummy-2.0-1.1.noarch.rpm" from channel "fake-rpm-suse-channel" 33ms

Then the download should get no error < 1ms

e9602b2591a20eaa18b8b2ee17271c299e39f52e924a93450f81cd22241389d2

Given I have a not yet usable valid token for organization "1" 2s 548ms

When I try to download "virgo-dummy-2.0-1.1.noarch.rpm" from channel "fake-rpm-suse-channel" 27ms

Then the download should get a 403 response < 1ms

e9602b2591a20eaa18b8b2ee17271c299e39f52e924a93450f81cd22241389d2

Given I have a valid token for organization "1" and channel "foobar" 2s 512ms

When I try to download "virgo-dummy-2.0-1.1.noarch.rpm" from channel "fake-rpm-suse-channel" 29ms

Then the download should get a 403 response < 1ms

@scope_building_container_images @no_auth_registry
Feature:Advanced content management 23s 784ms 8

Given I am authorized as "docker" with password "docker" 1s 746ms

When I follow the left menu "Images > Stores" 137ms

And I follow "Create" 327ms

And I enter "docker_admin" as "label" 98ms

And I enter the URI of the registry as "uri" 159ms

And I click on "create-btn" 75ms

Then I wait until table row contains a "galaxy-registry" text 559ms

GITPROFILES: https://github.com/uyuni-project/uyuni.git#:testsuite/features/profiles/temporary

When I follow the left menu "Images > Profiles" 68ms

And I follow "Create" 447ms

And I enter "suse_docker_admin" as "label" 135ms

And I select "galaxy-registry" from "imageStore" 1s 133ms

And I select "1-SUSE-KEY-x86_64" from "activationKey" 1s 125ms

And I enter "Docker/serverhost" relative to profiles as "path" 1s 25ms

And I click on "create-btn" 56ms

New user norole created with roles:

Given I am authorized for the "Admin" section 1s 56ms

When I create a user with name "norole" and password "norole" with roles "" 10s 430ms

Given I am authorized as "docker" with password "docker" 1s 495ms

Given I am authorized as "docker" with password "docker" 470ms

When I follow the left menu "Images > Profiles" 124ms

And I check the row with the "suse_docker_admin" text 120ms

And I click on "Delete" 86ms

And I click on the red confirmation button 70ms

And I should see a "Image profile has been deleted." text 167ms

When I follow the left menu "Images > Stores" 64ms

And I check the row with the "docker_admin" text 123ms

And I click on "Delete" 67ms

And I click on the red confirmation button 59ms

And I should see a "Image store has been deleted." text 200ms

Given I am authorized for the "Admin" section 1s 201ms

When I delete user "norole" 945ms

In order to execute actions at a certain date
As a authorized user
I want to be able to easily pick dates

Given I am authorized 1s 680ms

And I am on the Systems overview page of this "sle_minion" 5s 861ms

When I follow "Remote Command" in the content area 78ms

And I open the date picker 83ms

Then the date picker title should be the current month and year 10s 19ms

When I follow "Details" in the content area 93ms

And I follow "Remote Command" in the content area 60ms

And I enter "ls" as "Script" 101ms

And I pick "2022-08-27" as date 106ms

And I pick "17:30" as time 128ms

Then the date field should be set to "2022-08-27" 38ms

And the time field should be set to "17:30" 40ms

And the date picker should be closed 4ms

Given I am authorized 2s 131ms

When I follow the left menu "Systems > System Groups" 139ms

When I follow "Create Group" 279ms

And I enter "sles" as "name" 50ms

And I enter "SLES systems" as "description" 62ms

And I click on "Create Group" 499ms

Then I should see a "System group sles created." text 71ms

When I follow the left menu "Systems > System Groups" 69ms

When I follow "sles" 323ms

And I follow "Target Systems" 538ms

And I check the "sle_minion" client 64ms

And I click on "Add Systems" 1s 283ms

Then I should see a "added to sles server group." text 94ms

When I follow the left menu "Systems > System Groups" 64ms

When I follow "Create Group" 294ms

And I enter "rhlike" as "name" 65ms

And I enter "Red Hat-like systems" as "description" 66ms

And I click on "Create Group" 62ms

Then I should see a "System group rhlike created." text 69ms

When I follow the left menu "Systems > System Groups" 64ms

When I follow "rhlike" 308ms

And I follow "Target Systems" 484ms

And I check the "rhlike_minion" client 1s 858ms

And I click on "Add Systems" 1s 279ms

Then I should see a "1 systems were added to rhlike server group." text 92ms

When I follow the left menu "Systems > System Groups" 63ms

When I follow "Create Group" 302ms

And I enter "deblike" as "name" 51ms

And I enter "Debian-like systems" as "description" 63ms

And I click on "Create Group" 55ms

Then I should see a "System group deblike created." text 65ms

When I follow the left menu "Systems > System Groups" 64ms

When I follow "deblike" 272ms

And I follow "Target Systems" 445ms

And I check the "deblike_minion" client 4s 232ms

And I click on "Add Systems" 1s 148ms

Then I should see a "1 systems were added to deblike server group." text 96ms

When I follow the left menu "Systems > System Groups" 64ms

When I click on "Use in SSM" in row "sles" 74ms

And I should see a "Selected Systems List" text 71ms

And I should see "sle_minion" as link 17ms

When I follow the left menu "Systems > System Groups" 61ms

When I check "sles" in the list 75ms

And I check "rhlike" in the list 58ms

And I click on "Work With Union" 514ms

And I should see "sle_minion" as link 13ms

And I should see "rhlike_minion" as link 15ms

When I follow the left menu "Systems > System Groups" 65ms

When I check "sles" in the list 65ms

And I check "rhlike" in the list 52ms

And I click on "Work With Intersection" 408ms

And I should not see a "sle_minion" link 8ms

And I should not see a "rhlike_minion" link 7ms

When I follow the left menu "Systems > System Groups" 60ms

When I check "sles" in the list 54ms

And I check "deblike" in the list 58ms

And I click on "Work With Union" 478ms

And I should see "sle_minion" as link 11ms

And I should see "deblike_minion" as link 14ms

When I follow the left menu "Systems > System Groups" 63ms

When I check "sles" in the list 55ms

And I check "deblike" in the list 52ms

And I click on "Work With Intersection" 417ms

And I should not see a "sle_minion" link 4ms

And I should not see a "deblike_minion" link 7ms

When I follow the left menu "Systems > System Groups" 60ms

When I follow "sles" in the content area 76ms

And I follow "Delete Group" in the content area 66ms

And I click on "Confirm Deletion" 1s 117ms

Then I should see a "deleted" text 69ms

When I follow the left menu "Systems > System Groups" 70ms

When I follow "rhlike" in the content area 65ms

And I follow "Delete Group" in the content area 63ms

And I click on "Confirm Deletion" 53ms

Then I should see a "deleted" text 74ms

When I follow the left menu "Systems > System Groups" 67ms

When I follow "deblike" in the content area 64ms

And I follow "Delete Group" in the content area 59ms

And I click on "Confirm Deletion" 1s 135ms

Then I should see a "deleted" text 57ms

@scope_visualization @scope_onboarding
Feature:Custom system info key-value pairs 14s 119ms 7

Given I am authorized 1s 836ms

When I follow the left menu "Systems > Custom System Info" 124ms

And I follow "Create Key" 341ms

And I should see a "Create Custom Info Key" text 54ms

And I enter "key-label" as "label" 59ms

And I enter "key-desc" as "description" 62ms

And I click on "Create Key" 495ms

Then I should see a "Successfully added 1 custom key." text 62ms

When I follow the left menu "Systems > System List > All" 139ms

And I follow this "sle_minion" link 1s 139ms

And I follow "Custom Info" 550ms

And I follow "Create Value" 527ms

And I follow "key-label" 533ms

And I enter "key-value" as "value" 56ms

And I click on "Update Key" 629ms

Then I should see a "key-label" text 68ms

And I should see a "key-value" link 13ms

When I follow the left menu "Systems > System List > All" 131ms

And I follow this "sle_minion" link 1s 18ms

And I follow "Custom Info" 450ms

And I follow "key-value" 384ms

And I should see a "Edit Custom Value" text 66ms

And I enter "key-value-edited" as "value" 69ms

And I click on "Update Key" 573ms

Then I should see a "key-label" text 72ms

And I should see a "key-value-edited" link 12ms

When I follow the left menu "Systems > Custom System Info" 65ms

And I follow "key-label" 289ms

And I enter "key-desc-edited" as "description" 97ms

And I click on "Update Key" 345ms

Then I should see a "key-label" link 12ms

And I should see a "key-desc-edited" text 59ms

When I follow the left menu "Systems > Custom System Info" 61ms

And I follow "key-label" 271ms

And I follow this "sle_minion" link 614ms

And I follow "Custom Info" 456ms

And I follow "key-value-edited" 453ms

And I follow "Delete Value" 436ms

And I click on "Remove Value" 624ms

Then I should see a "No custom information defined for this system." text 65ms

When I follow the left menu "Systems > Custom System Info" 65ms

And I follow "key-label" 321ms

And I follow "Delete Key" 282ms

And I click on "Delete Key" 57ms

Then I should not see a "key-label" text 62ms

In order to be secure
As an authorized user
I want to avoid session and other attacks

When I retrieve a "css" static resource 22ms

Then the response header "ETag" should not be present < 1ms

And the response header "Pragma" should not be present < 1ms

And the response header "Expires" should not be "0" < 1ms

And the response header "Set-Cookie" should not be present < 1ms

And the response header "X-Frame-Options" should contain "SAMEORIGIN" < 1ms

And the response header "X-XSS-Protection" should be "1; mode=block" < 1ms

And the response header "X-Content-Type-Options" should be "nosniff" < 1ms

And the response header "X-Permitted-Cross-Domain-Policies" should be "master-only" < 1ms

Given I retrieve a "javascript" static resource 20ms

Then the response header "X-WebKit-CSP" should not be present < 1ms

In order to operate Uyuni based on Salt
I want to use general Salt functionality and system registration

When I get the contents of the remote file "/etc/salt/master.d/susemanager.conf" 2s 986ms

Then it should contain a "rest_cherrypy:" text < 1ms

And it should contain a "port: 9080" text < 1ms

And it should contain a "external_auth:" text < 1ms

Then salt-api should be listening on local port 9080 2s 531ms

And salt-master should be listening on public port 4505 2s 654ms

And salt-master should be listening on public port 4506 4s 62ms

When I run "ls /srv/susemanager/salt/top.sls" on "server" without error control 2s 520ms

Then the command should fail < 1ms

When I run "ls /srv/susemanager/salt/top.sls" on "server" without error control 2s 571ms

Then the command should fail < 1ms

When I run "ls /srv/susemanager/pillar/top.sls" on "server" without error control 2s 620ms

Then the command should fail < 1ms

When I run "ls /usr/share/susemanager/salt/top.sls" on "server" without error control 2s 510ms

Then the command should fail < 1ms

When I run "ls /usr/share/susemanager/pillar/top.sls" on "server" without error control 4s 301ms

Then the command should fail < 1ms

@scope_configuration_channels
Feature:The channels page 22s 754ms 8

In Order to use the channels page and its subpages
As an authorized user
I want to see all the texts and links

Given I am authorized 10s 788ms

When I follow the left menu "Software > Channel List > All" 192ms

Then I should see a "Full Software Channel List" text 104ms

And I should see a "Channel List" link in the left menu 26ms

And I should see a "All" link in the left menu 27ms

And I should see a "Popular" link in the left menu 23ms

And I should see a "My Channels" link in the left menu 22ms

And I should see a "Shared" link in the left menu 22ms

And I should see a "Retired" link in the left menu 22ms

And I should see a "Package Search" link in the left menu 22ms

And I should see a "Manage" link in the left menu 25ms

And I should see a "All" link in the content area 23ms

And I should see a "Popular" link in the content area 18ms

And I should see a "My Channels" link in the content area 18ms

And I should see a "Shared" link in the content area 17ms

And I should see a "Retired" link in the content area 18ms

When I follow the left menu "Software > Channel List > Popular" 75ms

Then I should see a "Popular" text 66ms

When I follow the left menu "Software > Channel List > All" 70ms

And I follow "Show All Child Channels" 55ms

And I follow "Fake-RPM-SUSE-Channel" 597ms

And I follow "Packages" 588ms

Then I should see package "andromeda-dummy-2.0-1.1.noarch" 88ms

And I should see package "hoag-dummy-1.1-1.1.i586" 90ms

And I should see package "hoag-dummy-1.1-1.1.x86_64" 85ms

And I should see package "milkyway-dummy-2.0-1.1.i586" 84ms

And I should see package "milkyway-dummy-2.0-1.1.x86_64" 88ms

And I should see package "virgo-dummy-2.0-1.1.noarch" 84ms

When I follow the left menu "Software > Channel List > All" 71ms

And I follow "Show All Child Channels" 47ms

And I follow "Fake-RPM-SUSE-Channel" 749ms

And I follow "Packages" 575ms

And I follow "andromeda-dummy-2.0-1.1.noarch" 555ms

Then I should see a "This is the andromeda dummy package used for testing SUSE Manager" text 67ms

And I should see a "Fake-RPM-SUSE-Channel" link 11ms

And I should see a "build.opensuse.org" text 74ms

And I should see a "SHA512sum:" text 68ms

And I should see a "packages/1/199/andromeda-dummy/2.0-1.1/noarch/19940cc4a9f0d38a038a4455b0f1cf1290c4a4296b27f5a62f4aae60585ac6e2677e88c3c3127d487116ed8d9b1787379e23aafac46bc14408864926bedee693/andromeda-dummy-2.0-1.1.noarch.rpm" text 69ms

When I follow the left menu "Software > Channel List > All" 115ms

And I follow "Show All Child Channels" 52ms

And I follow "Fake-RPM-SUSE-Channel" 593ms

And I follow "Packages" 689ms

And I follow "andromeda-dummy-2.0-1.1.noarch" 553ms

And I follow "Dependencies" 389ms

Then I should see a "pam" text 54ms

And I should see a "rpmlib(PayloadIsXz) <= 5.2-1" text 52ms

And I should see a "andromeda-dummy = 2.0-1.1" text 53ms

When I follow the left menu "Software > Channel List > All" 114ms

And I follow "Show All Child Channels" 57ms

And I follow "Fake-RPM-SUSE-Channel" 584ms

And I follow "Packages" 598ms

And I follow "andromeda-dummy-2.0-1.1.noarch" 541ms

And I follow "Change Log" 297ms

Then I should see a "mc@suse.de" text 48ms

And I should see a "version 2.0" text 49ms

When I follow the left menu "Software > Channel List > All" 114ms

And I follow "Show All Child Channels" 46ms

And I follow "Fake-RPM-SUSE-Channel" 587ms

And I follow "Packages" 584ms

And I follow "andromeda-dummy-2.0-1.1.noarch" 451ms

And I follow "File List" 310ms

Then I should see a "This package contains the following files." text 58ms

And I should see a "/usr/share/doc/packages/andromeda-dummy/COPYING" text 55ms

And I should see a "sha256: 32b1062f7da84967e7019d01ab805935caa7ab7321a7ced0e30ebe75e5df1670" text 54ms

In Order to distribute software to the clients
As an authorized user
I want to manage channels

Given I am authorized 1s 882ms

When I follow the left menu "Software > Manage > Channels" 191ms

And I follow "Create Channel" 382ms

And I enter "Fake-Base-Channel-SUSE-like" as "Channel Name" 89ms

And I enter "fake-base-channel-suse-like" as "Channel Label" 90ms

And I select "None" from "Parent Channel" 58ms

And I select "x86_64" from "Architecture:" 50ms

And I enter "Base channel for testing" as "Channel Summary" 87ms

And I enter "No more desdcription for base channel." as "Channel Description" 96ms

And I click on "Create Channel" 67ms

Then I should see a "The channel name 'Fake-Base-Channel-SUSE-like' is already in use, please enter a different name" text 417ms

When I follow the left menu "Software > Manage > Channels" 82ms

And I follow "Create Channel" 386ms

And I enter "test123" as "Channel Name" 60ms

And I enter "tesT123" as "Channel Label" 62ms

And I enter "test123" as "Channel Summary" 60ms

And I click on "Create Channel" 386ms

Then I should see a "Invalid channel label, please see the format described below" text 79ms

When I follow the left menu "Software > Manage > Channels" 74ms

And I follow "Create Channel" 1s 233ms

And I enter "!test123" as "Channel Name" 61ms

And I enter "test123" as "Channel Label" 58ms

And I enter "test123" as "Channel Summary" 60ms

And I click on "Create Channel" 814ms

Then I should see a "Invalid channel name, please see the format described below" text 77ms

When I follow the left menu "Software > Manage > Channels" 75ms

And I follow "Create Channel" 387ms

And I enter "openSUSE-Leap-15.6-Pool for x86_64" as "Channel Name" 91ms

And I enter "test123" as "Channel Label" 60ms

And I enter "test123" as "Channel Summary" 60ms

And I click on "Create Channel" 304ms

Then I should see a "The channel name 'openSUSE-Leap-15.6-Pool for x86_64' is reserved, please enter a different name" text 81ms

When I follow the left menu "Software > Manage > Channels" 75ms

And I follow "Create Channel" 373ms

And I enter "test123" as "Channel Name" 75ms

And I enter "opensuse-leap-15.6-pool-x86_64" as "Channel Label" 83ms

And I enter "test123" as "Channel Summary" 58ms

And I click on "Create Channel" 60ms

Then I should see a "The channel label 'opensuse-leap-15.6-pool-x86_64' is reserved, please enter a different name" text 79ms

When I follow the left menu "Software > Manage > Channels" 76ms

And I follow "Create Channel" 366ms

And I enter "aaaSLE-12-Cloud-Compute5-Pool for x86_64" as "Channel Name" 96ms

And I enter "sle-we12aaa-pool-x86_64-sap" as "Channel Label" 79ms

And I enter "test123" as "Channel Summary" 61ms

And I click on "Create Channel" 745ms

Then I should see a "Channel aaaSLE-12-Cloud-Compute5-Pool for x86_64 created." text 75ms

When I follow the left menu "Software > Manage > Channels" 74ms

And I follow "aaaSLE-12-Cloud-Compute5-Pool for x86_64" 590ms

And I enter "openSUSE-Leap-15.6-Pool for x86_64" as "Channel Name" 129ms

And I click on "Update Channel" 70ms

Then I should see a "The channel name 'openSUSE-Leap-15.6-Pool for x86_64' is reserved, please enter a different name" text 79ms

When I follow the left menu "Software > Manage > Channels" 79ms

And I follow "aaaSLE-12-Cloud-Compute5-Pool for x86_64" 574ms

And I follow "Delete Channel" 417ms

And I check "unsubscribeSystems" 82ms

And I click on "Delete Channel" 602ms

Then I should see a "Channel aaaSLE-12-Cloud-Compute5-Pool for x86_64 has been deleted." text 93ms

In order to verify the left menu filter works properly
As an authorized user
I want to be able to search different keywords in the menu filter

Given I am authorized for the "Admin" section 1s 846ms

When I enter "Admin" as the left menu search field 83ms

Then I should see a "Admin" link in the left menu 26ms

When I enter "Formula" as the left menu search field 102ms

Then I should see a "Formula Catalog" link in the left menu 21ms

When I enter "saLT" as the left menu search field 83ms

Then I should see a "Salt" link in the left menu 22ms

When I enter "SUSE" as the left menu search field 0s

Then I should see a "SUSE" text 0s

And I should see a "SUSE Multi-Linux Manager Server" text 0s

And I should see a "SUSE Multi-Linux Manager Proxy" text 0s

When I enter "Uyuni" as the left menu search field 110ms

Then I should see a "Uyuni Server" text 44ms

And I should see a "Uyuni Proxy" text 43ms

When I enter "Null" as the left menu search field 81ms

Then I should see left menu empty 8ms

When I create the following channels: 624ms
LABEL NAME SUMMARY ARCH PARENT
foobar foobar foobar channel-x86_64

Then "foobar" should get listed with a call of listSoftwareChannels 504ms

When I create a repo with label "foobar" and url 450ms

And I associate repo "foobar" with channel "foobar" 667ms

Then channel "foobar" should have attribute "last_modified" that is a date 417ms

And channel "foobar" should not have attribute "yumrepo_last_sync" 385ms

When I create the following channels: 410ms
LABEL NAME SUMMARY ARCH PARENT
foobar-child foobar-child child of foobar channel-x86_64 foobar

Then "foobar-child" should get listed with a call of listSoftwareChannels 402ms

And "foobar" should be the parent channel of "foobar-child" 528ms

Then something should get listed with a call of listSoftwareChannels 395ms

When I delete the software channel with label "foobar-child" 518ms

Then "foobar-child" should not get listed with a call of listSoftwareChannels 406ms

When I delete the repo with label "foobar" 455ms

And I delete the software channel with label "foobar" 1s 417ms

Then "foobar" should not get listed with a call of listSoftwareChannels 425ms

Then channel "fake-child-channel-i586" should have attribute "yumrepo_last_sync" that is a date 410ms

When I verify channel "fake-base-channel-appstream" is modular via the API 404ms

And I verify channel "fake-rpm-suse-channel" is not modular via the API 369ms

When channel "Fake-Base-Channel-AppStream" is present in the modular channels listed via the API 358ms

When "scorpio" module streams "2.0, 2.1" are available for channel "fake-base-channel-appstream" via the API 430ms

In order to use the Patches page
As a authorized user
I want to see all the texts and links

Given I am authorized 1s 692ms

When I follow the left menu "Patches > Patch List > Relevant" 198ms

Then I should see a "Patches Relevant to Your Systems" text 133ms

And I should see a "Relevant" link in the left menu 23ms

And I should see a "All" link in the left menu 23ms

And I should see a "Advanced Search" link in the left menu 22ms

And I should see a "Manage Patches" link in the left menu 21ms

And I should see a "Clone Patches" link in the left menu 22ms

And I should see a "Bugfix Patches" link 11ms

And I should see a "Enhancement Patches" link 11ms

And I should see a "Security Patches" link 11ms

And I should see a Sign Out link 7ms

When I follow the left menu "Patches > Manage Patches" 70ms

And I follow "Create Patch" 341ms

When I enter "Test Patch" as "synopsis" 82ms

And I enter "Test Advisory" as "advisoryName" 86ms

And I enter "Test Product" as "product" 85ms

And I enter "test@test.org" as "errataFrom" 93ms

And I enter "Test Topic" as "topic" 83ms

And I enter "Test Description" as "description" 95ms

And I enter "Test Solution" as "solution" 90ms

And I enter "620212" as "buglistId" 71ms

And I enter "Test Summary" as "buglistSummary" 99ms

And I enter "https://bugzilla.opensuse.org/show_bug.cgi?id=620212" as "buglistUrl" 178ms

And I enter "test,keywords" as "keywords" 85ms

And I enter "Test Reference" as "refersTo" 87ms

And I enter "Test Note" as "notes" 74ms

And I check test channel 68ms

And I click on "Create Patch" 1s 106ms

Then I should see a "Patch: Test Advisory-1" text 76ms

When I follow the left menu "Patches > Manage Patches" 65ms

And I follow "Create Patch" 324ms

When I enter "Enhancement Patch" as "synopsis" 97ms

And I enter "Enhancement Advisory" as "advisoryName" 96ms

And I select "Product Enhancement Advisory" from "advisoryType" 78ms

And I enter "Enhancement Product" as "product" 98ms

And I enter "Enhancement Topic" as "topic" 89ms

And I enter "Enhancement Description" as "description" 101ms

And I enter "Enhancement Solution" as "solution" 94ms

And I enter "1234" as "buglistId" 57ms

And I enter "Enhancement Summary" as "buglistSummary" 93ms

And I enter "Enhancement,keywords" as "keywords" 97ms

And I enter "Enhancement Reference" as "refersTo" 94ms

And I enter "Enhancement Note" as "notes" 85ms

And I check test channel 56ms

And I click on "Create Patch" 1s 165ms

Then I should see a "Patch: Enhancement Advisory-1" text 75ms

When I follow the left menu "Patches > Manage Patches" 70ms

And I check "Enhancement Advisory" patch 61ms

And I click on "Delete Patches" 446ms

And I click on "Confirm" 519ms

Then I should see a "Successfully deleted 1 patches." text 111ms

When I follow the left menu "Patches > Patch List > All" 143ms

And I follow "Bugfix Patches" in the content area 101ms

And I enter "Test Patch" as the filtered synopsis 49ms

And I click on the filter button 472ms

And I follow "Test Advisory" 372ms

Then I should see a "Test Patch" text 61ms

And I should see a "test@test.org" text 60ms

And I should see a "Test Topic" text 59ms

And I should see a "Test Description" text 66ms

And I should see a "Test Solution" text 59ms

And I should see a "Fake-Base-Channel-SUSE-like" link 11ms

And I should see a "Test Summary" link 11ms

And I should see a "keywords, test" text 60ms

And I should see a "Test Reference" text 60ms

And I should see a "Test Note" text 58ms

When I follow the left menu "Software > Channel List > All" 182ms

And I follow "Fake-Base-Channel-SUSE-like" 571ms

And I follow "Patches" in the content area 67ms

Then I should see a "Test Patch" text 61ms

When I follow the left menu "Patches > Manage Patches" 111ms

And I check "Test Advisory" patch 65ms

And I click on "Delete Patches" 537ms

And I click on "Confirm" 783ms

Then I should see a "Successfully deleted 1 patches." text 107ms

@scc_credentials @scope_content_lifecycle_management
Feature:Content lifecycle 10m 41s 755ms 46 4

Given I am authorized 3s 41ms

When I follow the left menu "Content Lifecycle > Filters" 123ms

And I click on "Create Filter" 123ms

And I wait at most 10 seconds until I see modal containing "Create a new filter" text 12ms

Then I should see a "Create a new filter" text 62ms

And I enter "remove fonts packages" as "filter_name" 135ms

And I select "Package (Name)" from "type" 1s 148ms

And I select "contains" from "matcher" 1s 118ms

And I enter "fonts" as "name" 82ms

And I click on "Save" in "Create a new filter" modal 282ms

Then I should see a "remove fonts packages" text 58ms

When I follow the left menu "Content Lifecycle > Projects" 66ms

And I follow "Create Project" 382ms

Then I should see a "Create a new Content Lifecycle Project" text 53ms

And I should see a "Project Properties" text 52ms

When I enter "clp_label" as "label" 70ms

And I enter "clp_name" as "name" 61ms

And I enter "clp_desc" as "description" 65ms

And I click on "Create" 69ms

And I wait until I see "Content Lifecycle Project - clp_name" text 532ms

When I follow the left menu "Content Lifecycle > Projects" 63ms

Then I should see a "clp_name" text 55ms

And I should see a "clp_desc" text 53ms

When I follow "clp_name" 348ms

Then I should see a "Project Properties" text 62ms

And I should see a "Versions history" text 65ms

And I should see a "Sources" text 60ms

And I should see a "Filters" text 58ms

And I should see a "Environment Lifecycle" text 58ms

When I follow the left menu "Content Lifecycle > Projects" 0s

And I follow "clp_name" 0s

And I click on "Attach/Detach Sources" 0s

And I select "SLE-Product-SLES15-SP7-Pool for x86_64" from "selectedBaseChannel" 0s

And I exclude the recommended child channels 0s

And I click on "Save" 0s

And I wait until I see "SLE-Product-SLES15-SP7-Pool for x86_64" text 0s

Then I should see a "Version 1: (draft - not built) - Check the changes below" text 0s

When I follow the left menu "Content Lifecycle > Projects" 60ms

And I follow "clp_name" 402ms

And I click on "Attach/Detach Sources" 79ms

And I select "openSUSE Tumbleweed (x86_64)" from "selectedBaseChannel" 1s 125ms

And I wait until I see "Uyuni Client Tools for openSUSE Tumbleweed (x86_64)" text 100ms

And I click on "Save" 62ms

And I wait until I see "openSUSE Tumbleweed (x86_64)" text 288ms

Then I should see a "Version 1: (draft - not built) - Check the changes below" text 71ms

When I follow the left menu "Content Lifecycle > Projects" 0s

And I follow "clp_name" 0s

Then I should see a "SLE-Product-SLES15-SP7-Updates for x86_64" text 0s

And I should see a "Build (2)" text 0s

When I follow the left menu "Content Lifecycle > Projects" 64ms

And I follow "clp_name" 353ms

Then I should see a "openSUSE Tumbleweed (x86_64)" text 65ms

And I should see a "Build (1)" text 63ms

When I follow the left menu "Content Lifecycle > Projects" 67ms

And I follow "clp_name" 452ms

Then I should see a "Content Lifecycle Project - clp_name" text 66ms

When I click on "Attach/Detach Filters" 70ms

And I check the "remove fonts packages" CLM filter 258ms

And I click on "Save" 56ms

And I wait until I see "Deny" text 288ms

Then I should see a "remove fonts packages" text 72ms

When I follow the left menu "Content Lifecycle > Filters" 64ms

Then I should see a "clp_name" text 55ms

When I follow the left menu "Content Lifecycle > Projects" 65ms

And I follow "clp_name" 403ms

Then I should see a "No environments created" text 67ms

When I click on "Add Environment" 77ms

And I enter "dev_name" as "name" 79ms

And I enter "dev_label" as "label" 73ms

And I enter "dev_desc" as "description" 72ms

And I click on "Save" 63ms

Then I wait until I see "dev_name" text 316ms

And I should see a "dev_desc" text 72ms

When I click on "Add Environment" 65ms

And I enter "prod_name" as "name" 82ms

And I enter "prod_label" as "label" 77ms

And I enter "prod_desc" as "description" 74ms

And I click on "Save" 58ms

Then I wait until I see "prod_name" text 324ms

And I should see a "prod_desc" text 80ms

When I click on "Add Environment" 68ms

And I enter "qa_name" as "name" 82ms

And I enter "qa_label" as "label" 81ms

And I enter "qa_desc" as "description" 80ms

And I select "prod_name" from "predecessorLabel" 1s 133ms

And I click on "Save" 67ms

Then I wait until I see "qa_name" text 245ms

And I should see a "qa_desc" text 99ms

When I follow the left menu "Content Lifecycle > Projects" 0s

And I follow "clp_name" 0s

Then I should see a "not built" text in the environment "qa_name" 0s

When I click on "Build (3)" 0s

Then I should see a "Version 1 history" text 0s

When I enter "test version message 1" as "message" 0s

And I click the environment build button 0s

And I wait until I see "Version 1: test version message 1" text in the environment "dev_name" 0s

And I wait at most 600 seconds until I see "Built" text in the environment "dev_name" 0s

When I follow the left menu "Content Lifecycle > Projects" 64ms

And I follow "clp_name" 355ms

Then I should see a "not built" text in the environment "qa_name" 23ms

When I click on "Build (2)" 76ms

Then I should see a "Version 1 history" text 104ms

When I enter "test version message 1" as "message" 66ms

And I click the environment build button 60ms

And I wait until I see "Version 1: test version message 1" text in the environment "dev_name" 318ms

And I wait at most 600 seconds until I see "Built" text in the environment "dev_name" 50s 321ms

When I follow the left menu "Content Lifecycle > Projects" 81ms

Then I should see a "clp_name" text 58ms

And I should see a "clp_desc" text 53ms

And I should see a "dev_name > qa_name > prod_name" text 54ms

When I follow "clp_name" 403ms

Then I should see a "qa_desc" text in the environment "qa_name" 28ms

And I should see a "not built" text in the environment "qa_name" 18ms

When I click promote from Development to QA 95ms

Then I should see a "Version 1: test version message 1" text 94ms

And I click on "Promote environment" in "Promote version 1 into qa_name" modal 382ms

Then I wait at most 600 seconds until I see "Built" text in the environment "qa_name" 1m 601ms

When I click promote from QA to Production 62ms

Then I should see a "Version 1: test version message 1" text 93ms

And I click on "Promote environment" in "Promote version 1 into prod_name" modal 318ms

Then I wait at most 600 seconds until I see "Built" text in the environment "prod_name" 55s 346ms

When I follow the left menu "Content Lifecycle > Projects" 81ms

And I follow "clp_name" 398ms

Then I should see a "Build (0)" text 95ms

When I click on "Attach/Detach Sources" 79ms

And I uncheck "Vendors" 10s 929ms

And I enter "Fake-Base-Channel-SUSE-like" in the placeholder "Search a channel" 138ms

And I add the "Fake-Base-Channel-SUSE-like" channel to sources 78ms

And I click on "Save" 71ms

Then I wait until I see "Fake-Base-Channel-SUSE-like" text 550ms

And I wait until I see "Build (1)" text 87ms

And I should see a "Version 2: (draft - not built) - Check the changes below" text 94ms

When I click on "Build (1)" 72ms

Then I wait until I see "Version 2 history" text 93ms

When I enter "test version message 2" as "message" 70ms

And I click the environment build button 61ms

Then I wait until I see "Version 2: test version message 2" text in the environment "dev_name" 395ms

And I wait at most 600 seconds until I see "Built" text in the environment "dev_name" 50s 396ms

When I click promote from Development to QA 74ms

Then I should see a "Version 2: test version message 2" text 96ms

And I click on "Promote environment" in "Promote version 2 into qa_name" modal 445ms

And I wait for "1" second 1s

Then I wait at most 600 seconds until I see "Built" text in the environment "qa_name" 54s 509ms

When I click promote from QA to Production 67ms

Then I should see a "Version 2: test version message 2" text 99ms

And I click on "Promote environment" in "Promote version 2 into prod_name" modal 475ms

And I wait for "1" second 1s

Then I wait at most 600 seconds until I see "Built" text in the environment "prod_name" 59s 506ms

When I follow the left menu "Content Lifecycle > Filters" 84ms

And I click on "Create Filter" 78ms

And I wait at most 10 seconds until I see modal containing "Create a new filter" text 33ms

Then I should see a "Create a new filter" text 72ms

When I enter "mercury" as "filter_name" 79ms

And I select "Package (NEVRA)" from "type" 1s 133ms

And I select "lower" from "matcher" 1s 125ms

And I enter "mercury" as "Package Name" 93ms

And I enter "mercury" as "Epoch" 90ms

And I enter "0.0.0" as "version" 70ms

And I enter "0.0.0" as "Release" 84ms

And I enter "x86_64" as "Architecture" 88ms

And I check radio button "Allow" 10s 64ms

And I click on "Save" in "Create a new filter" modal 248ms

Then I should see a "Filter created successfully" text 59ms

Warning: Radio button 'Deny' is already checked

When I follow the left menu "Content Lifecycle > Filters" 63ms

And I click on "Create Filter" 62ms

And I wait at most 10 seconds until I see modal containing "Create a new filter" text 8ms

Then I should see a "Create a new filter" text 82ms

When I enter "venus" as "filter_name" 61ms

And I select "Package (NEVRA)" from "type" 1s 128ms

And I select "lower" from "matcher" 1s 103ms

And I enter "venus" as "Package Name" 80ms

And I enter "venus" as "Epoch" 76ms

And I enter "0.0.0" as "version" 70ms

And I enter "0.0.0" as "Release" 78ms

And I enter "x86_64" as "Architecture" 77ms

And I check radio button "Deny" 21ms

And I click on "Save" in "Create a new filter" modal 236ms

Then I should see a "Filter created successfully" text 64ms

When I follow the left menu "Content Lifecycle > Filters" 61ms

And I click on "Create Filter" 63ms

And I wait at most 10 seconds until I see modal containing "Create a new filter" text 8ms

Then I should see a "Create a new filter" text 79ms

When I enter "cereal" as "filter_name" 65ms

And I select "Package (Provides Name)" from "type" 1s 132ms

And I select "provides name" from "matcher" 1s 113ms

And I enter "cereal" as "Provides Name" 85ms

And I click on "Save" in "Create a new filter" modal 255ms

Then I should see a "Filter created successfully" text 67ms

Warning: Radio button 'Deny' is already checked

When I follow the left menu "Content Lifecycle > Filters" 62ms

And I click on "Create Filter" 64ms

And I wait at most 10 seconds until I see modal containing "Create a new filter" text 8ms

Then I should see a "Create a new filter" text 77ms

When I enter "potato" as "filter_name" 62ms

And I select "Package (Provides Name)" from "type" 1s 119ms

And I select "provides name" from "matcher" 1s 106ms

And I enter "potato" as "Provides Name" 80ms

And I check radio button "Deny" 17ms

And I click on "Save" in "Create a new filter" modal 230ms

Then I should see a "Filter created successfully" text 69ms

When I follow the left menu "Content Lifecycle > Filters" 70ms

And I click on "Create Filter" 64ms

And I wait at most 10 seconds until I see modal containing "Create a new filter" text 9ms

Then I should see a "Create a new filter" text 79ms

When I enter "cherry" as "filter_name" 62ms

And I select "Package (Build date)" from "type" 1s 140ms

And I select "lower" from "matcher" 1s 120ms

And I check radio button "Allow" 10s 91ms

And I click on "Save" in "Create a new filter" modal 243ms

Then I should see a "Filter created successfully" text 72ms

Warning: Radio button 'Deny' is already checked

When I follow the left menu "Content Lifecycle > Filters" 64ms

And I click on "Create Filter" 64ms

And I wait at most 10 seconds until I see modal containing "Create a new filter" text 8ms

Then I should see a "Create a new filter" text 85ms

When I enter "drummer" as "filter_name" 65ms

And I select "Package (Build date)" from "type" 1s 120ms

And I select "lower" from "matcher" 1s 114ms

And I check radio button "Deny" 16ms

And I click on "Save" in "Create a new filter" modal 246ms

Then I should see a "Filter created successfully" text 80ms

When I follow the left menu "Content Lifecycle > Filters" 62ms

And I click on "Create Filter" 66ms

And I wait at most 10 seconds until I see modal containing "Create a new filter" text 9ms

Then I should see a "Create a new filter" text 90ms

When I enter "africa-patch" as "filter_name" 79ms

And I select "Patch (Advisory Name)" from "type" 1s 127ms

And I select "equals" from "matcher" 1s 111ms

And I enter "africa" as "Advisory name" 86ms

And I check radio button "Allow" 10s 70ms

And I click on "Save" in "Create a new filter" modal 324ms

Then I should see a "Filter created successfully" text 79ms

Warning: Radio button 'Deny' is already checked

When I follow the left menu "Content Lifecycle > Filters" 58ms

And I click on "Create Filter" 64ms

And I wait at most 10 seconds until I see modal containing "Create a new filter" text 8ms

Then I should see a "Create a new filter" text 90ms

When I enter "asia-patch" as "filter_name" 75ms

And I select "Patch (Advisory Name)" from "type" 1s 117ms

And I select "equals" from "matcher" 1s 108ms

And I enter "asia" as "Advisory name" 84ms

And I check radio button "Deny" 17ms

And I click on "Save" in "Create a new filter" modal 251ms

Then I should see a "Filter created successfully" text 87ms

Warning: Radio button 'Security Advisory' is already checked

When I follow the left menu "Content Lifecycle > Filters" 64ms

And I click on "Create Filter" 67ms

And I wait at most 10 seconds until I see modal containing "Create a new filter" text 8ms

Then I should see a "Create a new filter" text 93ms

When I enter "key" as "filter_name" 52ms

And I select "Patch (Advisory Type)" from "type" 1s 125ms

And I select "equals" from "matcher" 1s 102ms

And I check radio button "Security Advisory" 21ms

And I check radio button "Allow" 10s 81ms

And I click on "Save" in "Create a new filter" modal 245ms

Then I should see a "Filter created successfully" text 84ms

Warning: Radio button 'Security Advisory' is already checked
Warning: Radio button 'Deny' is already checked

When I follow the left menu "Content Lifecycle > Filters" 65ms

And I click on "Create Filter" 66ms

And I wait at most 10 seconds until I see modal containing "Create a new filter" text 9ms

Then I should see a "Create a new filter" text 97ms

When I enter "geminis-patch" as "filter_name" 86ms

And I select "Patch (Advisory Type)" from "type" 1s 120ms

And I select "equals" from "matcher" 1s 110ms

And I check radio button "Security Advisory" 18ms

And I check radio button "Deny" 17ms

And I click on "Save" in "Create a new filter" modal 270ms

Then I should see a "Filter created successfully" text 91ms

When I follow the left menu "Content Lifecycle > Filters" 62ms

And I click on "Create Filter" 97ms

And I wait at most 10 seconds until I see modal containing "Create a new filter" text 9ms

Then I should see a "Create a new filter" text 102ms

When I enter "aries-patch" as "filter_name" 78ms

And I select "Patch (Synopsis)" from "type" 1s 123ms

And I select "equals" from "matcher" 1s 110ms

And I enter "aries" as "Synopsis" 86ms

And I check radio button "Allow" 10s 80ms

And I click on "Save" in "Create a new filter" modal 284ms

Then I should see a "Filter created successfully" text 91ms

Warning: Radio button 'Deny' is already checked

When I follow the left menu "Content Lifecycle > Filters" 65ms

And I click on "Create Filter" 76ms

And I wait at most 10 seconds until I see modal containing "Create a new filter" text 8ms

Then I should see a "Create a new filter" text 99ms

When I enter "andromeda-patch" as "filter_name" 92ms

And I select "Patch (Synopsis)" from "type" 1s 114ms

And I select "equals" from "matcher" 1s 105ms

And I enter "andromeda" as "Synopsis" 97ms

And I check radio button "Deny" 18ms

And I click on "Save" in "Create a new filter" modal 280ms

Then I should see a "Filter created successfully" text 97ms

When I follow the left menu "Content Lifecycle > Filters" 63ms

And I click on "Create Filter" 67ms

And I wait at most 10 seconds until I see modal containing "Create a new filter" text 10ms

Then I should see a "Create a new filter" text 103ms

When I enter "mars-patch" as "filter_name" 73ms

And I select "Patch (Keyword)" from "type" 1s 125ms

And I select "contains" from "matcher" 1s 107ms

And I check radio button "Package Manager Restart Required" 10s 92ms

And I check radio button "Allow" 10s 87ms

And I click on "Save" in "Create a new filter" modal 263ms

Then I should see a "Filter created successfully" text 100ms

Warning: Radio button 'Deny' is already checked

When I follow the left menu "Content Lifecycle > Filters" 58ms

And I click on "Create Filter" 69ms

And I wait at most 10 seconds until I see modal containing "Create a new filter" text 9ms

Then I should see a "Create a new filter" text 104ms

When I enter "eurasia-patch" as "filter_name" 87ms

And I select "Patch (Keyword)" from "type" 1s 125ms

And I select "contains" from "matcher" 1s 114ms

And I check radio button "Package Manager Restart Required" 10s 79ms

And I check radio button "Deny" 17ms

And I click on "Save" in "Create a new filter" modal 275ms

Then I should see a "Filter created successfully" text 103ms

When I follow the left menu "Content Lifecycle > Filters" 59ms

And I click on "Create Filter" 71ms

And I wait at most 10 seconds until I see modal containing "Create a new filter" text 8ms

Then I should see a "Create a new filter" text 105ms

When I enter "milkyway-patch" as "filter_name" 92ms

And I select "Patch (Issue date)" from "type" 1s 201ms

And I select "greater or equal" from "matcher" 1s 119ms

And I check radio button "Allow" 10s 84ms

And I click on "Save" in "Create a new filter" modal 315ms

Then I should see a "Filter created successfully" text 106ms

Warning: Radio button 'Deny' is already checked

When I follow the left menu "Content Lifecycle > Filters" 60ms

And I click on "Create Filter" 67ms

And I wait at most 10 seconds until I see modal containing "Create a new filter" text 9ms

Then I should see a "Create a new filter" text 114ms

When I enter "venus-patch" as "filter_name" 79ms

And I select "Patch (Issue date)" from "type" 1s 144ms

And I select "greater or equal" from "matcher" 1s 130ms

When I enter "solar" as "filter_name" 154ms

And I check radio button "Deny" 17ms

And I click on "Save" in "Create a new filter" modal 307ms

Then I should see a "Filter created successfully" text 110ms

When I follow the left menu "Content Lifecycle > Filters" 65ms

And I click on "Create Filter" 73ms

And I wait at most 10 seconds until I see modal containing "Create a new filter" text 8ms

Then I should see a "Create a new filter" text 115ms

When I enter "Triangulum-patch" as "filter_name" 96ms

And I select "Patch (Contains Package Name)" from "type" 1s 129ms

And I select "equals" from "matcher" 1s 120ms

When I enter "Triangulum-patch" as "Package Name" 137ms

And I check radio button "Allow" 10s 76ms

And I click on "Save" in "Create a new filter" modal 298ms

Then I should see a "Filter created successfully" text 114ms

Warning: Radio button 'Deny' is already checked

When I follow the left menu "Content Lifecycle > Filters" 67ms

And I click on "Create Filter" 74ms

And I wait at most 10 seconds until I see modal containing "Create a new filter" text 9ms

Then I should see a "Create a new filter" text 120ms

When I enter "Pinwheel-patch" as "filter_name" 96ms

And I select "Patch (Contains Package Name)" from "type" 1s 127ms

And I select "equals" from "matcher" 1s 112ms

When I enter "Pinwheel-patch" as "Package Name" 133ms

And I check radio button "Deny" 18ms

And I click on "Save" in "Create a new filter" modal 299ms

Then I should see a "Filter created successfully" text 111ms

When I follow the left menu "Content Lifecycle > Filters" 75ms

And I click on "Create Filter" 72ms

And I wait at most 10 seconds until I see modal containing "Create a new filter" text 8ms

Then I should see a "Create a new filter" text 122ms

When I enter "Sunflower-patch" as "filter_name" 94ms

And I select "Patch (Contains Package Name)" from "type" 1s 123ms

And I select "matches" from "matcher" 1s 118ms

When I enter "Sunflower-patch" as "Package Name" 133ms

And I check radio button "Allow" 10s 68ms

And I click on "Save" in "Create a new filter" modal 271ms

Then I should see a "Filter created successfully" text 119ms

Warning: Radio button 'Deny' is already checked

When I follow the left menu "Content Lifecycle > Filters" 73ms

And I click on "Create Filter" 99ms

And I wait at most 10 seconds until I see modal containing "Create a new filter" text 10ms

Then I should see a "Create a new filter" text 126ms

When I enter "Whirlpool-patch" as "filter_name" 94ms

And I select "Patch (Contains Package Name)" from "type" 1s 126ms

And I select "matches" from "matcher" 1s 121ms

When I enter "Whirlpool-patch" as "Package Name" 132ms

And I check radio button "Deny" 20ms

And I click on "Save" in "Create a new filter" modal 310ms

Then I should see a "Filter created successfully" text 117ms

When I follow the left menu "Content Lifecycle > Filters" 60ms

And I click on "Create Filter" 108ms

And I wait at most 10 seconds until I see modal containing "Create a new filter" text 9ms

Then I should see a "Create a new filter" text 134ms

When I enter "Antennae-patch" as "filter_name" 98ms

And I select "Patch (Contains Package Provides Name)" from "type" 1s 149ms

And I select "provides name" from "matcher" 1s 112ms

When I enter "Antennae-patch" as "Package Provides Name" 132ms

And I check radio button "Allow" 10s 60ms

And I click on "Save" in "Create a new filter" modal 309ms

Then I should see a "Filter created successfully" text 126ms

Warning: Radio button 'Deny' is already checked

When I follow the left menu "Content Lifecycle > Filters" 64ms

And I click on "Create Filter" 72ms

And I wait at most 10 seconds until I see modal containing "Create a new filter" text 8ms

Then I should see a "Create a new filter" text 130ms

When I enter "hat-patch" as "filter_name" 74ms

And I select "Patch (Contains Package Provides Name)" from "type" 1s 138ms

And I select "provides name" from "matcher" 1s 125ms

When I enter "hat-patch" as "Package Provides Name" 106ms

And I check radio button "Deny" 17ms

And I click on "Save" in "Create a new filter" modal 309ms

Then I should see a "Filter created successfully" text 122ms

When I follow the left menu "Content Lifecycle > Filters" 67ms

And I click on "Create Filter" 71ms

And I wait at most 10 seconds until I see modal containing "Create a new filter" text 9ms

Then I should see a "Create a new filter" text 133ms

When I enter "Hubble-patch" as "filter_name" 91ms

And I select "Patch (Contains Package)" from "type" 1s 135ms

And I select "version lower than" from "matcher" 1s 117ms

When I enter "Hubble-patch" as "Package Name" 128ms

And I enter "Hubble-patch" as "Epoch" 121ms

And I enter "0.0.0" as "Version" 86ms

And I enter "0.0.0" as "Release" 90ms

And I check radio button "Allow" 10s 68ms

And I click on "Save" in "Create a new filter" modal 315ms

Then I should see a "Filter created successfully" text 128ms

Warning: Radio button 'Deny' is already checked

When I follow the left menu "Content Lifecycle > Filters" 64ms

And I click on "Create Filter" 160ms

And I wait at most 10 seconds until I see modal containing "Create a new filter" text 9ms

Then I should see a "Create a new filter" text 135ms

When I enter "galaxy-patch" as "filter_name" 85ms

And I select "Patch (Contains Package)" from "type" 1s 126ms

And I select "version lower than" from "matcher" 1s 116ms

When I enter "galaxy-patch" as "Package Name" 120ms

And I enter "galaxy-patch" as "Epoch" 118ms

And I enter "0.0.0" as "Version" 76ms

And I enter "0.0.0" as "Release" 82ms

And I check radio button "Deny" 18ms

And I click on "Save" in "Create a new filter" modal 342ms

Then I should see a "Filter created successfully" text 137ms

When I follow the left menu "Content Lifecycle > Filters" 64ms

And I click on "Create Filter" 79ms

And I wait at most 10 seconds until I see modal containing "Create a new filter" text 9ms

Then I should see a "Create a new filter" text 149ms

When I enter "earth-patch" as "filter_name" 85ms

And I select "Patch (Contains Package)" from "type" 1s 144ms

And I select "version lower or equal" from "matcher" 1s 130ms

When I enter "earth-patch" as "Package Name" 120ms

And I enter "earth-patch" as "Epoch" 106ms

And I enter "0.0.0" as "Version" 79ms

And I enter "0.0.0" as "Release" 85ms

And I check radio button "Allow" 10s 75ms

And I click on "Save" in "Create a new filter" modal 389ms

Then I should see a "Filter created successfully" text 132ms

Warning: Radio button 'Deny' is already checked

When I follow the left menu "Content Lifecycle > Filters" 68ms

And I click on "Create Filter" 112ms

And I wait at most 10 seconds until I see modal containing "Create a new filter" text 9ms

Then I should see a "Create a new filter" text 149ms

When I enter "moon-patch" as "filter_name" 82ms

And I select "Patch (Contains Package)" from "type" 1s 127ms

And I select "version lower or equal" from "matcher" 1s 125ms

When I enter "moon-patch" as "Package Name" 118ms

And I enter "moon-patch" as "Epoch" 110ms

And I enter "0.0.0" as "Version" 78ms

And I enter "0.0.0" as "Release" 86ms

And I check radio button "Deny" 18ms

And I click on "Save" in "Create a new filter" modal 334ms

Then I should see a "Filter created successfully" text 135ms

When I follow the left menu "Content Lifecycle > Filters" 61ms

And I click on "Create Filter" 72ms

And I wait at most 10 seconds until I see modal containing "Create a new filter" text 9ms

Then I should see a "Create a new filter" text 154ms

And I enter "ruby 2.7 module" as "filter_name" 175ms

And I select "Module (Stream)" from "type" 1s 132ms

And I select "equals" from "matcher" 1s 134ms

And I enter "ruby" as "moduleName" 82ms

And I enter "2.7" as "moduleStream" 67ms

And I click on "Save" in "Create a new filter" modal 324ms

Then I should see a "Filter created successfully" text 132ms

Warning: Radio button 'Deny' is already checked

When I follow the left menu "Content Lifecycle > Filters" 61ms

And I click on "Create Filter" 75ms

And I wait at most 10 seconds until I see modal containing "Create a new filter" text 10ms

Then I should see a "Create a new filter" text 144ms

When I enter "mars" as "filter_name" 57ms

And I select "Product Temporary Fix (All)" from "type" 1s 141ms

And I select "all" from "matcher" 1s 126ms

And I check radio button "Deny" 18ms

And I click on "Save" in "Create a new filter" modal 319ms

Then I should see a "Filter created successfully" text 133ms

Warning: Radio button 'Deny' is already checked

When I follow the left menu "Content Lifecycle > Filters" 63ms

And I click on "Create Filter" 73ms

And I wait at most 10 seconds until I see modal containing "Create a new filter" text 8ms

Then I should see a "Create a new filter" text 145ms

When I enter "mercury-patch" as "filter_name" 95ms

And I select "Product Temporary Fix (All)" from "type" 1s 129ms

And I select "all" from "matcher" 1s 128ms

And I check radio button "Deny" 17ms

And I click on "Save" in "Create a new filter" modal 410ms

Then I should see a "Filter created successfully" text 135ms

When I follow the left menu "Content Lifecycle > Filters" 66ms

And I click on "Create Filter" 78ms

And I wait at most 10 seconds until I see modal containing "Create a new filter" text 9ms

Then I should see a "Create a new filter" text 146ms

When I enter "jupiter-patch" as "filter_name" 93ms

And I select "Product Temporary Fix (Number)" from "type" 1s 140ms

And I select "lower" from "matcher" 1s 117ms

And I enter "1" as "Number" 75ms

And I check radio button "Allow" 10s 75ms

And I click on "Save" in "Create a new filter" modal 316ms

Then I should see a "Filter created successfully" text 133ms

Warning: Radio button 'Deny' is already checked

When I follow the left menu "Content Lifecycle > Filters" 60ms

And I click on "Create Filter" 74ms

And I wait at most 10 seconds until I see modal containing "Create a new filter" text 9ms

Then I should see a "Create a new filter" text 145ms

When I enter "pluto-patch" as "filter_name" 83ms

And I select "Product Temporary Fix (Number)" from "type" 1s 130ms

And I select "lower" from "matcher" 1s 119ms

And I enter "2" as "Number" 69ms

And I check radio button "Deny" 18ms

And I click on "Save" in "Create a new filter" modal 354ms

Then I should see a "Filter created successfully" text 140ms

When I follow the left menu "Content Lifecycle > Filters" 67ms

And I click on "Create Filter" 74ms

And I wait at most 10 seconds until I see modal containing "Create a new filter" text 9ms

Then I should see a "Create a new filter" text 146ms

When I enter "comet-patch" as "filter_name" 88ms

And I select "Product Temporary Fix (Fixes Package Name)" from "type" 1s 128ms

And I select "equals" from "matcher" 1s 118ms

And I enter "comet-patch" as "Package Name" 119ms

And I check radio button "Allow" 10s 71ms

And I click on "Save" in "Create a new filter" modal 319ms

Then I should see a "Filter created successfully" text 136ms

When I follow the left menu "Content Lifecycle > Projects" 72ms

And I follow "clp_name" 534ms

And I click on "Delete" 84ms

And I click on "Delete" in "Delete Project" modal 104ms

Then I should not see a "clp_name" text 159ms

When I follow the left menu "Content Lifecycle > Filters" 57ms

And I click on "Select unused" 87ms

And I click on "Delete" 98ms

And I click on "Delete" in "Delete Selected Filter(s)" modal 123ms

Then I should not see a "remove fonts packages" text 146ms

And I should not see a "africa-patch" text 2s 554ms

And I should not see a "andromeda-patch" text 51ms

And I should not see a "Antennae-patch" text 50ms

And I should not see a "aries-patch" text 50ms

And I should not see a "asia-patch" text 51ms

And I should not see a "cereal" text 52ms

And I should not see a "comet-patch" text 51ms

And I should not see a "cherry" text 52ms

And I should not see a "drummer" text 51ms

And I should not see a "earth-patch" text 53ms

And I should not see a "galaxy-patch" text 51ms

And I should not see a "hat-patch" text 53ms

And I should not see a "Hubble-patch" text 50ms

And I should not see a "mars" text 52ms

And I should not see a "mars-patch" text 51ms

And I should not see a "mercury" text 52ms

And I should not see a "milkyway-patch" text 51ms

And I should not see a "moon-patch" text 58ms

And I should not see a "Pinwheel-patch" text 50ms

And I should not see a "pluto-patch" text 51ms

And I should not see a "solar" text 51ms

And I should not see a "Sunflower-patch" text 51ms

And I should not see a "Triangulum-patch" text 53ms

And I should not see a "venus" text 53ms

And I should not see a "Whirlpool-patch" text 53ms

And I should not see a "remove fonts packages" text 53ms

And I should not see a "ruby 2.7 module" text 51ms

And I should not see a "key" text 51ms

When I delete these channels with spacewalk-remove-channel: 0s
clp_label-prod_label-fake-base-channel-suse-like
clp_label-prod_label-sle-product-sles15-sp7-updates-x86_64
clp_label-qa_label-fake-base-channel-suse-like
clp_label-qa_label-sle-product-sles15-sp7-updates-x86_64
clp_label-dev_label-fake-base-channel-suse-like
clp_label-dev_label-sle-product-sles15-sp7-updates-x86_64

And I delete these channels with spacewalk-remove-channel: 0s
clp_label-prod_label-sle-product-sles15-sp7-pool-x86_64
clp_label-qa_label-sle-product-sles15-sp7-pool-x86_64
clp_label-dev_label-sle-product-sles15-sp7-pool-x86_64

And I list channels with spacewalk-remove-channel 0s

Then I shouldn't get "clp_label" 0s

When I delete these channels with spacewalk-remove-channel: 3s 304ms
clp_label-prod_label-fake-base-channel-suse-like
clp_label-prod_label-opensuse_tumbleweed-x86_64
clp_label-qa_label-fake-base-channel-suse-like
clp_label-qa_label-opensuse_tumbleweed-x86_64
clp_label-dev_label-fake-base-channel-suse-like
clp_label-dev_label-opensuse_tumbleweed-x86_64

And I list channels with spacewalk-remove-channel 4s 472ms

Then I shouldn't get "clp_label" < 1ms

Given I am authorized for the "Admin" section 2s 669ms

When I follow the left menu "Admin > Task Schedules" 126ms

And I follow "sandbox-cleanup-default" 1s 209ms

And I check radio button "weekly" 10s 71ms

And I select "Friday" from "date_day_week" 66ms

And I click on "Update Schedule" 718ms

Then I should see a "Schedule sandbox-cleanup-default has been updated." text 90ms

When I follow the left menu "Admin > Task Schedules" 65ms

And I follow "sandbox-cleanup-default" 1s 336ms

Then I should see a "Friday" text 80ms

And radio button "weekly" should be checked 17ms

When I follow the left menu "Admin > Task Schedules" 59ms

And I follow "sandbox-cleanup-default" 1s 186ms

And I check radio button "monthly" 10s 60ms

And I select "17" from "date_day_month" 69ms

And I click on "Update Schedule" 1s 865ms

Then I should see a "Schedule sandbox-cleanup-default has been updated." text 82ms

When I follow the left menu "Admin > Task Schedules" 64ms

And I follow "sandbox-cleanup-default" 1s 341ms

Then radio button "monthly" should be checked 30ms

When I follow the left menu "Admin > Task Schedules" 62ms

And I follow "sandbox-cleanup-default" 1s 369ms

And I check radio button "daily" 10s 88ms

And I click on "Update Schedule" 656ms

Then I should see a "Schedule sandbox-cleanup-default has been updated." text 85ms

When I follow the left menu "Admin > Task Schedules" 64ms

And I follow "sandbox-cleanup-default" 322ms

Then radio button "daily" should be checked 15ms

Given I am authorized 1s 973ms

All notification-messages are read, I expect no notification badge

When I follow the left menu "Home > Notification Messages" 72ms

And I wait until I see "The server has collected the following notification messages." text 274ms

Then I follow "Unread Messages" 60ms

And the notification badge and the table should count the same amount of messages 10s 23ms

There are no notification messages, nothing to do then

When I follow the left menu "Home > Notification Messages" 79ms

And I wait until I see "The server has collected the following notification messages." text 249ms

Then I follow "All Messages" 72ms

Then I check the first notification message 13ms

And I delete it via the "Delete" button 13ms

There are no notification messages, nothing to do then

When I follow the left menu "Home > Notification Messages" 59ms

And I wait until I see "The server has collected the following notification messages." text 239ms

Then I follow "All Messages" 58ms

Then I check the first notification message 14ms

And I mark as read it via the "Mark as Read" button 13ms

In order to use payg
As admin user
I want to list available ssh connections and add or remove them

Given I am authorized for the "Admin" section 1s 850ms

When I follow the left menu "Admin > Setup Wizard > PAYG Connections" 194ms

And I click on "Add PAYG Connection" 416ms

And I enter "My Instance" as "description" 97ms

And I enter "my-host.local" as "host" 89ms

And I enter "root" as "username" 58ms

And I click on "Create" 65ms

Then I should see a "PAYG my-host.local created successfully" text 675ms

And I should see a "My Instance" text in element "Info-panel-wrapper" 21ms

And I should see a "my-host.local" text in element "Instance-panel-wrapper" 22ms

And I should see a "root" text in element "Instance-panel-wrapper" 18ms

And I should see a "Delete" button 19ms

When I follow the left menu "Admin > Setup Wizard > PAYG Connections" 74ms

And I click on "Add PAYG Connection" 1s 272ms

And I enter "My Full Instance" as "description" 91ms

And I enter "my-host-full.local" as "host" 97ms

And I enter "21" as "port" 53ms

And I enter "rootFull" as "username" 69ms

And I enter "passwordFull" as "password" 78ms

And I enter "keyFull" as "key" 74ms

And I enter "keyPasswordFull" as "key_password" 93ms

And I enter "my-bastion.local" as "bastion_host" 94ms

And I enter "22" as "bastion_port" 54ms

And I enter "b_rootFull" as "bastion_username" 78ms

And I enter "b_passwordFull" as "bastion_password" 87ms

And I enter "b_keyFull" as "bastion_key" 81ms

And I enter "b_keyPasswordFull" as "bastion_key_password" 104ms

And I click on "Create" 63ms

Then I should see a "PAYG my-host-full.local created successfully" text 1s 57ms

And I should see a "My Full Instance" text in element "Info-panel-wrapper" 16ms

And I should see a "my-host-full.local" text in element "Instance-panel-wrapper" 18ms

And I should see a "21" text in element "Instance-panel-wrapper" 19ms

And I should see a "rootFull" text in element "Instance-panel-wrapper" 18ms

And I should not see a "passwordFull" text in element "Instance-panel-wrapper" 10s 36ms

And I should not see a "keyFull" text in element "Instance-panel-wrapper" 10s 33ms

And I should not see a "keyPasswordFull" text in element "Instance-panel-wrapper" 10s 31ms

And I should see a "my-bastion.local" text in element "Bastion-panel-wrapper" 22ms

And I should see a "22" text in element "Bastion-panel-wrapper" 18ms

And I should see a "b_rootFull" text in element "Bastion-panel-wrapper" 18ms

And I should not see a "b_passwordFull" text in element "Bastion-panel-wrapper" 10s 21ms

And I should not see a "b_keyFull" text in element "Bastion-panel-wrapper" 10s 24ms

And I should not see a "b_keyPasswordFull" text in element "Bastion-panel-wrapper" 10s 24ms

And I should see a "Delete" button 20ms

When I follow the left menu "Admin > Setup Wizard > PAYG Connections" 97ms

Then I should see a "my-host.local" link 12ms

And I should see a "My Instance" text 79ms

And I should see a "my-host-full.local" link 19ms

And I should see a "My Full Instance" text 70ms

When I follow the left menu "Admin > Setup Wizard > PAYG Connections" 71ms

And I follow "my-host-full.local" 402ms

And I click on "Edit Information" 66ms

And I enter "My new Full Instance" as "description" 123ms

And I click on "Save" in "Information" modal 250ms

Then I should see a "PAYG properties updated successfully" text 70ms

And I should see a "My new Full Instance" text in element "Info-panel-wrapper" 24ms

When I follow the left menu "Admin > Setup Wizard > PAYG Connections" 70ms

And I follow "my-host-full.local" 464ms

And I click on "Edit Instance" 66ms

And I enter "221" as "port" 64ms

And I enter "NewRootFull" as "username" 102ms

And I enter "NewPasswordFull" as "password" 87ms

And I enter "newKeyFull" as "key" 82ms

And I enter "newKeyPasswordFull" as "key_password" 94ms

And I click on "Save" in "Instance SSH connection" modal 1s 183ms

Then I should see a "PAYG properties updated successfully" text 75ms

And I should see a "221" text in element "Instance-panel-wrapper" 23ms

And I should see a "NewRootFull" text in element "Instance-panel-wrapper" 20ms

And I should not see a "NewPasswordFull" text in element "Instance-panel-wrapper" 10s 32ms

And I should not see a "newKeyFull" text in element "Instance-panel-wrapper" 10s 13ms

And I should not see a "newKeyPasswordFull" text in element "Instance-panel-wrapper" 10s 22ms

When I follow the left menu "Admin > Setup Wizard > PAYG Connections" 95ms

And I follow "my-host-full.local" 441ms

And I click on "Edit Bastion" 68ms

And I enter "my-new-bastion.local" as "bastion_host" 158ms

And I enter "222" as "bastion_port" 60ms

And I enter "b_new_rootFull" as "bastion_username" 116ms

And I enter "b_new_passwordFull" as "bastion_password" 92ms

And I enter "b_new_keyFull" as "bastion_key" 91ms

And I enter "b_new_keyPasswordFull" as "bastion_key_password" 104ms

And I click on "Save" in "Bastion SSH connection" modal 288ms

Then I should see a "PAYG properties updated successfully" text 78ms

And I should see a "my-new-bastion.local" text in element "Bastion-panel-wrapper" 23ms

And I should see a "222" text in element "Bastion-panel-wrapper" 19ms

And I should see a "b_new_rootFull" text in element "Bastion-panel-wrapper" 18ms

And I should not see a "b_new_passwordFull" text in element "Bastion-panel-wrapper" 10s 13ms

And I should not see a "b_new_keyFull" text in element "Bastion-panel-wrapper" 10s 34ms

And I should not see a "b_new_keyPasswordFull" text in element "Bastion-panel-wrapper" 10s 30ms

When I follow the left menu "Admin > Setup Wizard > PAYG Connections" 117ms

And I follow "my-host.local" 476ms

And I click on "Delete" 77ms

And I click on "Delete" in "Delete PAYG Connection" modal 97ms

Then I should not see a "my-host.local" link 8ms

And I should not see a "my-host.local" text 222ms

When I follow the left menu "Admin > Setup Wizard > PAYG Connections" 74ms

And I follow "my-host-full.local" 335ms

And I click on "Delete" 61ms

And I click on "Delete" in "Delete PAYG Connection" modal 88ms

Then I should not see a "my-bastion.local" link 8ms

And I should not see a "my-host.local" text 77ms

@sle_minion @scc_credentials @skip_if_github_validation
Feature:Push a package with unset vendor 1m 44s 722ms 1 3

In order to distribute software to the clients
As an authorized user
I want to push a package with unset vendor

Given I am authorized 1s 977ms

Event Details: ---------- ID: sync_states Function: saltutil.sync_states Name: sync_states Result: true Comment: No updates to sync Started: 17:41:19.829055 Duration: 222.106 SLS: util.syncstates Changed: {} ---------- ID: mgr_absent_ca_package Function: pkg.removed Name: rhn-org-trusted-ssl-cert Result: true Comment: All specified packages are already absent Started: 17:41:21.183544 Duration: 10.377 SLS: certs Changed: {} ---------- ID: mgr_ca_cert Function: file.managed Name: /etc/pki/trust/anchors/RHN-ORG-TRUSTED-SSL-CERT Result: true Comment: File /etc/pki/trust/anchors/RHN-ORG-TRUSTED-SSL-CERT is in the correct state Started: 17:41:21.196616 Duration: 37.222 SLS: certs Changed: {} ---------- ID: update-ca-certificates Function: cmd.run Name: /usr/sbin/update-ca-certificates Result: true Comment: State was not run because none of the onchanges reqs changed Started: 17:41:21.235077 Duration: 0.005 SLS: certs Changed: {} ---------- ID: mgr_proxy_ca_cert_symlink Function: file.symlink Name: /usr/share/rhn/RHN-ORG-TRUSTED-SSL-CERT Result: true Comment: onlyif condition is false Started: 17:41:21.235178 Duration: 588.844 SLS: certs Changed: {} ---------- ID: mgr_deploy_tools_uyuni_key Function: file.managed Name: /etc/pki/rpm-gpg/uyuni-tools-gpg-pubkey-0d20833e.key Result: true Comment: File /etc/pki/rpm-gpg/uyuni-tools-gpg-pubkey-0d20833e.key is in the correct state Started: 17:41:21.824178 Duration: 42.919 SLS: channels.gpg-keys Changed: {} ---------- ID: mgr_deploy_suse_addon_key Function: file.managed Name: /etc/pki/rpm-gpg/suse-addon-97a636db0bad8ecc.key Result: true Comment: File /etc/pki/rpm-gpg/suse-addon-97a636db0bad8ecc.key is in the correct state Started: 17:41:21.867229 Duration: 42.732 SLS: channels.gpg-keys Changed: {} ---------- ID: mgr_deploy_suse16_gpg_key Function: file.managed Name: /etc/pki/rpm-gpg/suse16-gpg-pubkey-09d9ea69.key Result: true Comment: File /etc/pki/rpm-gpg/suse16-gpg-pubkey-09d9ea69.key is in the correct state Started: 17:41:21.910122 Duration: 35.961 SLS: channels.gpg-keys Changed: {} ---------- ID: file_///etc/pki/rpm-gpg/uyuni-tools-gpg-pubkey-0d20833e.key Function: module.run Name: pkg.add_repo_key Result: true Comment: Module function pkg.add_repo_key executed Started: 17:41:21.946231 Duration: 24.801 SLS: channels.gpg-keys Changed: ret: true ---------- ID: file_///usr/lib/rpm/gnupg/keys/gpg-pubkey-29b700a4-62b07e22.asc Function: module.run Name: pkg.add_repo_key Result: true Comment: Module function pkg.add_repo_key executed Started: 17:41:21.971184 Duration: 25.711 SLS: channels.gpg-keys Changed: ret: true ---------- ID: mgrchannels_repo Function: file.managed Name: /etc/zypp/repos.d/susemanager:channels.repo Result: true Comment: File /etc/zypp/repos.d/susemanager:channels.repo is in the correct state Started: 17:41:21.997172 Duration: 149.84 SLS: channels Changed: {} ---------- ID: pkg_installed Function: pkg.installed Name: pkg_installed Result: false Comment: An error was encountered while installing package(s): Zypper command failure: Running as unit: run-p14222-i14223.scope; invocation ID: 288cd4087c9d4be8b0f98a9671e8d740Loading repository data... Reading installed packages... Resolving package dependencies... Problem: 1: nothing provides 'python3-rpm' needed by the to be installed python3-mgr-push-5.2.3-2.1.uyuni.noarch Solution 1: do not install mgr-push-5.2.3-2.1.uyuni.noarch Solution 2: break python3-mgr-push-5.2.3-2.1.uyuni.noarch by ignoring some of its dependencies Choose from above solutions by number or cancel [1/2/c/d/?] (c): c Started: 17:41:22.147502 Duration: 1859.24 SLS: packages.pkginstall Changed: {}

Given I am on the Systems overview page of this "sle_minion" 2s 213ms

When I follow "Software" in the content area 81ms

And I wait until I see "Upgrade Packages" text 62ms

And I follow "Install" 514ms

And I wait until I see "Installable Packages" text 116ms

And I enter "mgr-push" as the filtered package name 50ms

And I click on the filter button 603ms

And I check "mgr-push" in the list 65ms

And I click on "Install Packages" 630ms

And I click on "Confirm" 840ms

Then I should see a "1 package install has been scheduled for" text 57ms

And I wait until event "Package Install/Upgrade scheduled" is completed 25s 30ms Show Error +
                                            
unknown error - Event failed (SystemCallError) ./features/step_definitions/navigation_steps.rb:107:in `block (2 levels) in (top (required))' ./features/support/commonlib.rb:100:in `block in repeat_until_timeout' ./features/support/commonlib.rb:89:in `repeat_until_timeout' ./features/step_definitions/navigation_steps.rb:99:in `/^I wait at most (\d+) seconds until the event is completed, refreshing the page$/' ./features/step_definitions/common_steps.rb:157:in `/^I wait (\d+) seconds until the event is picked up and (\d+) seconds until the event "([^"]*)" is completed$/' ./features/step_definitions/common_steps.rb:174:in `/^I wait at most (\d+) seconds until event "([^"]*)" is completed$/' ./features/step_definitions/common_steps.rb:151:in `/^I wait until event "([^"]*)" is completed$/' features/secondary/srv_push_package.feature:27:in `I wait until event "Package Install/Upgrade scheduled" is completed'

21s 11ms Show Info +
17:41:12:000 - 17:41:43:000 | Current URL: https://uyuni-master-server.sumaci.aws/rhn/systems/details/history/Event.do?sid=1000010023&aid=308
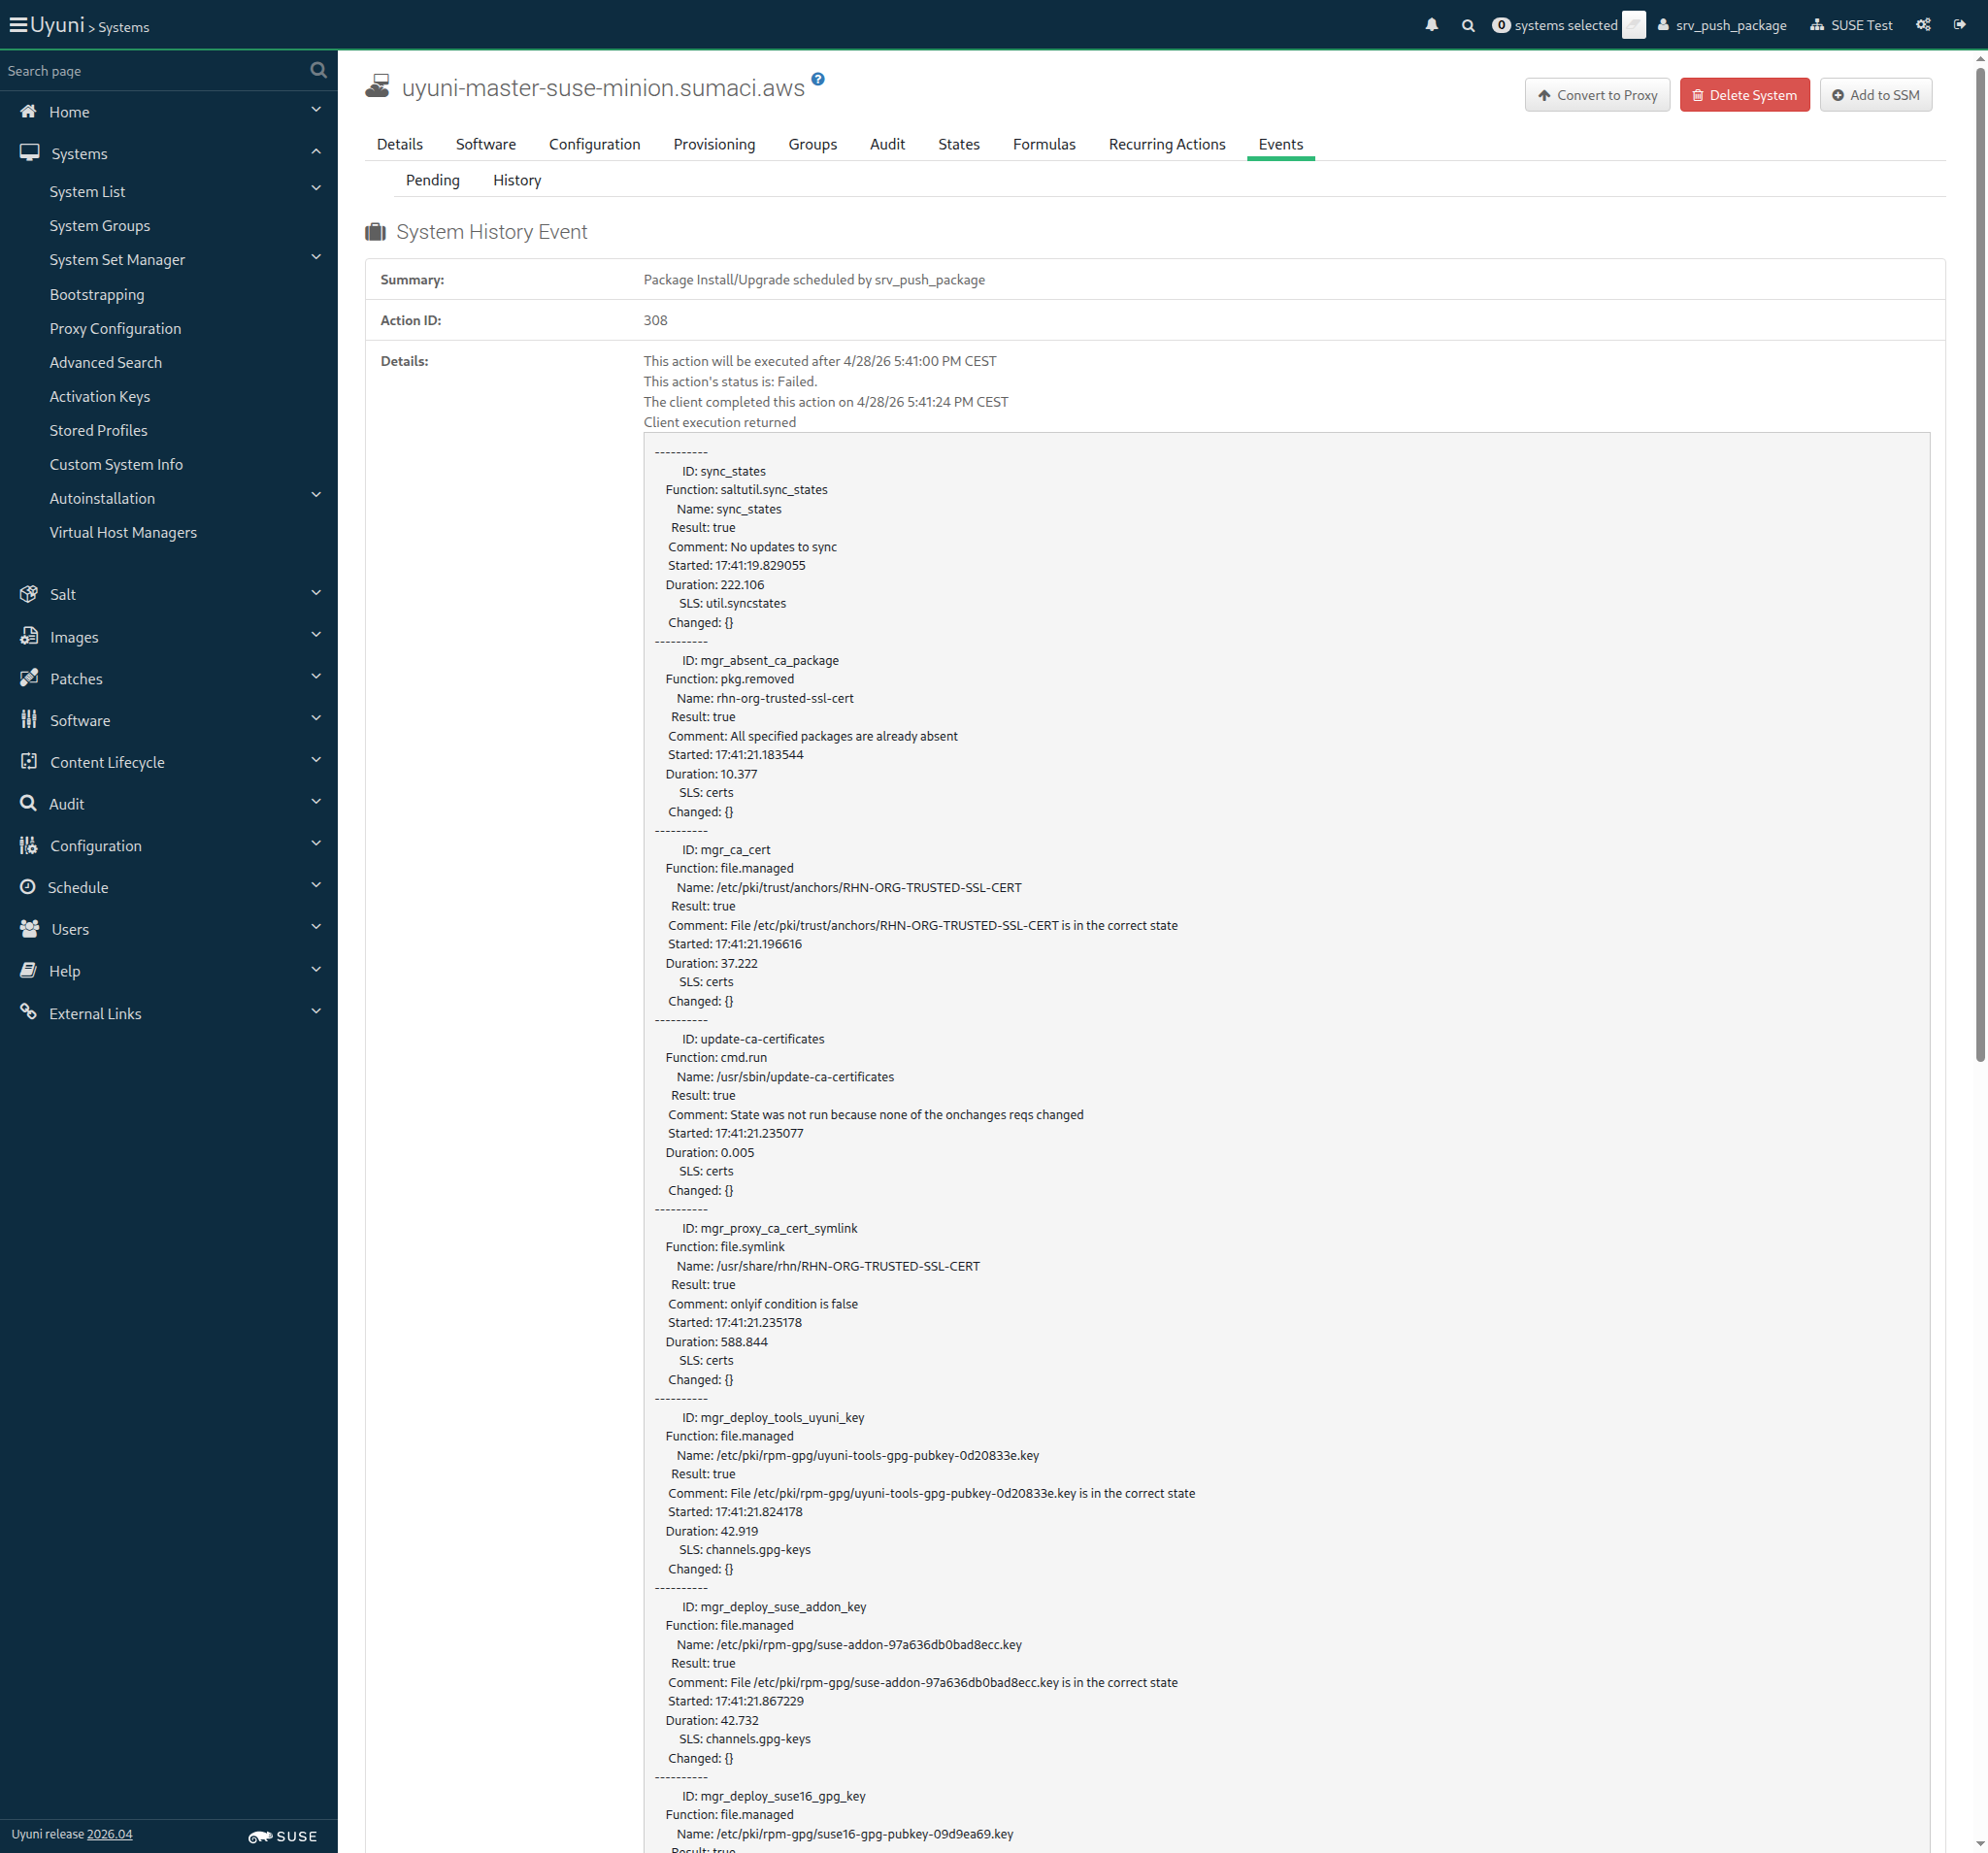
Screenshot +


When I copy unset package file on "sle_minion" 2s 20ms

And I push package "/root/subscription-tools-1.0-0.noarch.rpm" into "fake-base-channel-suse-like" channel through "sle_minion" 398ms Show Error +
                                            
FAIL: mgrpush -u admin -p admin --server=uyuni-master-server.sumaci.aws --nosig -c fake-base-channel-suse-like /root/subscription-tools-1.0-0.noarch.rpm returned status code = 127. Output: (ScriptError) ./features/support/remote_node.rb:172:in `run_local' ./features/support/remote_node.rb:120:in `run' ./features/step_definitions/common_steps.rb:327:in `/^I push package "([^"]*)" into "([^"]*)" channel through "([^"]*)"$/' features/secondary/srv_push_package.feature:31:in `I push package "/root/subscription-tools-1.0-0.noarch.rpm" into "fake-base-channel-suse-like" channel through "sle_minion"'

Then I should see package "subscription-tools-1.0-0.noarch" in channel "Fake-Base-Channel-SUSE-like" 0s

18s 776ms Show Info +
17:42:04:000 - 17:42:06:000 | Current URL: https://uyuni-master-server.sumaci.aws/rhn/systems/details/history/Event.do?sid=1000010023&aid=308
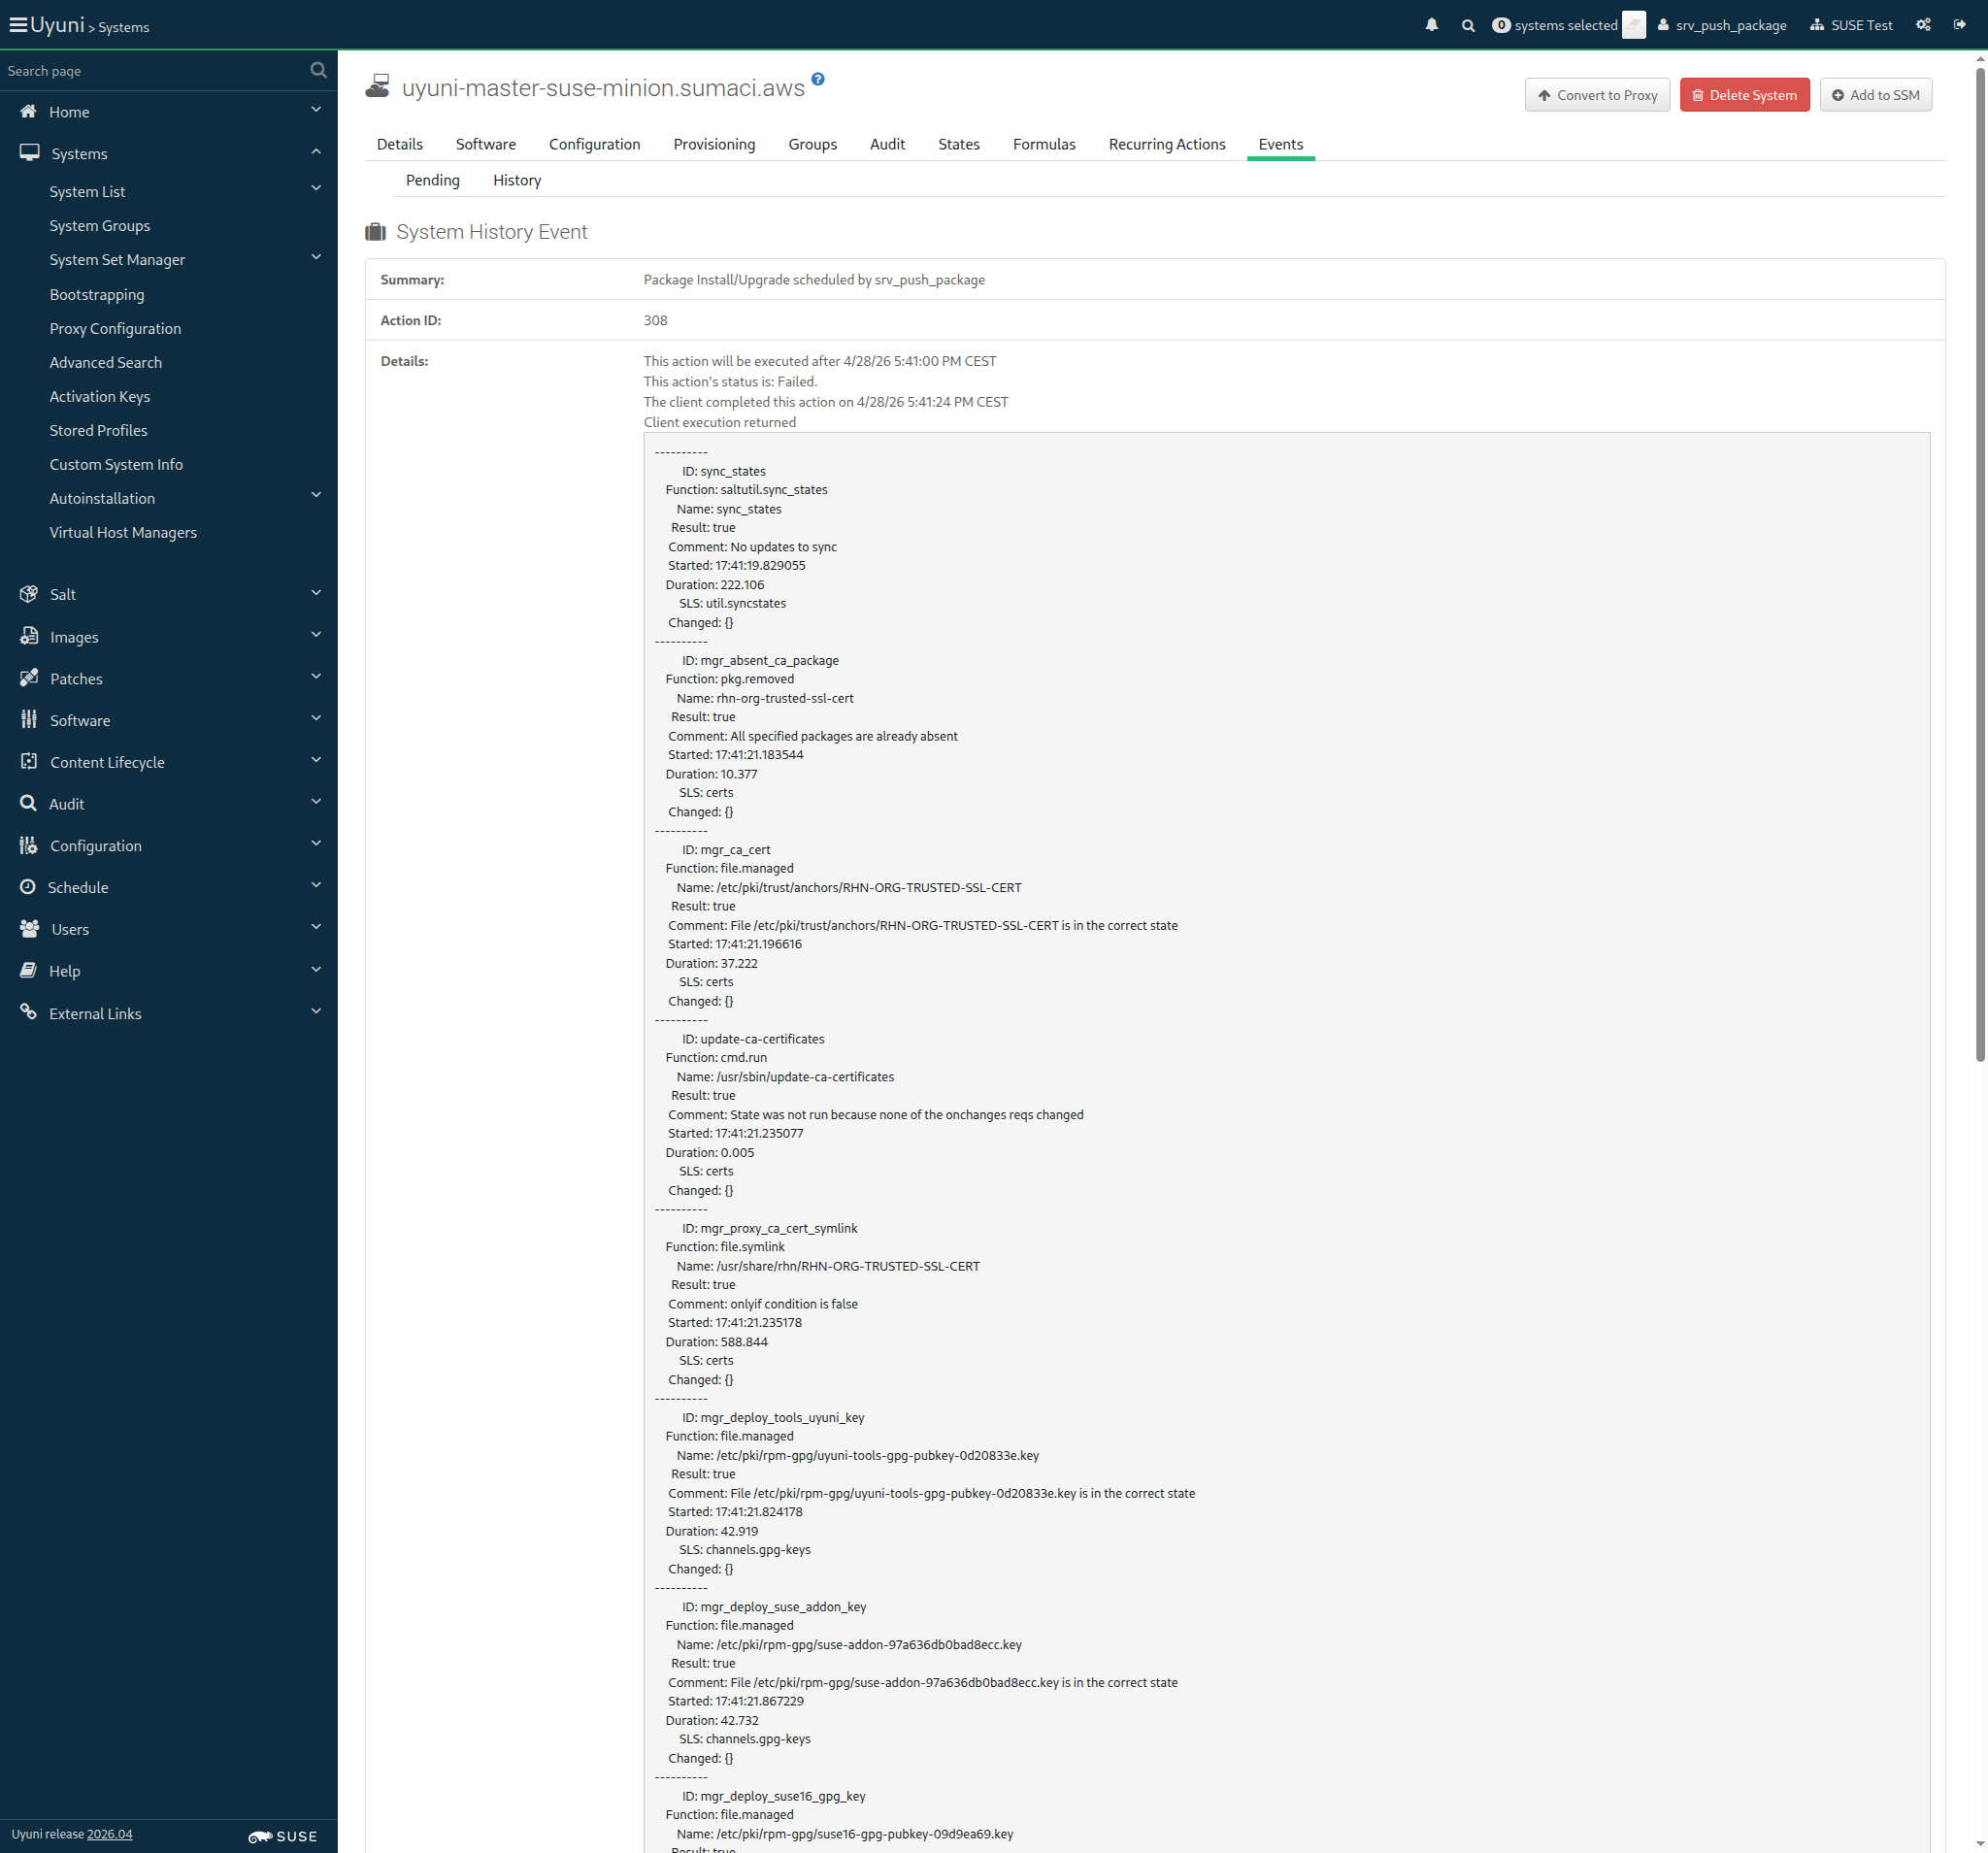
Screenshot +


When I follow the left menu "Software > Channel List > All" 205ms

And I follow "Fake-Base-Channel-SUSE-like" 775ms

And I follow "Packages" 659ms

And I follow "subscription-tools-1.0-0.noarch" 10s 12ms Show Error +
                                            
Unable to find link "subscription-tools-1.0-0.noarch" (Capybara::ElementNotFound) ./features/support/commonlib.rb:192:in `click_link_and_wait' ./features/step_definitions/navigation_steps.rb:366:in `/^I follow "([^"]*)"$/' features/secondary/srv_push_package.feature:38:in `I follow "subscription-tools-1.0-0.noarch"'

Then I should see a "Vendor:" text 0s

And I should see a "Not defined" text 0s

18s 618ms Show Info +
17:42:25:000 - 17:42:37:000 | Current URL: https://uyuni-master-server.sumaci.aws/rhn/channels/ChannelPackages.do?cid=121
Screenshot +


@skip_if_github_validation @scope_reportdb @bug_reported
Feature:Report database 1m 55s 686ms 9 1

* Related GitHub Card: https://github.com/SUSE/spacewalk/issues/29433
In order to use reporting tools
As an authorized user
I want to access and use the report database named "ReportDB"

Given I am authorized for the "Admin" section 1s 748ms

Then I should be able to connect to the ReportDB on the server 4s 370ms

And there should be a user allowed to create roles on the ReportDB 2s 678ms

When I create a read-only user for the ReportDB 3s 990ms

Then I should see the read-only user listed on the ReportDB user accounts 2s 809ms

When I connect to the ReportDB with read-only user from external machine 65ms

Then I should be able to query the ReportDB 1ms

Then I should not be able to "insert" data in a ReportDB "table" as a read-only user 3ms

And I should not be able to "update" data in a ReportDB "table" as a read-only user 1ms

And I should not be able to "delete" data in a ReportDB "table" as a read-only user < 1ms

And I should not be able to "insert" data in a ReportDB "view" as a read-only user < 1ms

And I should not be able to "update" data in a ReportDB "view" as a read-only user < 1ms

And I should not be able to "delete" data in a ReportDB "view" as a read-only user < 1ms

Given I know the ReportDB admin user credentials 7s 59ms

Then I should be able to connect to the ReportDB with the ReportDB admin user 60ms

And I should not be able to connect to product database with the ReportDB admin user 63ms

When I follow the left menu "Systems > System List > All" 193ms

And I make a list of the existing systems 10s 4ms

Then I should find the systems from the UI in the ReportDB < 1ms

Search by hostname: uyuni-master-suse-minion
[{"last_boot"=>"2026-04-28T13:25:56Z", "name"=>"uyuni-master-suse-minion.sumaci.aws", "id"=>1000010023, "last_checkin"=>"2026-04-28T15:41:24Z"}]

Given I have a property "City" with value "Arrakeen" on "sle_minion" 16s 688ms

And I know the current synced_date for "sle_minion" 1ms

When I schedule a task to update ReportDB 19s 663ms

Then I should find the updated "City" property as "Arrakeen" on the "sle_minion", on ReportDB 1ms

When I delete the read-only user for the ReportDB 5s 516ms

Then I shouldn't see the read-only user listed on the ReportDB user accounts 2s 881ms Show Error +
                                            
Created read-only user on the ReportDB remains listed (ScriptError) ./features/step_definitions/command_steps.rb:1426:in `/^I shouldn't see the read-only user listed on the ReportDB user accounts$/' features/secondary/srv_reportdb.feature:58:in `I shouldn't see the read-only user listed on the ReportDB user accounts'

20s 539ms Show Info +
17:44:37:000 - 17:44:46:000 | Current URL: https://uyuni-master-server.sumaci.aws/rhn/admin/BunchDetail.do?label=mgr-update-reporting-bunch
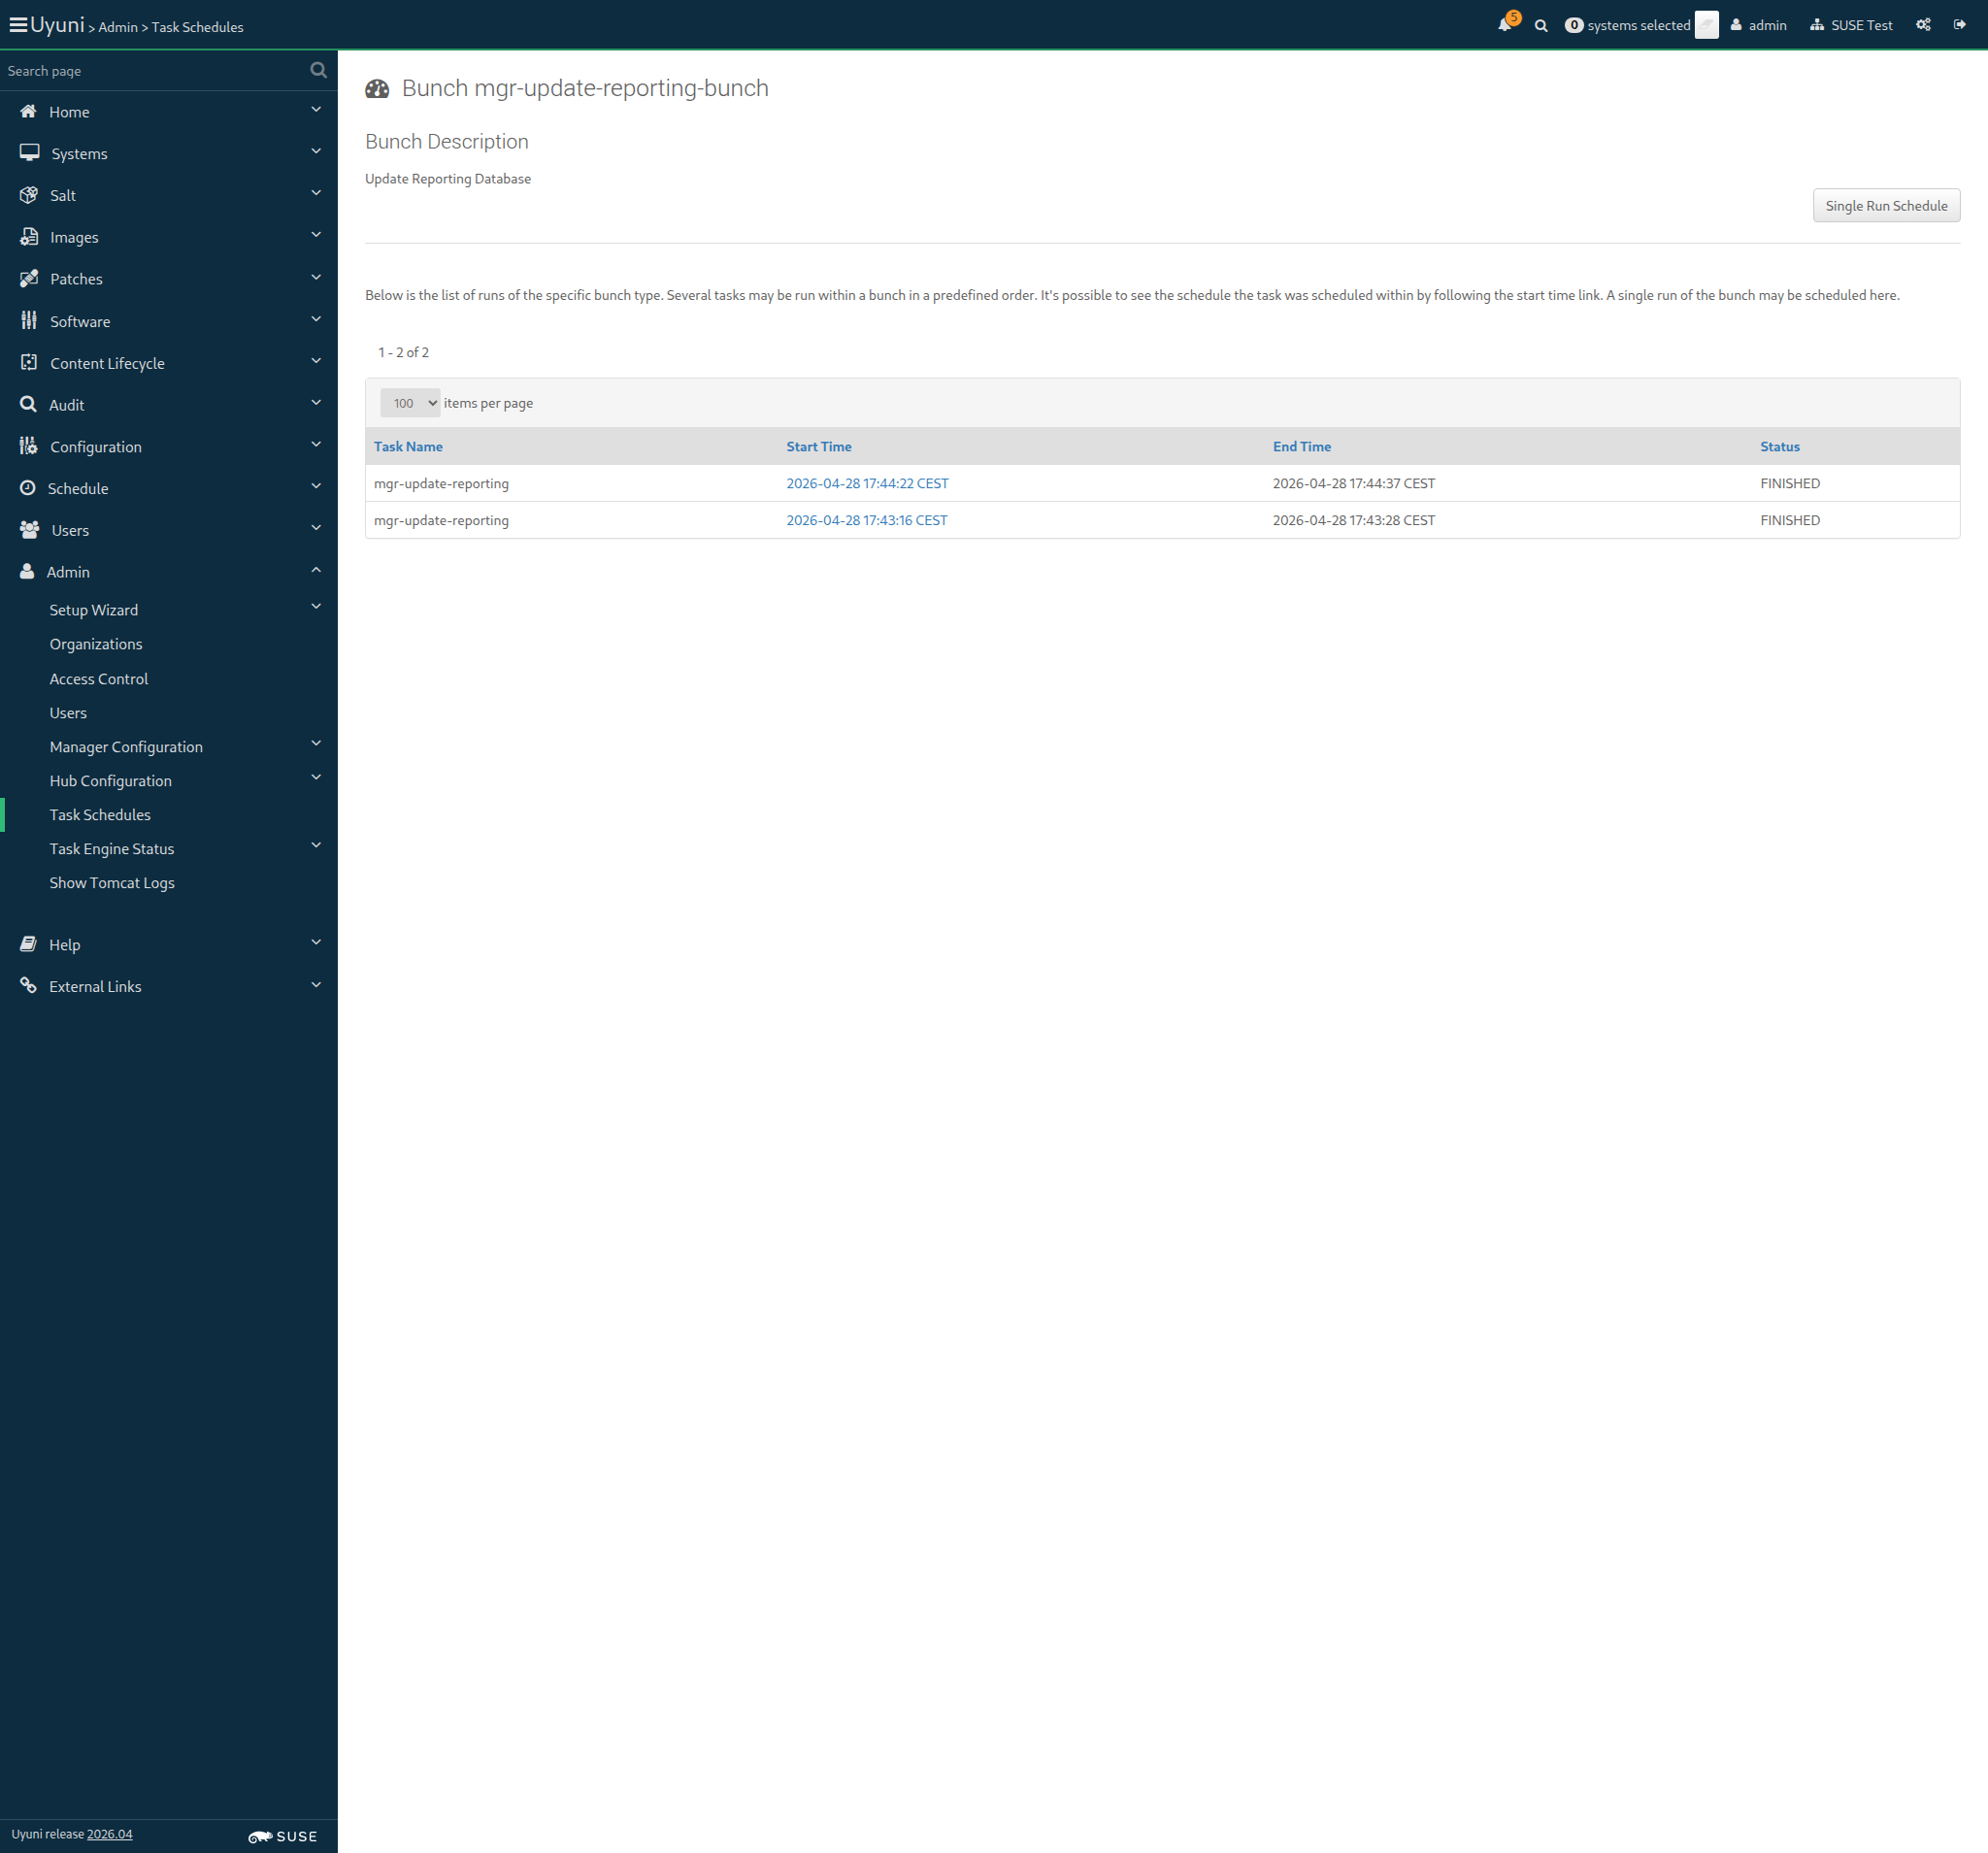
Screenshot +


* Related GitHub Card: https://github.com/SUSE/spacewalk/issues/23463

Given I am authorized 2s 219ms

When I follow the left menu "Software > Distribution Channel Mapping" 127ms

Then I should see a "Distribution Channel Mapping" text 54ms

And I should see a "Channel List" link in the left menu 25ms

And I should see a "Package Search" link in the left menu 20ms

And I should see a "Manage" link in the left menu 23ms

And I should see a "Distribution Channel Mapping" link in the left menu 22ms

And I should see a "Create Distribution Channel Mapping" link 11ms

And I should see a "No distribution channel mappings currently exist." text in the content area 21ms

When I follow the left menu "Software > Distribution Channel Mapping" 0s

And I follow "Create Distribution Channel Mapping" 0s

Then I should see a "Create Distribution Channel Map" text 0s

When I enter "SUSE Linux Enterprise Server 15 SP 4" as "os" 0s

And I enter "15.5" as "release" 0s

And I select "x86_64" from "architecture" 0s

And I select "SLE-Product-SLES15-SP7-Pool for x86_64" from "channel_label" 0s

And I click on "Create Mapping" 0s

Then I should see a "SUSE Linux Enterprise Server 15 SP 4" link in the content area 0s

When I follow the left menu "Software > Distribution Channel Mapping" 74ms

And I follow "Create Distribution Channel Mapping" 374ms

Then I should see a "Create Distribution Channel Map" text 64ms

When I enter "openSUSE Tumbleweed" as "os" 69ms

And I enter "20250928" as "release" 58ms

And I select "x86_64" from "architecture" 74ms

And I select "openSUSE Tumbleweed (x86_64)" from "channel_label" 61ms

And I click on "Create Mapping" 533ms

Then I should see a "openSUSE Tumbleweed" link in the content area 26ms

When I follow the left menu "Software > Distribution Channel Mapping" 64ms

And I follow "Create Distribution Channel Mapping" 355ms

Then I should see a "Create Distribution Channel Map" text 57ms

When I enter "Ubuntu 24.04" as "os" 57ms

And I enter "24.04" as "release" 48ms

And I select "AMD64 Debian" from "architecture" 56ms

And I select "Fake-Base-Channel-Debian-like" from "channel_label" 58ms

And I click on "Create Mapping" 508ms

Then I should see a "Ubuntu 24.04" link in the content area 23ms

When I follow the left menu "Software > Distribution Channel Mapping" 66ms

And I follow "Create Distribution Channel Mapping" 301ms

Then I should see a "Create Distribution Channel Map" text 56ms

When I enter "SUSE Linux Enterprise Server 15 SP 4 iSeries" as "os" 91ms

And I enter "15.5" as "release" 51ms

And I select "iSeries" from "architecture" 63ms

And I select "Fake-Base-Channel-i586" from "channel_label" 58ms

And I click on "Create Mapping" 502ms

Then I should see a "SUSE Linux Enterprise Server 15 SP 4 iSeries" link in the content area 23ms

When I follow the left menu "Software > Distribution Channel Mapping" 0s

Then I should see the text "SUSE Linux Enterprise Server 15 SP 4" in the Operating System field 0s

And I should see the text "x86_64" in the Architecture field 0s

And I should see the text "sle-product-sles15-sp7-pool-x86_64" in the Channel Label field 0s

When I follow "SUSE Linux Enterprise Server 15 SP 4" 0s

Then I should see a "Update Distribution Channel Map" text 0s

When I enter "SUSE Linux Enterprise Server 15 SP 4 modified" as "os" 0s

And I select "SLE-Product-SLES15-SP7-Pool for x86_64" from "channel_label" 0s

And I click on "Update Mapping" 0s

Then I should see the text "SUSE Linux Enterprise Server 15 SP 4 modified" in the Operating System field 0s

And I should see the text "sle-product-sles15-sp7-pool-x86_64" in the Channel Label field 0s

When I follow the left menu "Software > Distribution Channel Mapping" 69ms

Then I should see the text "openSUSE Tumbleweed" in the Operating System field 10s 9ms

And I should see the text "x86_64" in the Architecture field 10s 4ms

And I should see the text "opensuse_tumbleweed-x86_64" in the Channel Label field 10s 11ms

When I follow "openSUSE Tumbleweed" 317ms

Then I should see a "Update Distribution Channel Map" text 55ms

When I enter "openSUSE Tumbleweed modified" as "os" 105ms

And I select "openSUSE Tumbleweed (x86_64)" from "channel_label" 46ms

And I click on "Update Mapping" 65ms

Then I should see the text "openSUSE Tumbleweed modified" in the Operating System field 10s 8ms

And I should see the text "opensuse_tumbleweed-x86_64" in the Channel Label field 10s 6ms

When I follow the left menu "Software > Distribution Channel Mapping" 83ms

Then I should see the text "Ubuntu 24.04" in the Operating System field 10s 10ms

And I should see the text "AMD64 Debian" in the Architecture field 10s 13ms

And I should see the text "fake-base-channel-debian-like" in the Channel Label field 10s 10ms

When I follow "Ubuntu 24.04" 367ms

And I enter "Ubuntu 24.04 modified" as "os" 93ms

And I click on "Update Mapping" 570ms

Then I should see the text "Ubuntu 24.04 modified" in the Operating System field 10s 12ms

When I follow the left menu "Software > Distribution Channel Mapping" 80ms

Then I should see the text "SUSE Linux Enterprise Server 15 SP 4 iSeries" in the Operating System field 10s 7ms

And I should see the text "iSeries" in the Architecture field 10s 2ms

And I should see the text "fake-base-channel-i586" in the Channel Label field 10s 14ms

When I follow "SUSE Linux Enterprise Server 15 SP 4 iSeries" 303ms

And I enter "SUSE Linux Enterprise Server 15 SP 4 iSeries modified" as "os" 149ms

And I select "Fake-Base-Channel-Debian-like" from "channel_label" 65ms

And I click on "Update Mapping" 64ms

Then I should see the text "SUSE Linux Enterprise Server 15 SP 4 iSeries modified" in the Operating System field 10s 11ms

And I should see the text "fake-base-channel-debian-like" in the Channel Label field 10s 9ms

When I follow the left menu "Software > Distribution Channel Mapping" 0s

Then I should see the text "SUSE Linux Enterprise Server 15 SP 4 modified" in the Operating System field 0s

And I should see the text "x86_64" in the Architecture field 0s

When I follow "SUSE Linux Enterprise Server 15 SP 4 modified" 0s

Then I should see a "Update Distribution Channel Map" text 0s

And I should see a "Delete Distribution Channel" link 0s

When I follow "Delete Distribution Channel Mapping" 0s

Then I should see a "Delete Distribution Channel Map" text 0s

When I click on "Delete Mapping" 0s

Then I should not see a "SUSE Linux Enterprise Server 15 SP 4 modified" link 0s

When I follow the left menu "Software > Distribution Channel Mapping" 86ms

Then I should see the text "openSUSE Tumbleweed modified" in the Operating System field 10s 2ms

And I should see the text "x86_64" in the Architecture field 10s 7ms

When I follow "openSUSE Tumbleweed modified" 308ms

Then I should see a "Update Distribution Channel Map" text 57ms

And I should see a "Delete Distribution Channel" link 11ms

When I follow "Delete Distribution Channel Mapping" 333ms

Then I should see a "Delete Distribution Channel Map" text 48ms

When I click on "Delete Mapping" 439ms

Then I should not see a "openSUSE Tumbleweed modified" link 8ms

When I follow the left menu "Software > Distribution Channel Mapping" 81ms

Then I should see the text "Ubuntu 24.04 modified" in the Operating System field 10s 10ms

And I should see the text "AMD64 Debian" in the Architecture field 10s 8ms

When I follow "Ubuntu 24.04 modified" 300ms

Then I should see a "Update Distribution Channel Map" text 56ms

And I should see a "Delete Distribution Channel" link 11ms

When I follow "Delete Distribution Channel Mapping" 315ms

Then I should see a "Delete Distribution Channel Map" text 50ms

When I click on "Delete Mapping" 476ms

Then I should not see a "Ubuntu 24.04 modified" link 8ms

When I follow the left menu "Software > Distribution Channel Mapping" 79ms

Then I should see the text "SUSE Linux Enterprise Server 15 SP 4 iSeries modified" in the Operating System field 10s 5ms

And I should see the text "x86_64" in the Architecture field 10s 10ms

When I follow "SUSE Linux Enterprise Server 15 SP 4 iSeries modified" 350ms

Then I should see a "Update Distribution Channel Map" text 56ms

And I should see a "Delete Distribution Channel" link 12ms

When I follow "Delete Distribution Channel Mapping" 250ms

Then I should see a "Delete Distribution Channel Map" text 49ms

When I click on "Delete Mapping" 438ms

Then I should not see a "SUSE Linux Enterprise Server 15 SP 4 iSeries modified" link 8ms

When I follow the left menu "Software > Distribution Channel Mapping" 84ms

Then I should see a "Distribution Channel Mapping" text 50ms

And I should see a "No distribution channel mappings currently exist." text in the content area 21ms

Given I am authorized for the "Admin" section 1s 599ms

When I follow the left menu "Admin > Task Engine Status > Last Execution Times" 0s

Then I should see a "Task Engine Status" text 0s

And I should see a "The following is a status report for the various tasks run by the SUSE Multi-Linux Manager task engine:" text 0s

And I should see a "Runtime Status" text 0s

And I should see a "Last Execution Times" link in the left menu 0s

And I should see a "Runtime Status" link in the left menu 0s

When I follow the left menu "Admin > Task Engine Status > Last Execution Times" 768ms

Then I should see a "Task Engine Status" text 96ms

And I should see a "The following is a status report for the various tasks run by the Uyuni task engine:" text 96ms

And I should see a "Runtime Status" text 86ms

And I should see a "Last Execution Times" link in the left menu 25ms

And I should see a "Runtime Status" link in the left menu 21ms

When I follow the left menu "Admin > Task Engine Status > Runtime Status" 77ms

Then I should see a "Task Engine Status" text 55ms

And I should see a "Last Execution Times" text 56ms

And I should see a "The server is running or has finished executing the following tasks during the latest 5 minutes." text 361ms

And I should see a "Last Execution Times" link in the left menu 20ms

And I should see a "Runtime Status" link in the left menu 19ms

When I follow the left menu "Admin > Task Engine Status > Last Execution Times" 72ms

And I run "cobbler sync" on "server" 5s 493ms

And I refresh the page 10s 344ms

Then I should see a "Cobbler Sync:" text 91ms

And I should see the correct timestamp for task "Cobbler Sync:" 10s 11ms

And I should see a "FINISHED" text 84ms

When I follow the left menu "Admin > Task Engine Status > Runtime Status" 0s

And I follow the left menu "Admin > Setup Wizard > Products" 0s

And I wait until I do not see "Loading" text 0s

And I enter "SUSE Linux Enterprise Server 15 SP7 x86_64" as "product-description-filter" 0s

And I wait until I see "SUSE Linux Enterprise Server 15 SP7 x86_64" text 0s

Then I should see the "SUSE Linux Enterprise Server 15 SP7 x86_64" selected 0s

When I click on "Schedule channels product resync" 0s

And I follow the left menu "Admin > Task Engine Status > Runtime Status" 0s

And I wait until I see "repo-sync" text 0s

Then I should see the correct timestamp for task "repo-sync" 0s

And I should see a "running" text in the content area 0s

And I wait until I see "finished" text 0s

And I should see the correct timestamp for task "repo-sync" 0s

When I retrieve the relevant errata for ssh_minion 4s 556ms

When I retrieve the relevant errata for ssh_minion, rhlike_minion, deblike_minion 1s 428ms

A supportconfig generated from the Uyuni server
should be able to be parsed by Health Check tool.

When I generate a supportconfig for the server 1m 16s 464ms

Then I obtain and extract the supportconfig from the server 1s 675ms

When I start the health check tool with supportconfig "/root/server-supportconfig/uyuni-server-supportconfig/" on "localhost" 14s 117ms

Then I check that the health check tool is running on "localhost" 230ms

When I wait until port "9000" is listening on "localhost" host 224ms

Then I wait until port "3100" is listening on "localhost" host 225ms

And I wait until port "9081" is listening on "localhost" host 218ms

And I wait until port "3000" is listening on "localhost" host 237ms

Then I check that the health check tool exposes metrics on "localhost" 212ms

When I stop health check tool on "localhost" 5s 141ms

Then I check that the health check tool is not running on "localhost" 285ms

And I remove test supportconfig on "localhost" 182ms

As an organization administrator,
I want to configure and enforce password complexity requirements,
So that user accounts comply with security policies

Given I am authorized as "admin" with password "admin" 415ms

When I follow the left menu "Admin > Manager Configuration > Password Policy" 837ms

Then I should see a "Server Configuration - Password Policy" text 99ms

When I set the minimum password length to "5" 65ms

And I set the maximum password length to "12" 57ms

And I enable the following restrictions: 329ms
Require Digits
Require Lowercase Characters
Require Uppercase Characters
Require Special Characters
Restrict Characters Occurrences
Restrict Consecutive Characters

And I click on "Save" 59ms

And I should see a "Password Policy Changed" text 188ms

When I refresh the page 10s 407ms

Then the following restrictions should be enabled: 49ms
Require Digits
Require Lowercase Characters
Require Uppercase Characters
Require Special Characters
Restrict Characters Occurrences
Restrict Consecutive Characters

When I set the special characters list to "$@?" 67ms

And I set the maximum allowed occurrence of any character to "3" 48ms

And I click on "Save" 55ms

And I should see a "Password Policy Changed" text 202ms

Failed to create user password_policy_user: unknown error - API failure: Passwords must be at least 5 characters.

When I create a user with name "password_policy_user" and password "aB$1" with roles "config_admin,system_group_admin,activation_key_admin,image_admin" 9s 684ms

Then the user creation should fail with error containing "Passwords must be at least 5 characters" < 1ms

Failed to create user password_policy_user: unknown error - API failure: Passwords must contain at least one upper case character.

When I create a user with name "password_policy_user" and password "ab$123" with roles "config_admin,system_group_admin,activation_key_admin,image_admin" 9s 799ms

Then the user creation should fail with error containing "Passwords must contain at least one upper case character" < 1ms

Failed to create user password_policy_user: unknown error - API failure: Passwords must contain at least one lower case character.

When I create a user with name "password_policy_user" and password "AB$123" with roles "config_admin,system_group_admin,activation_key_admin,image_admin" 9s 672ms

Then the user creation should fail with error containing "Passwords must contain at least one lower case character" < 1ms

Failed to create user password_policy_user: unknown error - API failure: Passwords must contain at least one digit.

When I create a user with name "password_policy_user" and password "aB$cde" with roles "config_admin,system_group_admin,activation_key_admin,image_admin" 10s 1ms

Then the user creation should fail with error containing "Passwords must contain at least one digit" < 1ms

Failed to create user password_policy_user: unknown error - API failure: Passwords must contain at least one special character, allowed special characters are: !$%&()*+,./:;<=>?[]^_{|}~$@?.

When I create a user with name "password_policy_user" and password "aBc123" with roles "config_admin,system_group_admin,activation_key_admin,image_admin" 10s 580ms

Then the user creation should fail with error containing "Passwords must contain at least one special character" < 1ms

New user password_policy_user created with roles: config_admin, system_group_admin, activation_key_admin, image_admin

When I create a user with name "password_policy_user" and password "aB:123" with roles "config_admin,system_group_admin,activation_key_admin,image_admin" 13s 337ms

Then the user creation should fail with error containing "Passwords must contain at least one special character, allowed special characters are: $@?" < 1ms Show Error +
                                            
Expected user creation to fail, but status was 'success' (RuntimeError) ./features/step_definitions/common_steps.rb:356:in `/^the user creation should fail with error containing "([^"]*)"$/' features/secondary/srv_password_restriction.feature:58:49:in `the user creation should fail with error containing "Passwords must contain at least one special character, allowed special characters are: $@?"'

18s 47ms Show Info +
17:53:15:000 - 17:53:28:000 | Current URL: https://uyuni-master-server.sumaci.aws/rhn/manager/admin/config/password-policy
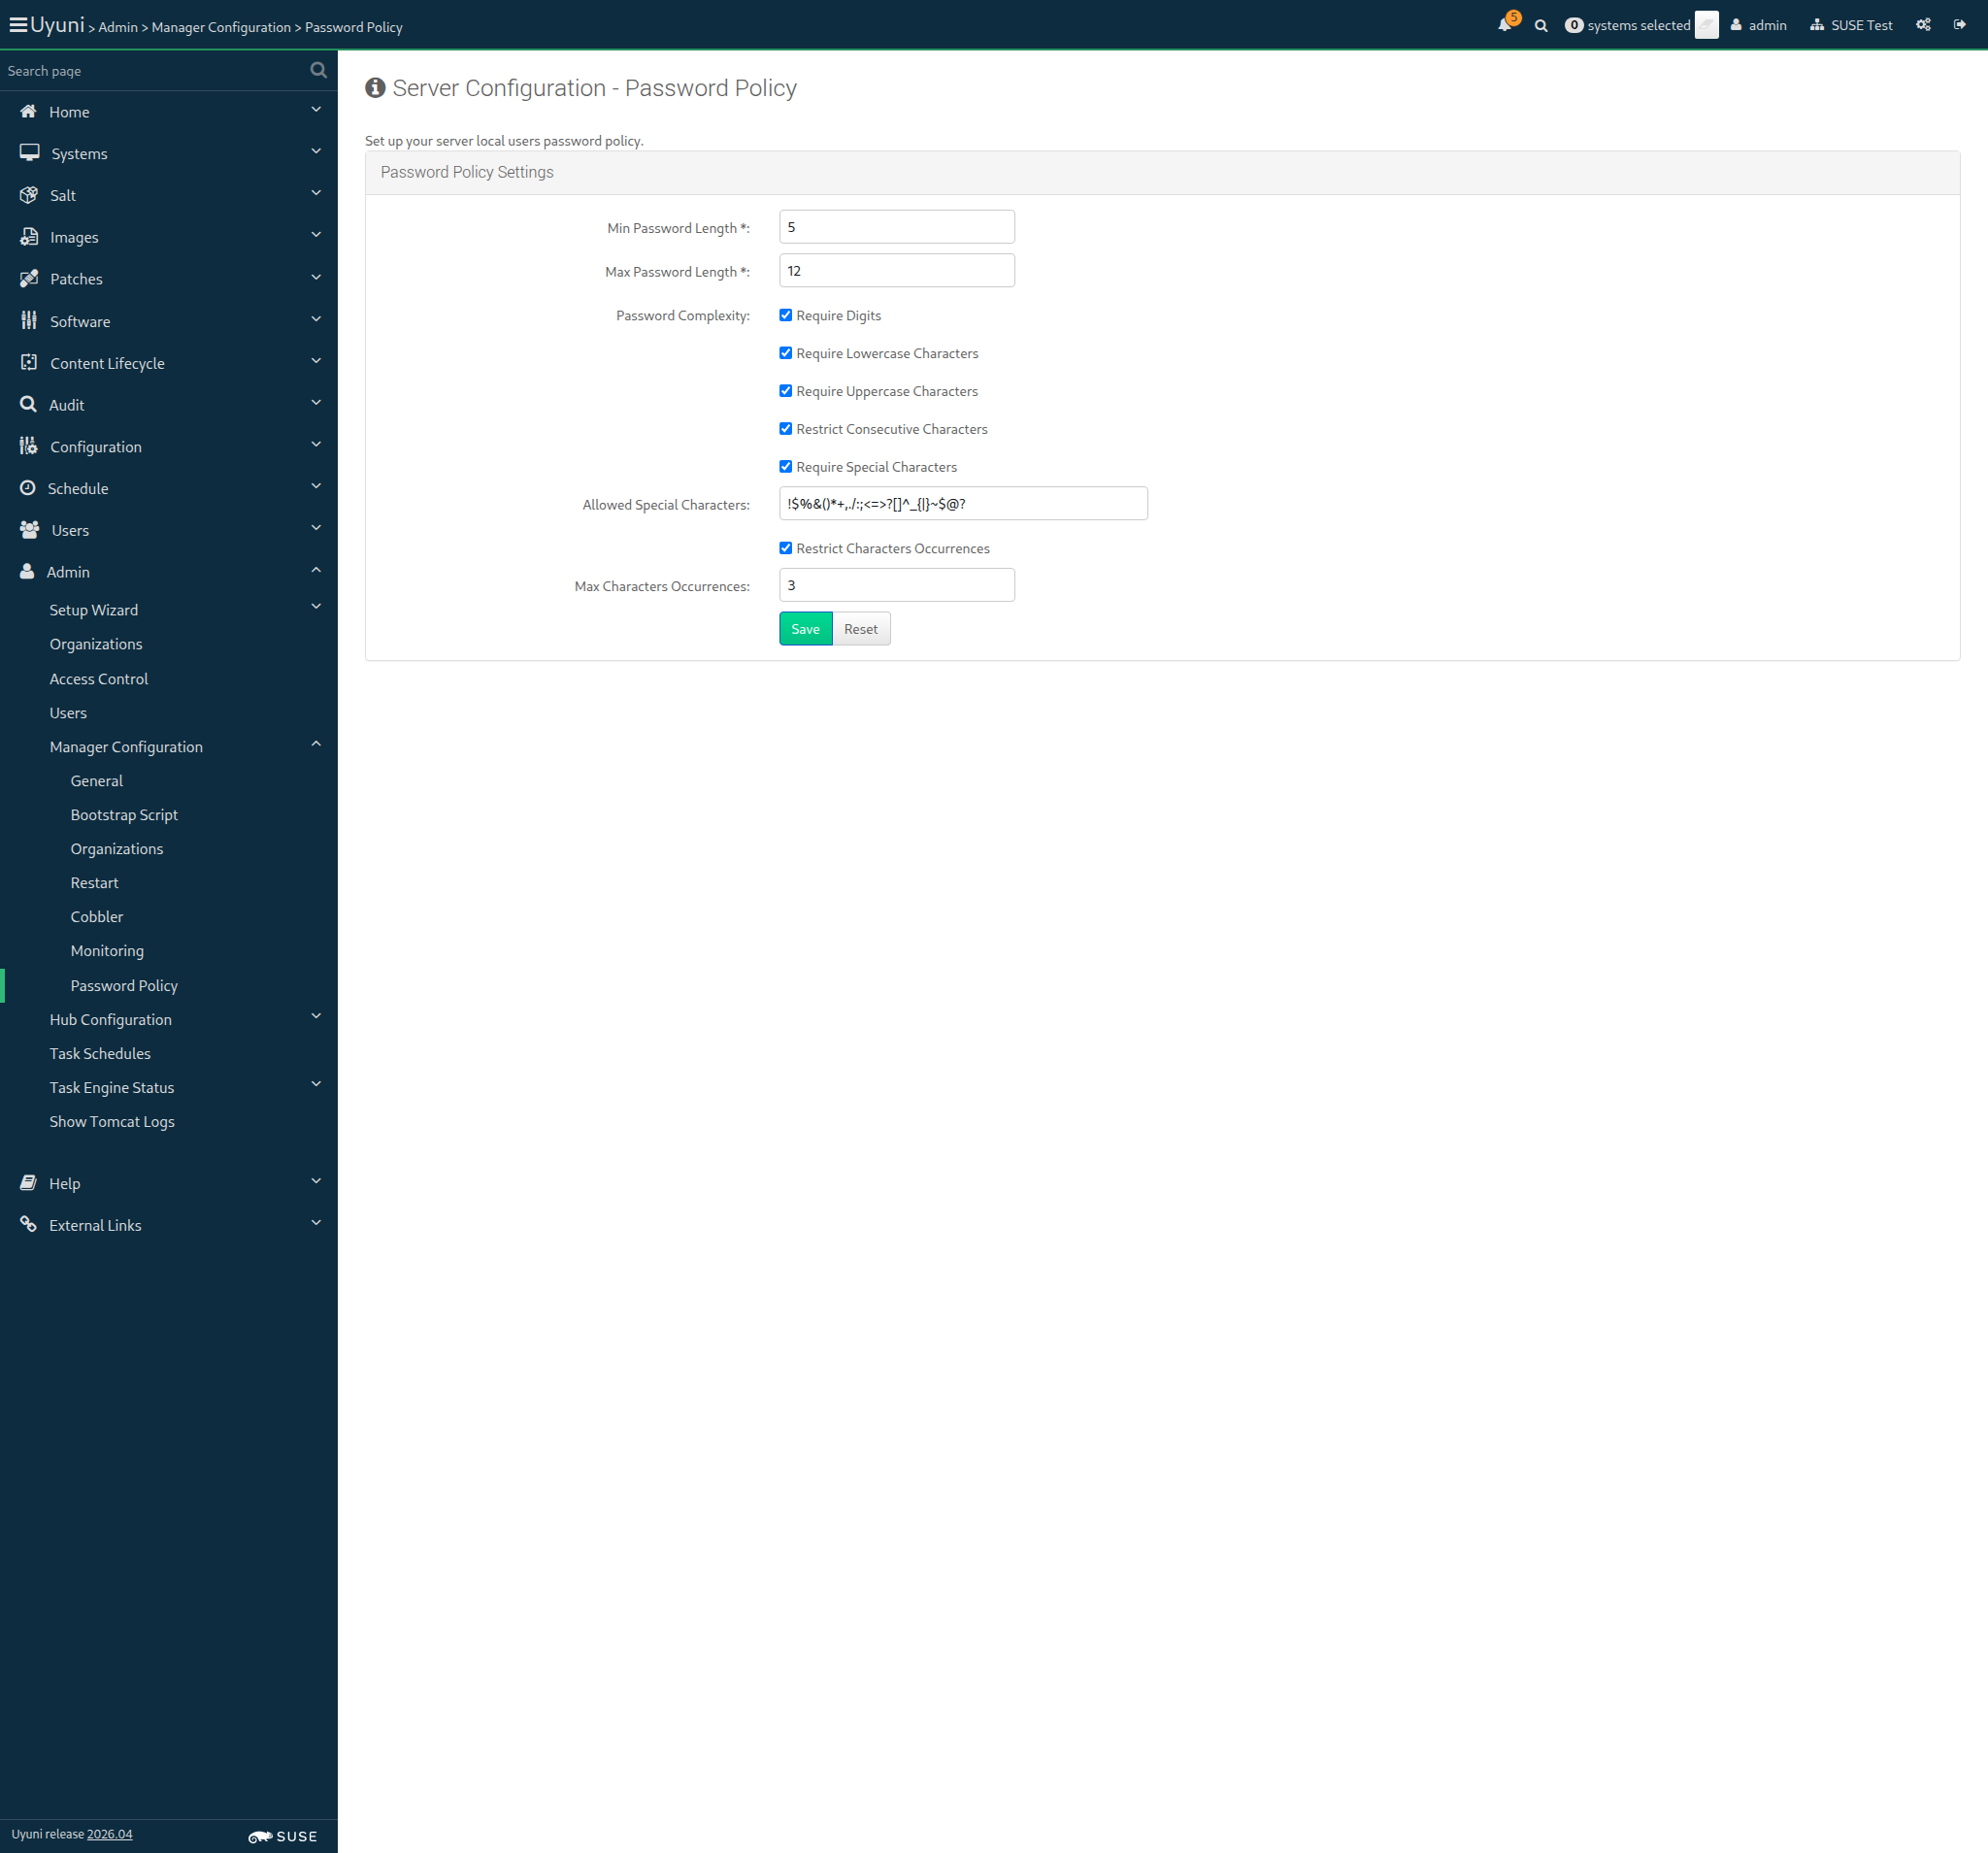
Screenshot +


When I create a user with name "password_policy_user" and password "aaB$123" with roles "config_admin,system_group_admin,activation_key_admin,image_admin" 9s 527ms

Then the user creation should fail with error containing "consecutive_characters_presents" < 1ms Show Error +
                                            
Expected user creation to fail, but status was 'success' (RuntimeError) ./features/step_definitions/common_steps.rb:356:in `/^the user creation should fail with error containing "([^"]*)"$/' features/secondary/srv_password_restriction.feature:59:49:in `the user creation should fail with error containing "consecutive_characters_presents"'

48s 806ms Show Error +
                                            
User is not logged in (ScriptError) ./features/step_definitions/navigation_steps.rb:655:in `/^I should be logged in$/' ./features/step_definitions/navigation_steps.rb:635:in `/^I am authorized as "([^"]*)" with password "([^"]*)"$/' ./features/support/env.rb:236:in `block in relog_and_visit_previous_url' ./features/support/env.rb:234:in `relog_and_visit_previous_url' ./features/support/env.rb:214:in `handle_screenshot_and_relog' ./features/support/env.rb:174:in `After'
Show Info +
17:53:46:000 - 17:53:56:000 | Current URL: https://uyuni-master-server.sumaci.aws/rhn/manager/admin/config/password-policy
Screenshot +


When I create a user with name "password_policy_user" and password "aB$a12aa3" with roles "config_admin,system_group_admin,activation_key_admin,image_admin" 8s 865ms

Then the user creation should fail with error containing "Password characters occurrences exceeded maximum allowed 3" < 1ms Show Error +
                                            
Expected user creation to fail, but status was 'success' (RuntimeError) ./features/step_definitions/common_steps.rb:356:in `/^the user creation should fail with error containing "([^"]*)"$/' features/secondary/srv_password_restriction.feature:60:49:in `the user creation should fail with error containing "Password characters occurrences exceeded maximum allowed 3"'

When I create a user with name "password_policy_user" and password "aBcdef$123456" with roles "config_admin,system_group_admin,activation_key_admin,image_admin" 9s 902ms

Then the user creation should fail with error containing "Passwords cannot be more than 12 characters" < 1ms Show Error +
                                            
Expected user creation to fail, but status was 'success' (RuntimeError) ./features/step_definitions/common_steps.rb:356:in `/^the user creation should fail with error containing "([^"]*)"$/' features/secondary/srv_password_restriction.feature:61:49:in `the user creation should fail with error containing "Passwords cannot be more than 12 characters"'

When I create a user with name "password_policy_user" and password "aB$123" with roles "config_admin,system_group_admin,activation_key_admin,image_admin" 9s 902ms

Then the user creation should succeed < 1ms

When I follow the left menu "Admin > Manager Configuration > Password Policy" 10s 12ms Show Error +
                                            
Unable to find xpath "//aside/div[@id='nav']/nav/ul/li/div/a[contains(.,'Admin')]/parent::div/parent::li" (Capybara::ElementNotFound) ./features/step_definitions/navigation_steps.rb:441:in `block (2 levels) in (top (required))' ./features/step_definitions/navigation_steps.rb:433:in `each' ./features/step_definitions/navigation_steps.rb:433:in `each_with_index' ./features/step_definitions/navigation_steps.rb:433:in `/^I follow the left menu "([^"]*)"$/' features/secondary/srv_password_restriction.feature:68:in `I follow the left menu "Admin ) Manager Configuration ) Password Policy"'

And I click on "Reset" 0s

And I should see a "Password Policy Reset to Default" text 0s

And I refresh the page 0s

Then the following restrictions should be disabled: 0s
Require Digits
Require Lowercase Characters
Require Uppercase Characters
Require Special Characters
Restrict Characters Occurrences
Restrict Consecutive Characters

When I delete user "password_policy_user" 408ms

@skip_if_github_validation @build_host @scope_building_container_images @scope_cve_audit @no_auth_registry
Feature:Build container images and CVE audit them 19m 37s 876ms 16 14

Given I am authorized 10s 827ms

GITPROFILES: https://github.com/uyuni-project/uyuni.git#:testsuite/features/profiles/temporary

When I follow the left menu "Images > Profiles" 131ms

And I follow "Create" 522ms

And I enter "suse_simple" as "label" 120ms

And I select "galaxy-registry" from "imageStore" 1s 127ms

And I enter "Docker" relative to profiles as "path" 906ms

And I click on "create-btn" 66ms

GITPROFILES: https://github.com/uyuni-project/uyuni.git#:testsuite/features/profiles/temporary

When I follow the left menu "Images > Profiles" 673ms

And I follow "Create" 518ms

And I enter "suse_real_simple" as "label" 137ms

And I select "galaxy-registry" from "imageStore" 1s 143ms

And I enter "Docker/serverhost" relative to profiles as "path" 1s 15ms

And I click on "create-btn" 52ms

GITPROFILES: https://github.com/uyuni-project/uyuni.git#:testsuite/features/profiles/temporary

When I follow the left menu "Images > Profiles" 61ms

And I follow "Create" 477ms

And I enter "suse_key" as "label" 84ms

And I select "galaxy-registry" from "imageStore" 1s 143ms

And I select "1-SUSE-KEY-x86_64" from "activationKey" 1s 123ms

And I enter "Docker" relative to profiles as "path" 917ms

And I click on "create-btn" 58ms

GITPROFILES: https://github.com/uyuni-project/uyuni.git#:testsuite/features/profiles/temporary

When I follow the left menu "Images > Profiles" 61ms

And I follow "Create" 601ms

And I enter "suse_real_key" as "label" 102ms

And I select "galaxy-registry" from "imageStore" 1s 148ms

And I select "1-SUSE-KEY-x86_64" from "activationKey" 1s 112ms

And I enter "Docker/serverhost" relative to profiles as "path" 980ms

And I click on "create-btn" 55ms

Event Details: ---------- ID: mgr_registries_login Function: module.run Name: docker.login Result: true Comment: Module function docker.login executed Started: 17:57:24.700574 Duration: 1.356 SLS: images.docker Changed: ret: retcode: 0.0 Errors: [ ] Results: { } ---------- ID: mgr_buildimage Function: module.run Name: docker.build Result: false Comment: Module function docker.build threw an exception. Exception: Build failed for https://github.com/uyuni-project/uyuni.git#:testsuite/features/profiles/temporary/docker_profiles/cloud_aws/Docker. Error(s) follow: manifest for ip-172-16-1-175.eu-central-1.compute.internal/suse/sle15:15.7 not found: manifest unknown: manifest unknown Started: 17:57:24.702231 Duration: 13552.827 SLS: images.docker Changed: {} ---------- ID: mgr_pushimage Function: module.run Name: docker.push Result: false Comment: One or more requisite failed: images.docker.mgr_buildimage Started: 17:57:38.255567 Duration: 0.005 SLS: images.docker Changed: {} ---------- ID: mgr_registries_logout Function: module.run Name: docker.logout Result: false Comment: One or more requisite failed: images.docker.mgr_pushimage Started: 17:57:38.255884 Duration: 0.005 SLS: images.docker Changed: {} ---------- ID: mgr_buildimage_docker_collect_logs Function: file.touch Name: /var/log/image-build309.log Result: true Comment: Updated times on file /var/log/image-build309.log Started: 17:57:38.258637 Duration: 7.239 SLS: images.docker Changed: touched: /var/log/image-build309.log ---------- ID: mgr_buildimage_docker_collect_logs Function: module.run Name: cp.push Result: true Comment: Module function cp.push executed Started: 17:57:38.266001 Duration: 9.32 SLS: images.docker Changed: ret: true

Given I am on the Systems overview page of this "build_host" 3s 345ms

When I schedule the build of image "suse_key" via API calls 930ms

And I wait at most 660 seconds until event "Image Build suse_key scheduled" is completed 41s 503ms Show Error +
                                            
unknown error - Event failed (SystemCallError) ./features/step_definitions/navigation_steps.rb:107:in `block (2 levels) in (top (required))' ./features/support/commonlib.rb:100:in `block in repeat_until_timeout' ./features/support/commonlib.rb:89:in `repeat_until_timeout' ./features/step_definitions/navigation_steps.rb:99:in `/^I wait at most (\d+) seconds until the event is completed, refreshing the page$/' ./features/step_definitions/common_steps.rb:157:in `/^I wait (\d+) seconds until the event is picked up and (\d+) seconds until the event "([^"]*)" is completed$/' ./features/step_definitions/common_steps.rb:174:in `/^I wait at most (\d+) seconds until event "([^"]*)" is completed$/' features/secondary/buildhost_docker_build_image.feature:61:in `I wait at most 660 seconds until event "Image Build suse_key scheduled" is completed'

And I wait at most 900 seconds until image "suse_key" with version "latest" is built successfully via API 0s

And I wait at most 300 seconds until image "suse_key" with version "latest" is inspected successfully via API 0s

18s 638ms Show Info +
17:57:19:000 - 17:58:05:000 | Current URL: https://uyuni-master-server.sumaci.aws/rhn/systems/details/history/Event.do?sid=1000010004&aid=309
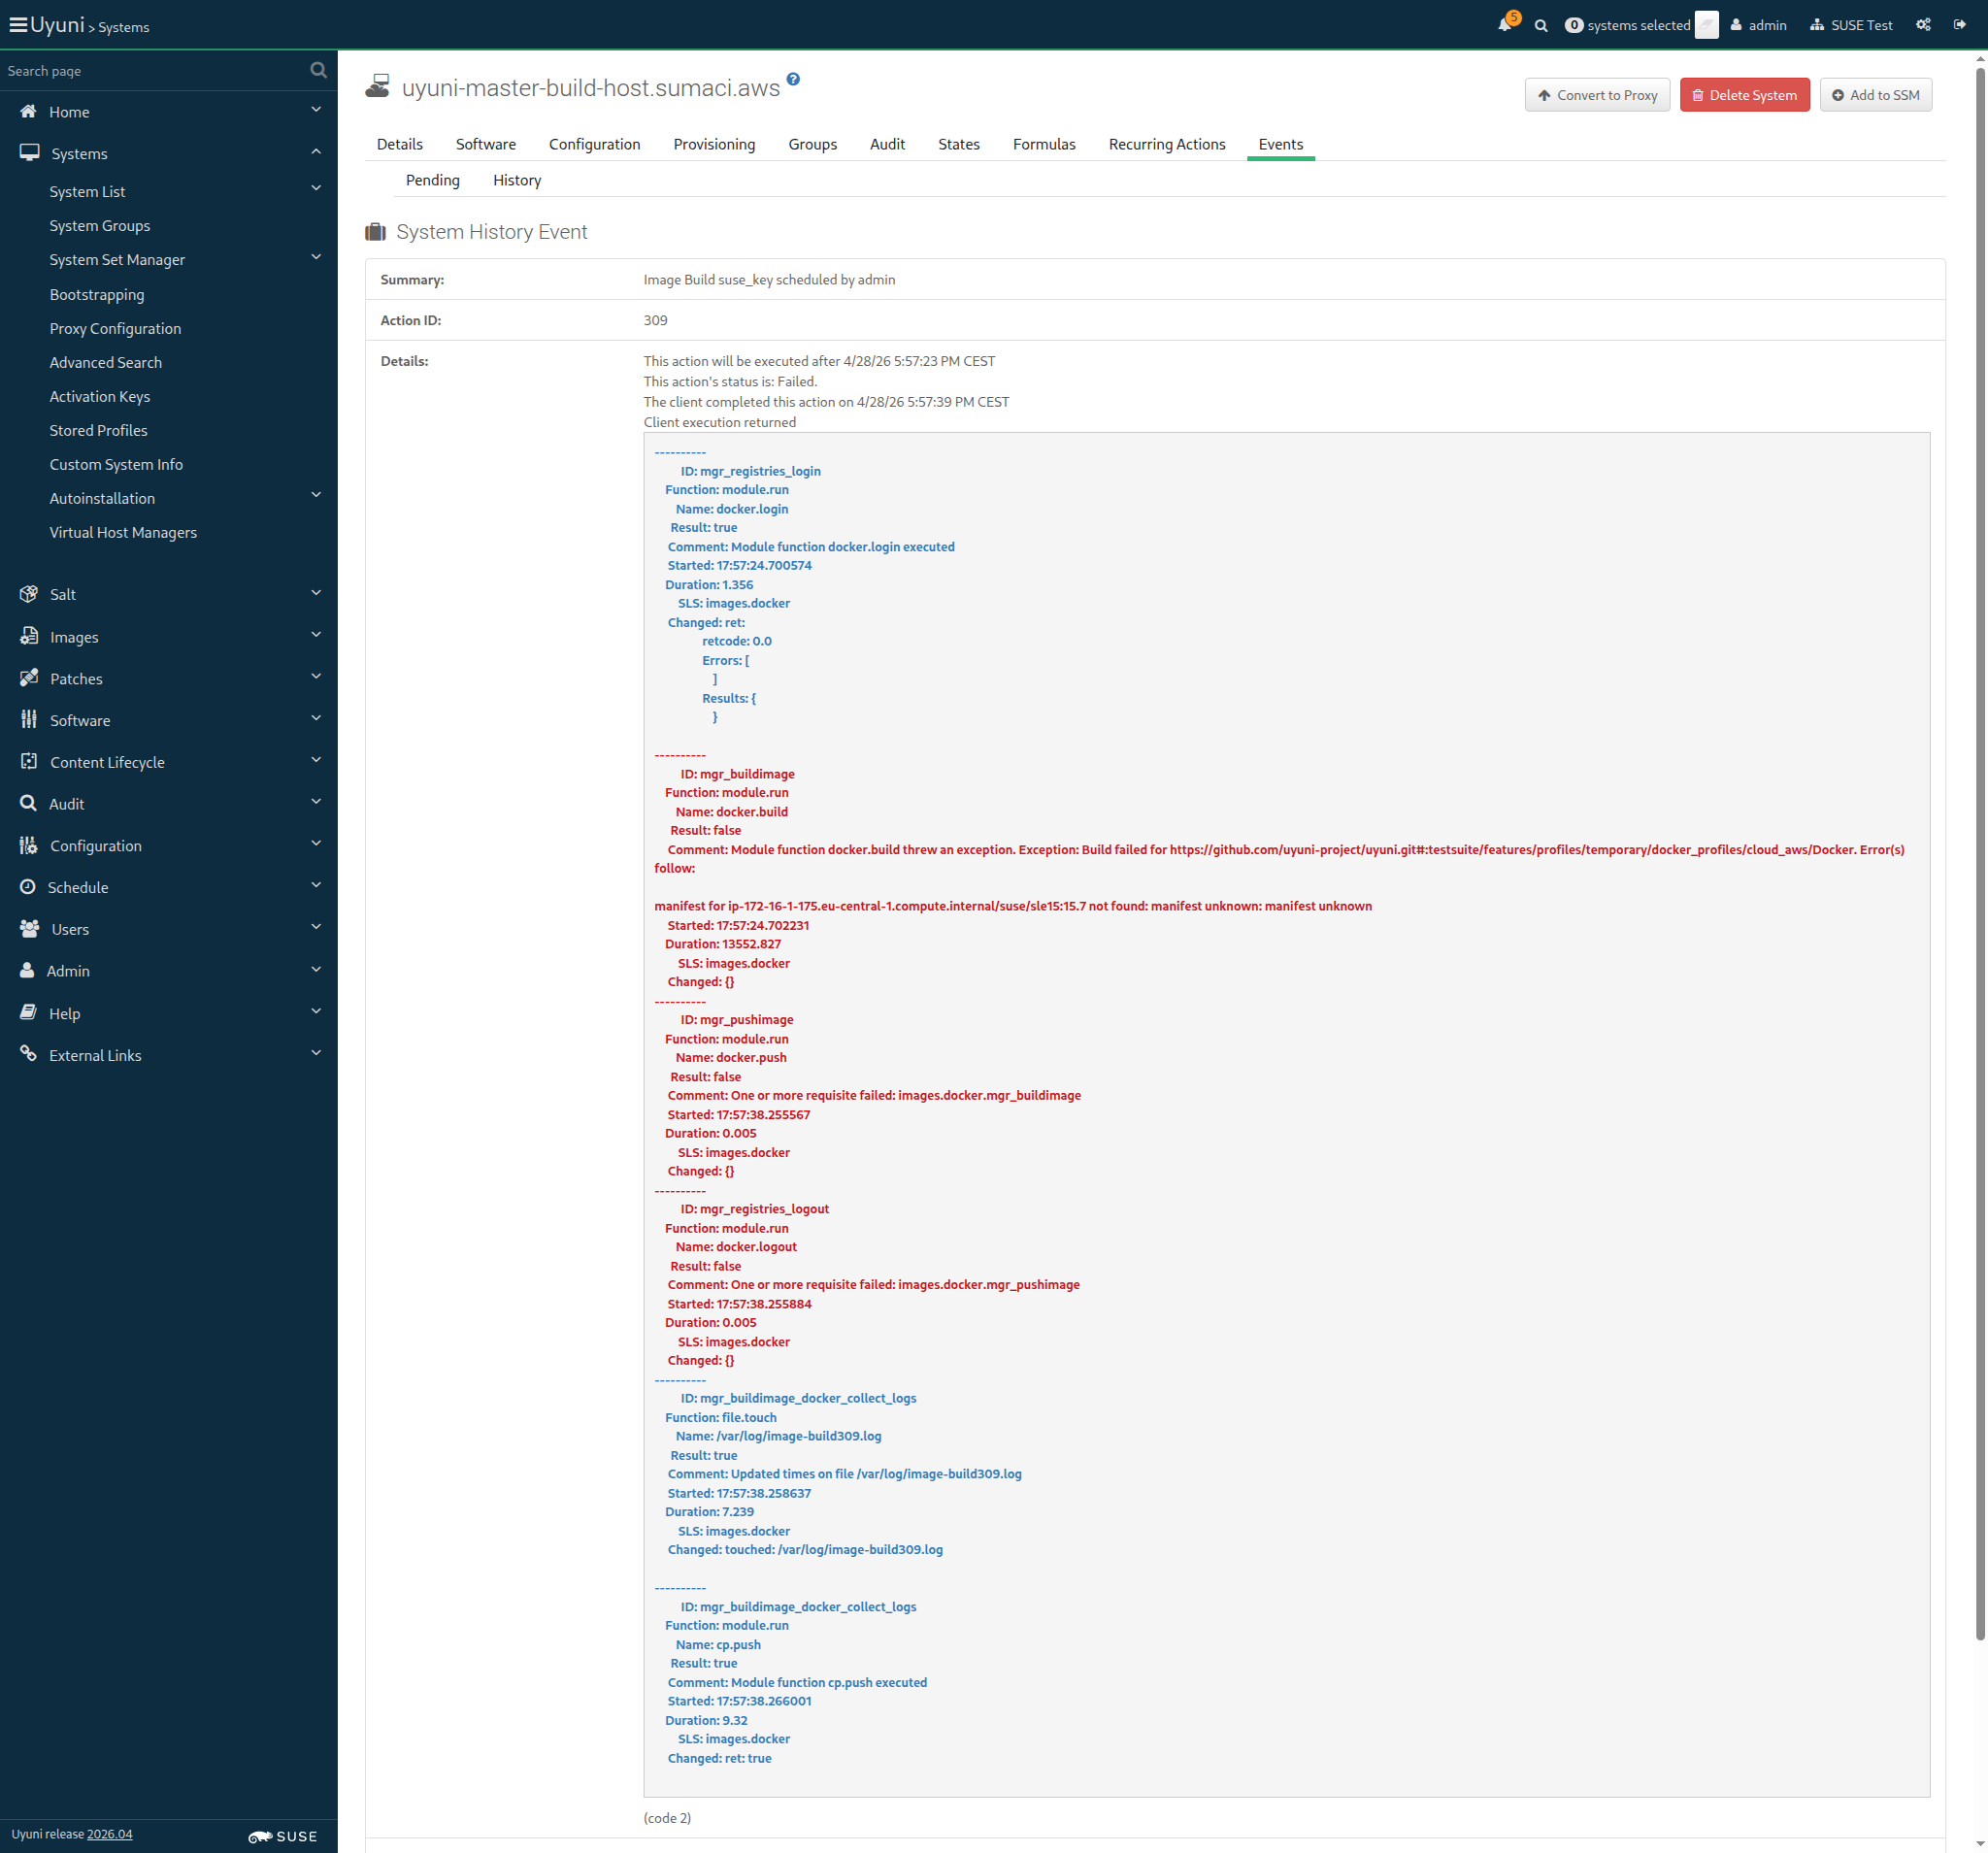
Screenshot +


List of images: [{"external"=>false, "name"=>"suse_key", "checksum"=>"", "obsolete"=>false, "id"=>1, "arch"=>"x86_64-redhat-linux", "type"=>"dockerfile", "version"=>"latest", "storeLabel"=>"galaxy-registry", "revision"=>0}]
Image Details: {"outdatedPackages"=>0, "buildServerId"=>1000010004, "obsolete"=>false, "bugErrata"=>0, "installedPackages"=>0, "type"=>"dockerfile", "version"=>"latest", "storeLabel"=>"galaxy-registry", "revision"=>0, "securityErrata"=>0, "buildStatus"=>"failed", "external"=>false, "profileLabel"=>"suse_key", "name"=>"suse_key", "checksum"=>"", "files"=>[], "id"=>1, "arch"=>"x86_64", "enhancementErrata"=>0}

Then the list of packages of image "suse_key" with version "latest" is not empty 742ms Show Error +
                                            
the list of image packages is empty (ScriptError) ./features/step_definitions/docker_steps.rb:143:in `/^the list of packages of image "([^"]*)" with version "([^"]*)" is not empty$/' features/secondary/buildhost_docker_build_image.feature:69:in `the list of packages of image "suse_key" with version "latest" is not empty'

20s 361ms Show Info +
17:58:23:000 - 17:58:24:000 | Current URL: https://uyuni-master-server.sumaci.aws/rhn/systems/details/history/Event.do?sid=1000010004&aid=309
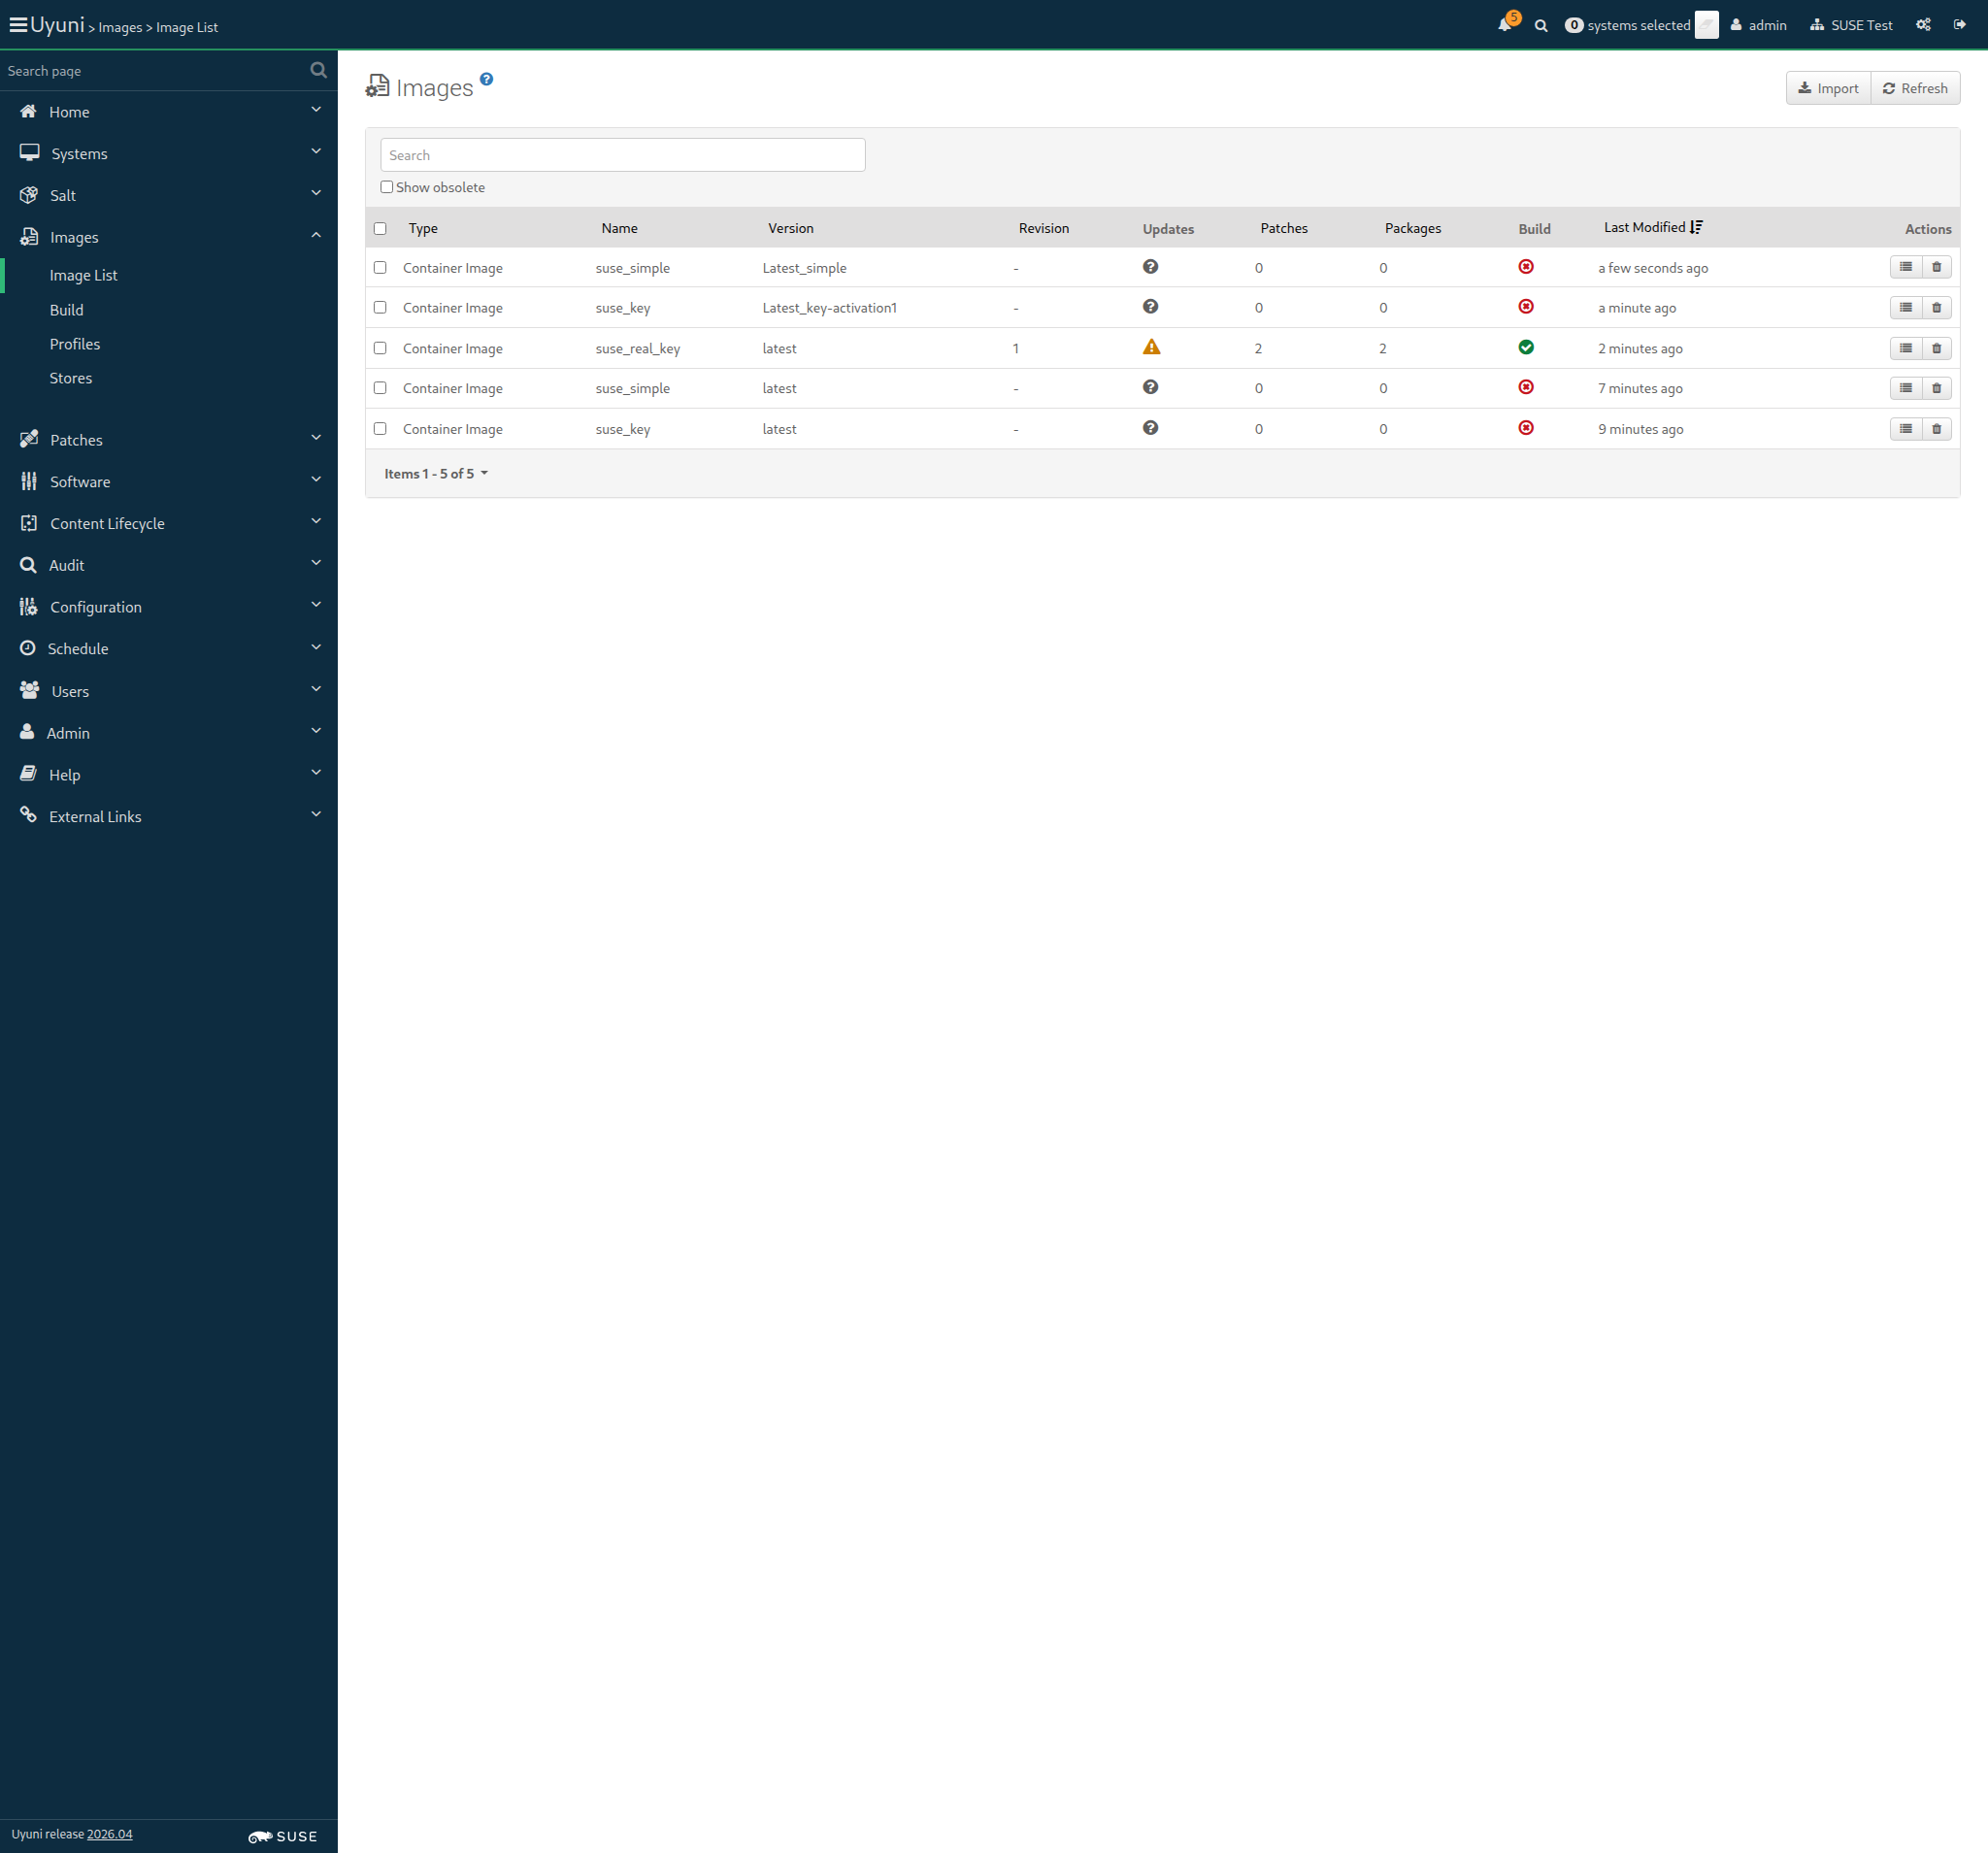
Screenshot +


Event Details: ---------- ID: mgr_registries_login Function: module.run Name: docker.login Result: true Comment: Module function docker.login executed Started: 17:58:48.440158 Duration: 1.543 SLS: images.docker Changed: ret: retcode: 0.0 Errors: [ ] Results: { } ---------- ID: mgr_buildimage Function: module.run Name: docker.build Result: false Comment: Module function docker.build threw an exception. Exception: Build failed for https://github.com/uyuni-project/uyuni.git#:testsuite/features/profiles/temporary/docker_profiles/cloud_aws/Docker. Error(s) follow: manifest for ip-172-16-1-175.eu-central-1.compute.internal/suse/sle15:15.7 not found: manifest unknown: manifest unknown Started: 17:58:48.442068 Duration: 13574.525 SLS: images.docker Changed: {} ---------- ID: mgr_pushimage Function: module.run Name: docker.push Result: false Comment: One or more requisite failed: images.docker.mgr_buildimage Started: 17:59:02.017063 Duration: 0.005 SLS: images.docker Changed: {} ---------- ID: mgr_registries_logout Function: module.run Name: docker.logout Result: false Comment: One or more requisite failed: images.docker.mgr_pushimage Started: 17:59:02.017334 Duration: 0.004 SLS: images.docker Changed: {} ---------- ID: mgr_buildimage_docker_collect_logs Function: file.touch Name: /var/log/image-build310.log Result: true Comment: Updated times on file /var/log/image-build310.log Started: 17:59:02.020543 Duration: 8.305 SLS: images.docker Changed: touched: /var/log/image-build310.log ---------- ID: mgr_buildimage_docker_collect_logs Function: module.run Name: cp.push Result: true Comment: Module function cp.push executed Started: 17:59:02.029143 Duration: 10.038 SLS: images.docker Changed: ret: true

Given I am on the Systems overview page of this "build_host" 1s 292ms

When I schedule the build of image "suse_simple" via API calls 1s 185ms

And I wait at most 660 seconds until event "Image Build suse_simple scheduled" is completed 41s 481ms Show Error +
                                            
unknown error - Event failed (SystemCallError) ./features/step_definitions/navigation_steps.rb:107:in `block (2 levels) in (top (required))' ./features/support/commonlib.rb:100:in `block in repeat_until_timeout' ./features/support/commonlib.rb:89:in `repeat_until_timeout' ./features/step_definitions/navigation_steps.rb:99:in `/^I wait at most (\d+) seconds until the event is completed, refreshing the page$/' ./features/step_definitions/common_steps.rb:157:in `/^I wait (\d+) seconds until the event is picked up and (\d+) seconds until the event "([^"]*)" is completed$/' ./features/step_definitions/common_steps.rb:174:in `/^I wait at most (\d+) seconds until event "([^"]*)" is completed$/' features/secondary/buildhost_docker_build_image.feature:74:in `I wait at most 660 seconds until event "Image Build suse_simple scheduled" is completed'

And I wait at most 900 seconds until image "suse_simple" with version "latest" is built successfully via API 0s

And I wait at most 300 seconds until image "suse_simple" with version "latest" is inspected successfully via API 0s

19s 645ms Show Info +
17:58:44:000 - 17:59:28:000 | Current URL: https://uyuni-master-server.sumaci.aws/rhn/systems/details/history/Event.do?sid=1000010004&aid=310
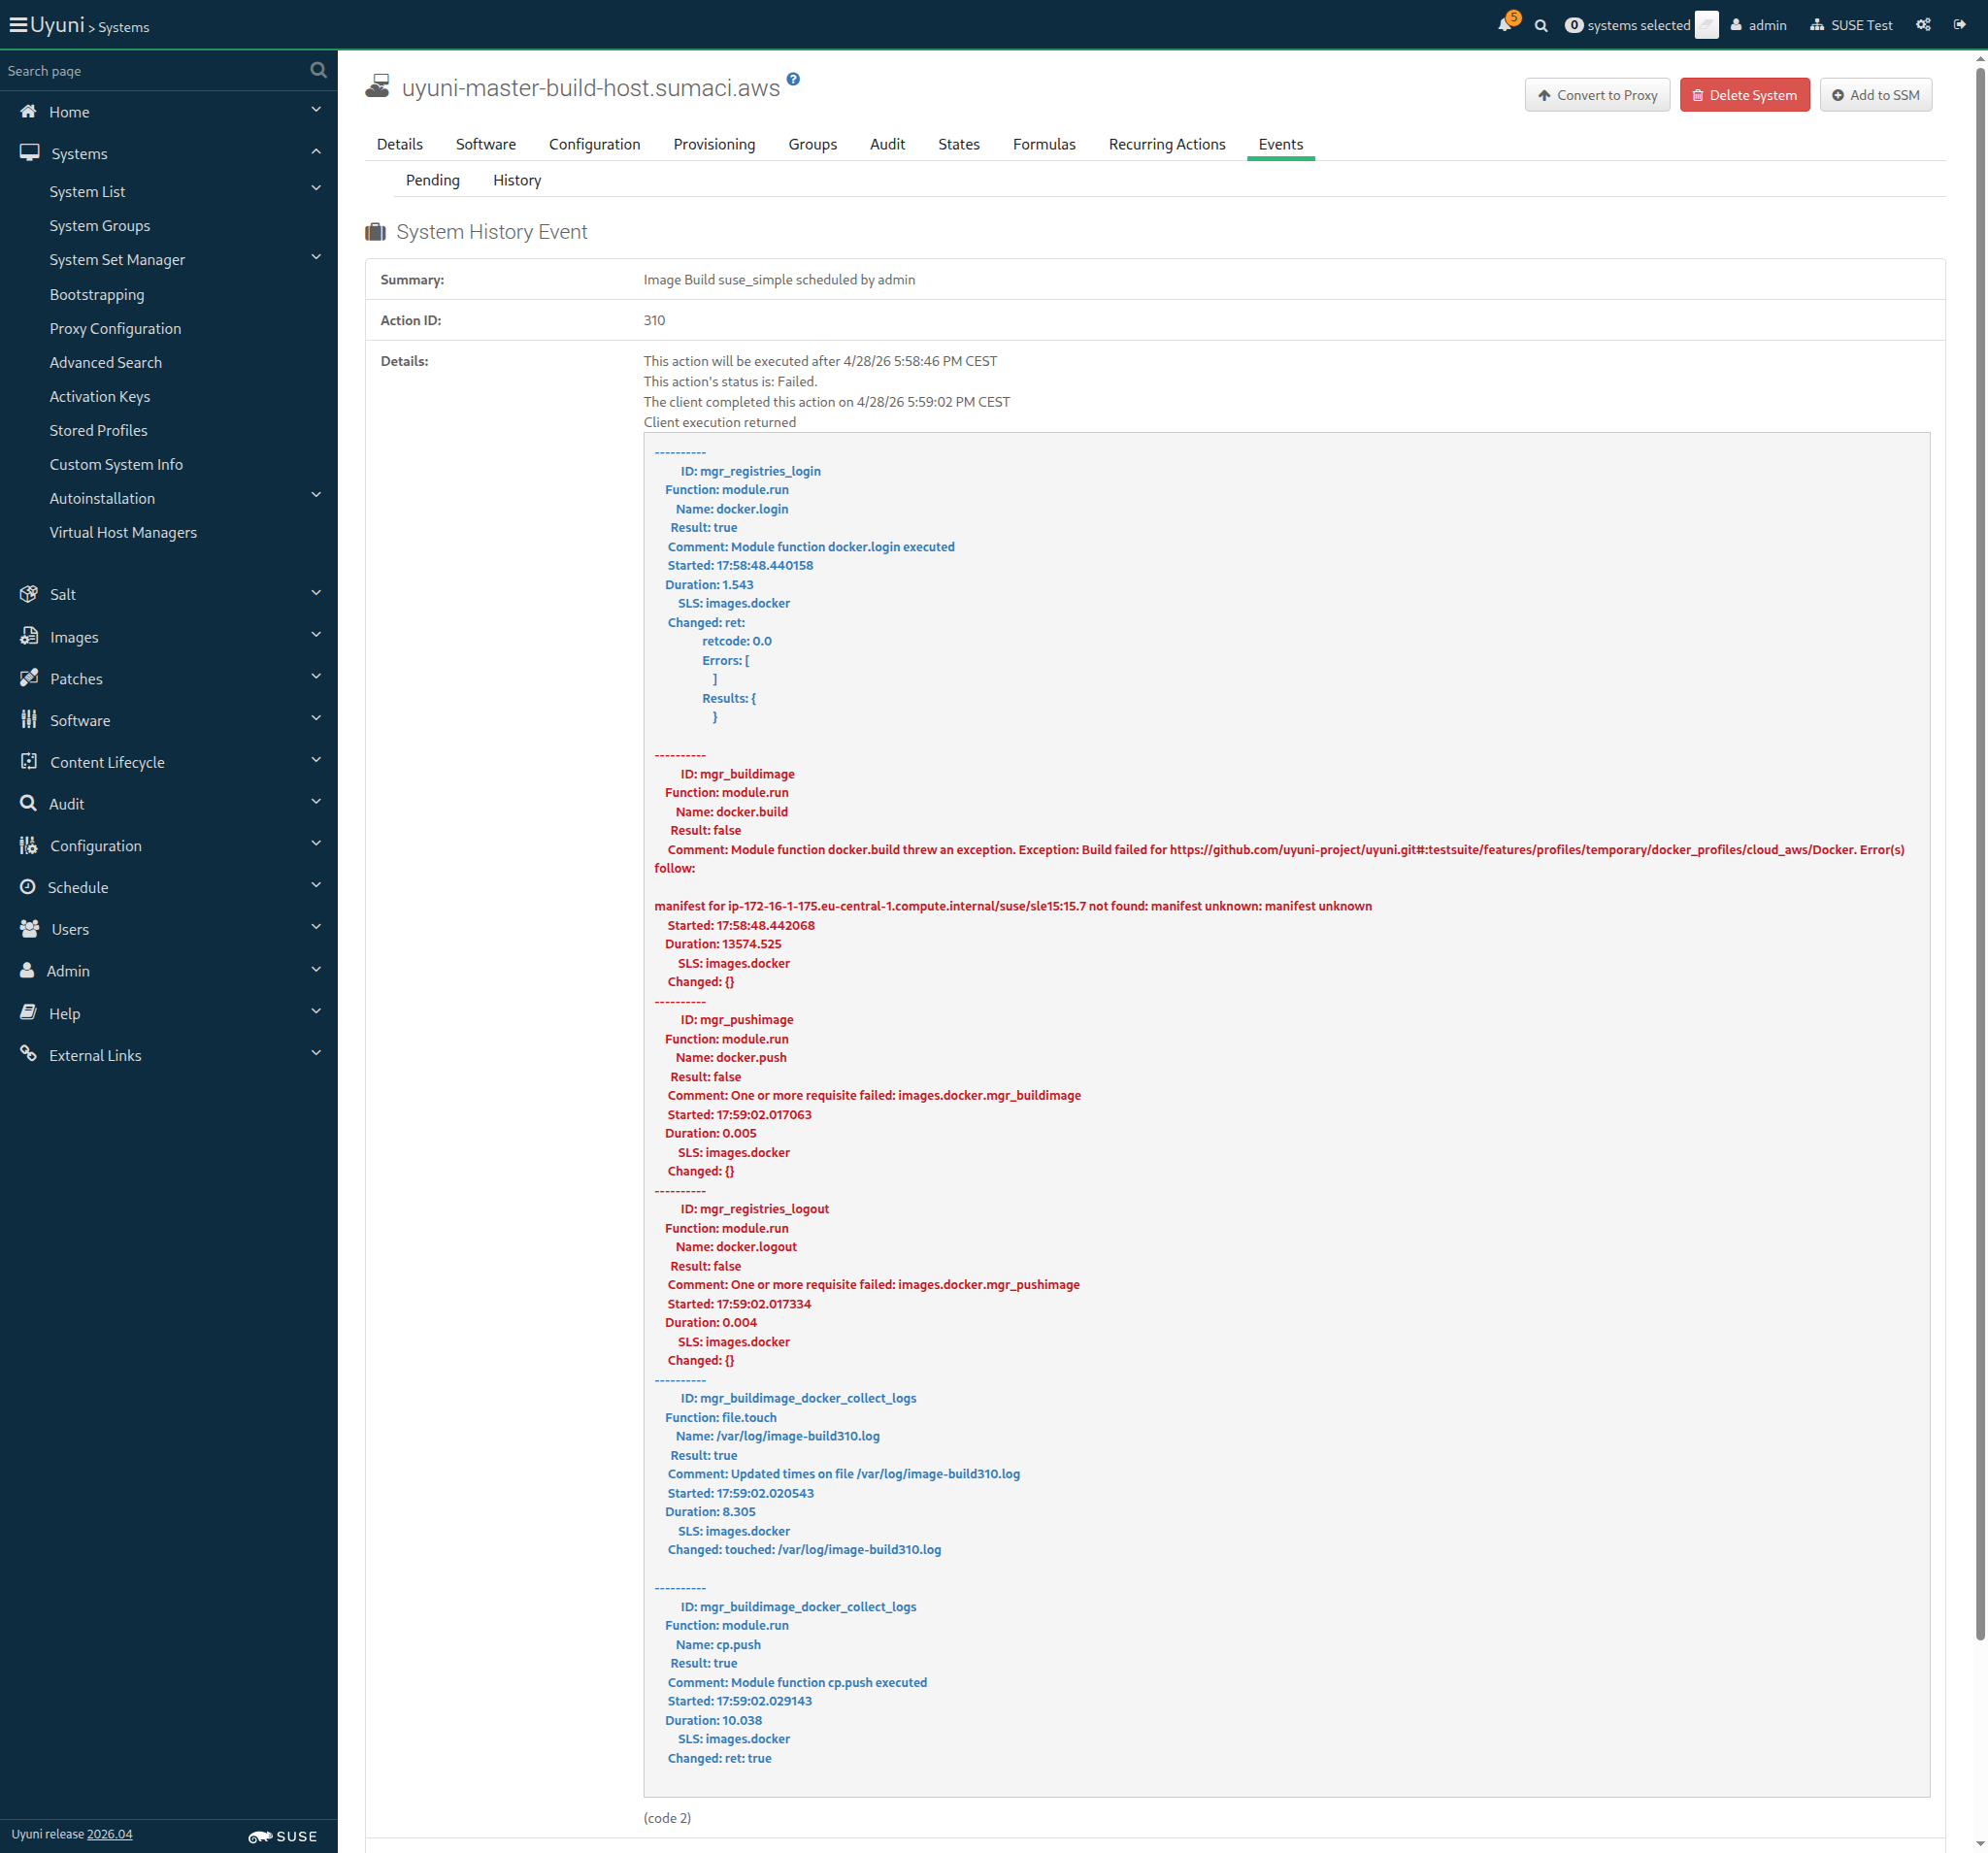
Screenshot +


List of images: [{"external"=>false, "name"=>"suse_key", "checksum"=>"", "obsolete"=>false, "id"=>1, "arch"=>"x86_64-redhat-linux", "type"=>"dockerfile", "version"=>"latest", "storeLabel"=>"galaxy-registry", "revision"=>0}, {"external"=>false, "name"=>"suse_simple", "checksum"=>"", "obsolete"=>false, "id"=>2, "arch"=>"x86_64-redhat-linux", "type"=>"dockerfile", "version"=>"latest", "storeLabel"=>"galaxy-registry", "revision"=>0}]
Image Details: {"outdatedPackages"=>0, "buildServerId"=>1000010004, "obsolete"=>false, "bugErrata"=>0, "installedPackages"=>0, "type"=>"dockerfile", "version"=>"latest", "storeLabel"=>"galaxy-registry", "revision"=>0, "securityErrata"=>0, "buildStatus"=>"failed", "external"=>false, "profileLabel"=>"suse_simple", "name"=>"suse_simple", "checksum"=>"", "files"=>[], "id"=>2, "arch"=>"x86_64", "enhancementErrata"=>0}

Then the list of packages of image "suse_simple" with version "latest" is not empty 766ms Show Error +
                                            
the list of image packages is empty (ScriptError) ./features/step_definitions/docker_steps.rb:143:in `/^the list of packages of image "([^"]*)" with version "([^"]*)" is not empty$/' features/secondary/buildhost_docker_build_image.feature:80:in `the list of packages of image "suse_simple" with version "latest" is not empty'

18s 703ms Show Info +
17:59:48:000 - 17:59:49:000 | Current URL: https://uyuni-master-server.sumaci.aws/rhn/systems/details/history/Event.do?sid=1000010004&aid=310
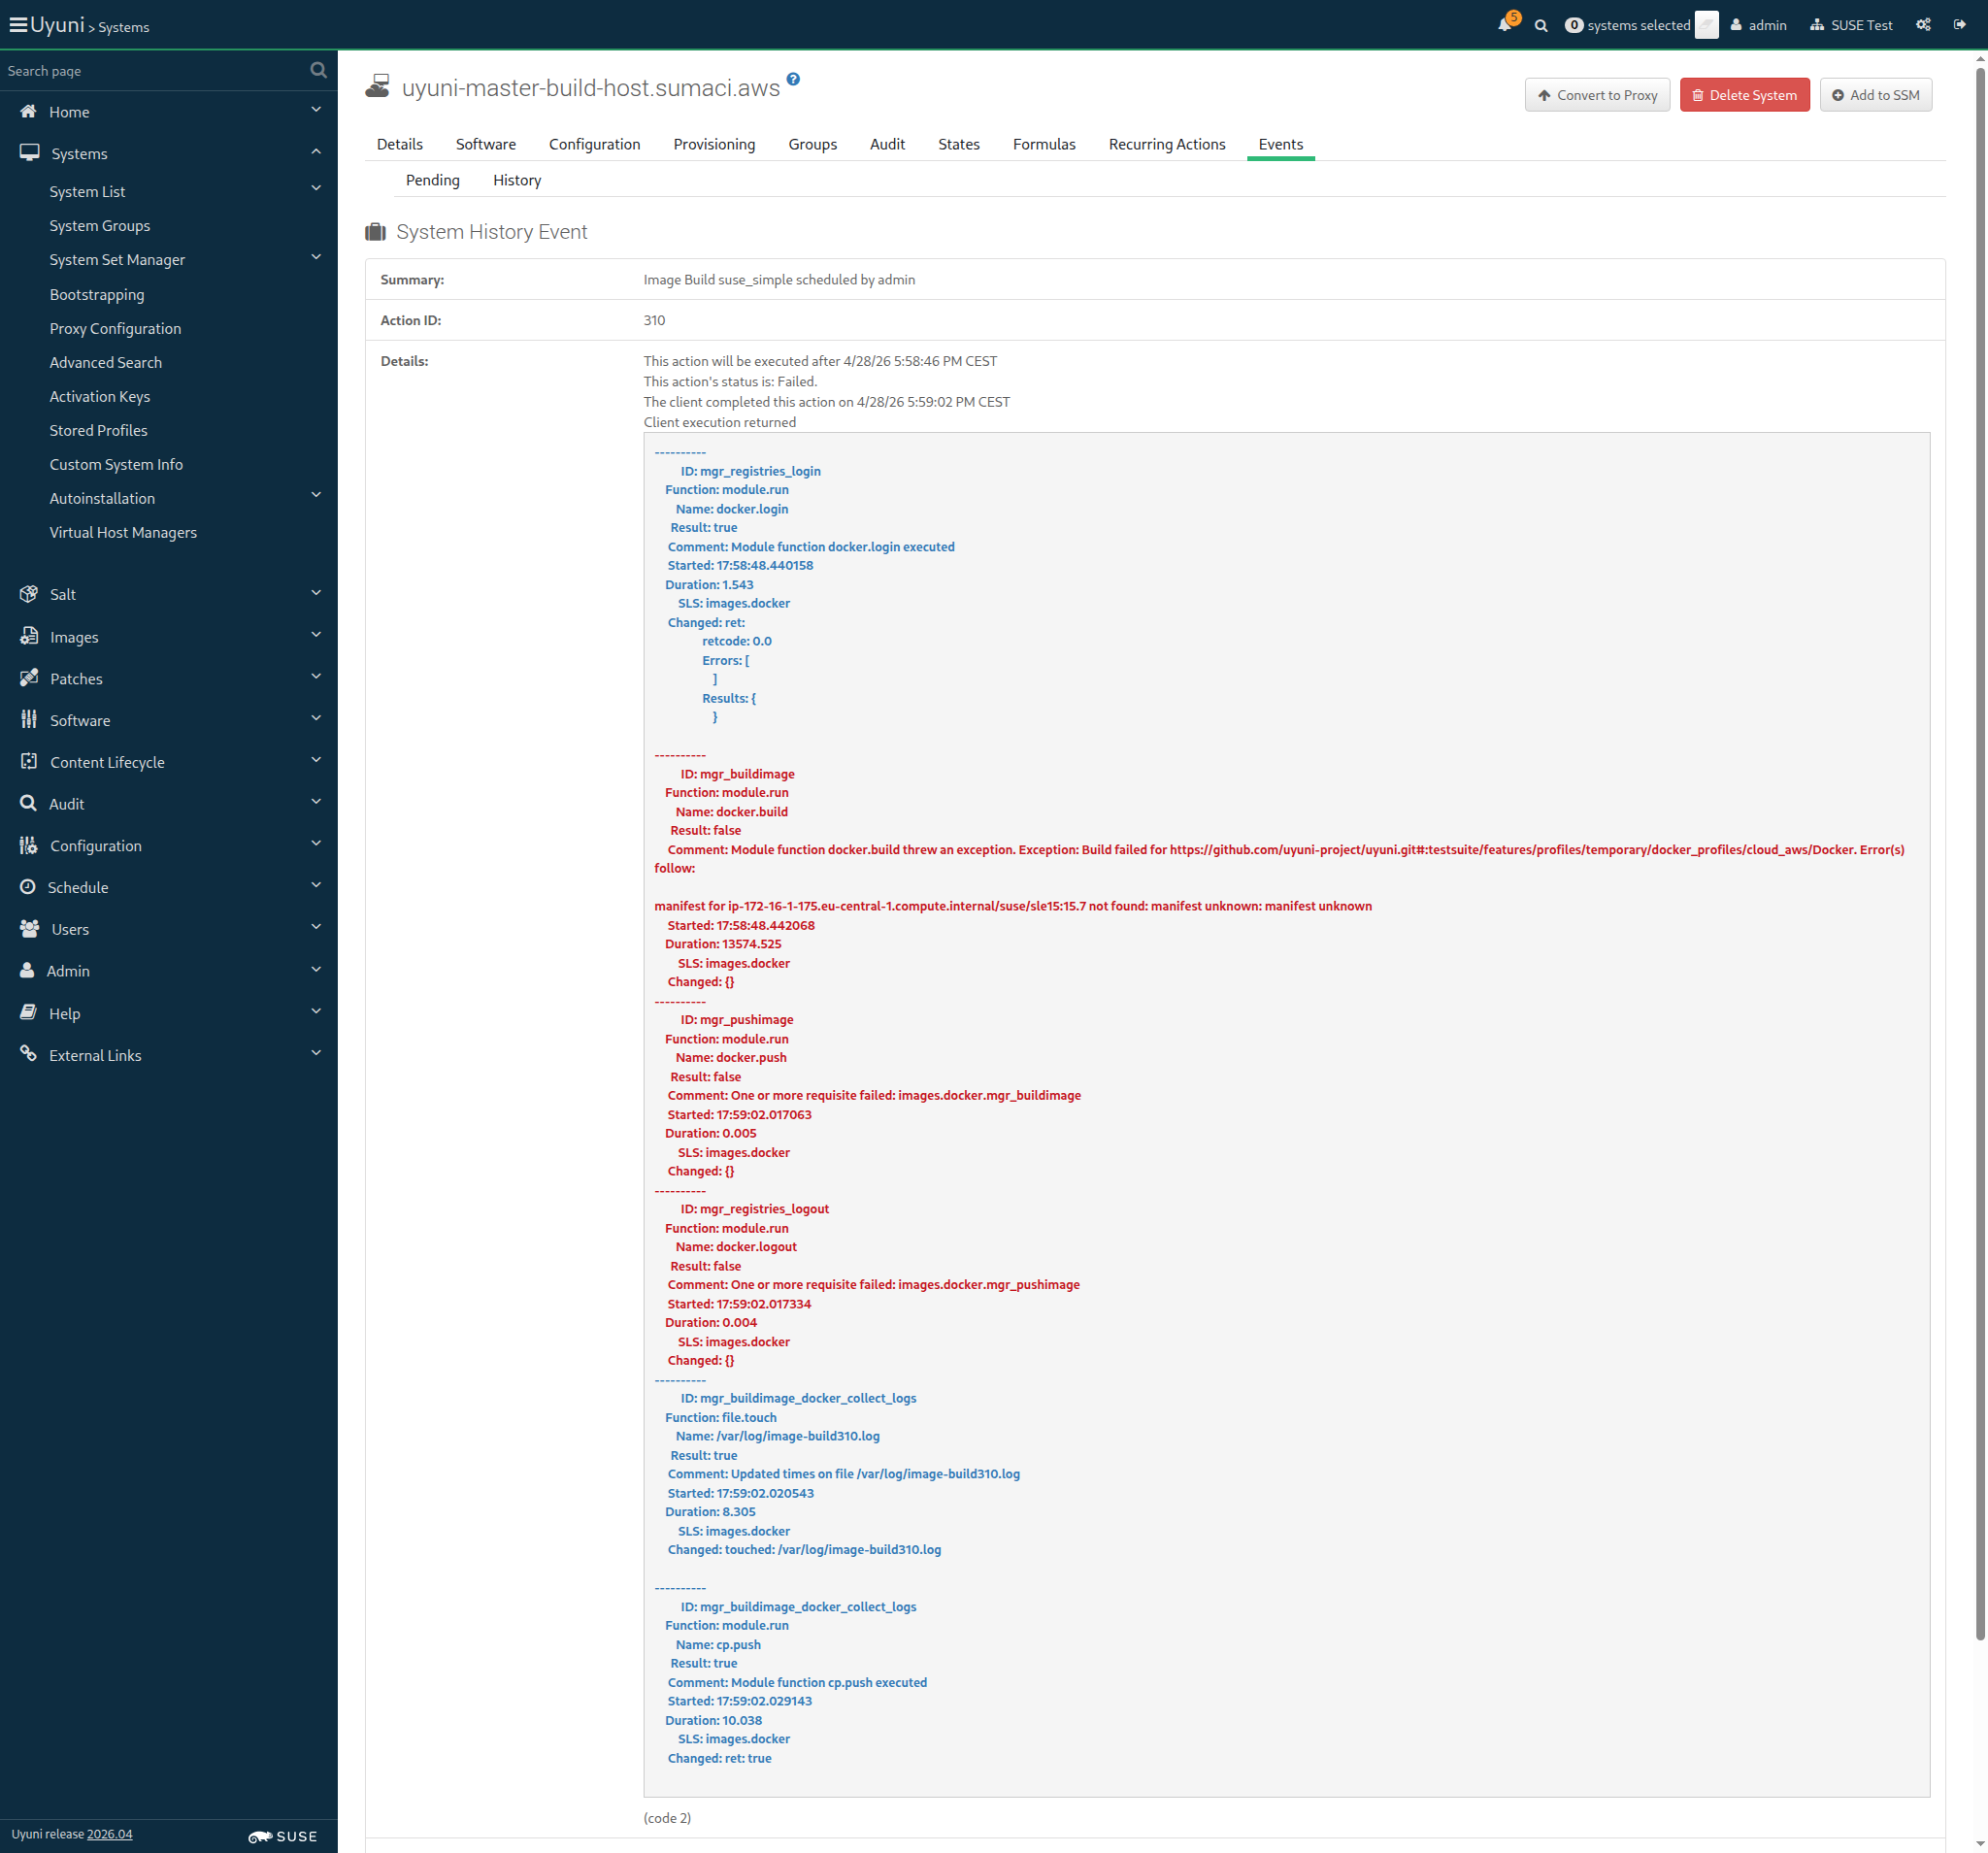
Screenshot +


2026-04-28 18:02:50 +0200 Still waiting for action to complete...

Given I am on the Systems overview page of this "build_host" 1s 110ms

When I schedule the build of image "suse_real_key" via API calls 929ms

And I wait at most 660 seconds until event "Image Build suse_real_key scheduled" is completed 2m 50s 801ms

And I wait at most 60 seconds until all "3" container images are built correctly on the Image List page 1s 535ms Show Error +
                                            
unknown error - error detected while building images (SystemCallError) ./features/step_definitions/docker_steps.rb:90:in `block (2 levels) in (top (required))' ./features/support/commonlib.rb:100:in `block in repeat_until_timeout' ./features/support/commonlib.rb:89:in `repeat_until_timeout' ./features/step_definitions/docker_steps.rb:87:in `/^I wait at most (\d+) seconds until all "([^"]*)" container images are built correctly on the Image List page$/' features/secondary/buildhost_docker_build_image.feature:87:in `I wait at most 60 seconds until all "3" container images are built correctly on the Image List page'

And I wait at most 900 seconds until image "suse_real_key" with version "latest" is built successfully via API 0s

And I wait at most 300 seconds until image "suse_real_key" with version "latest" is inspected successfully via API 0s

When I wait until no Salt job is running on "build_host" 0s

20s 95ms Show Info +
18:00:08:000 - 18:03:02:000 | Current URL: https://uyuni-master-server.sumaci.aws/rhn/manager/cm/images
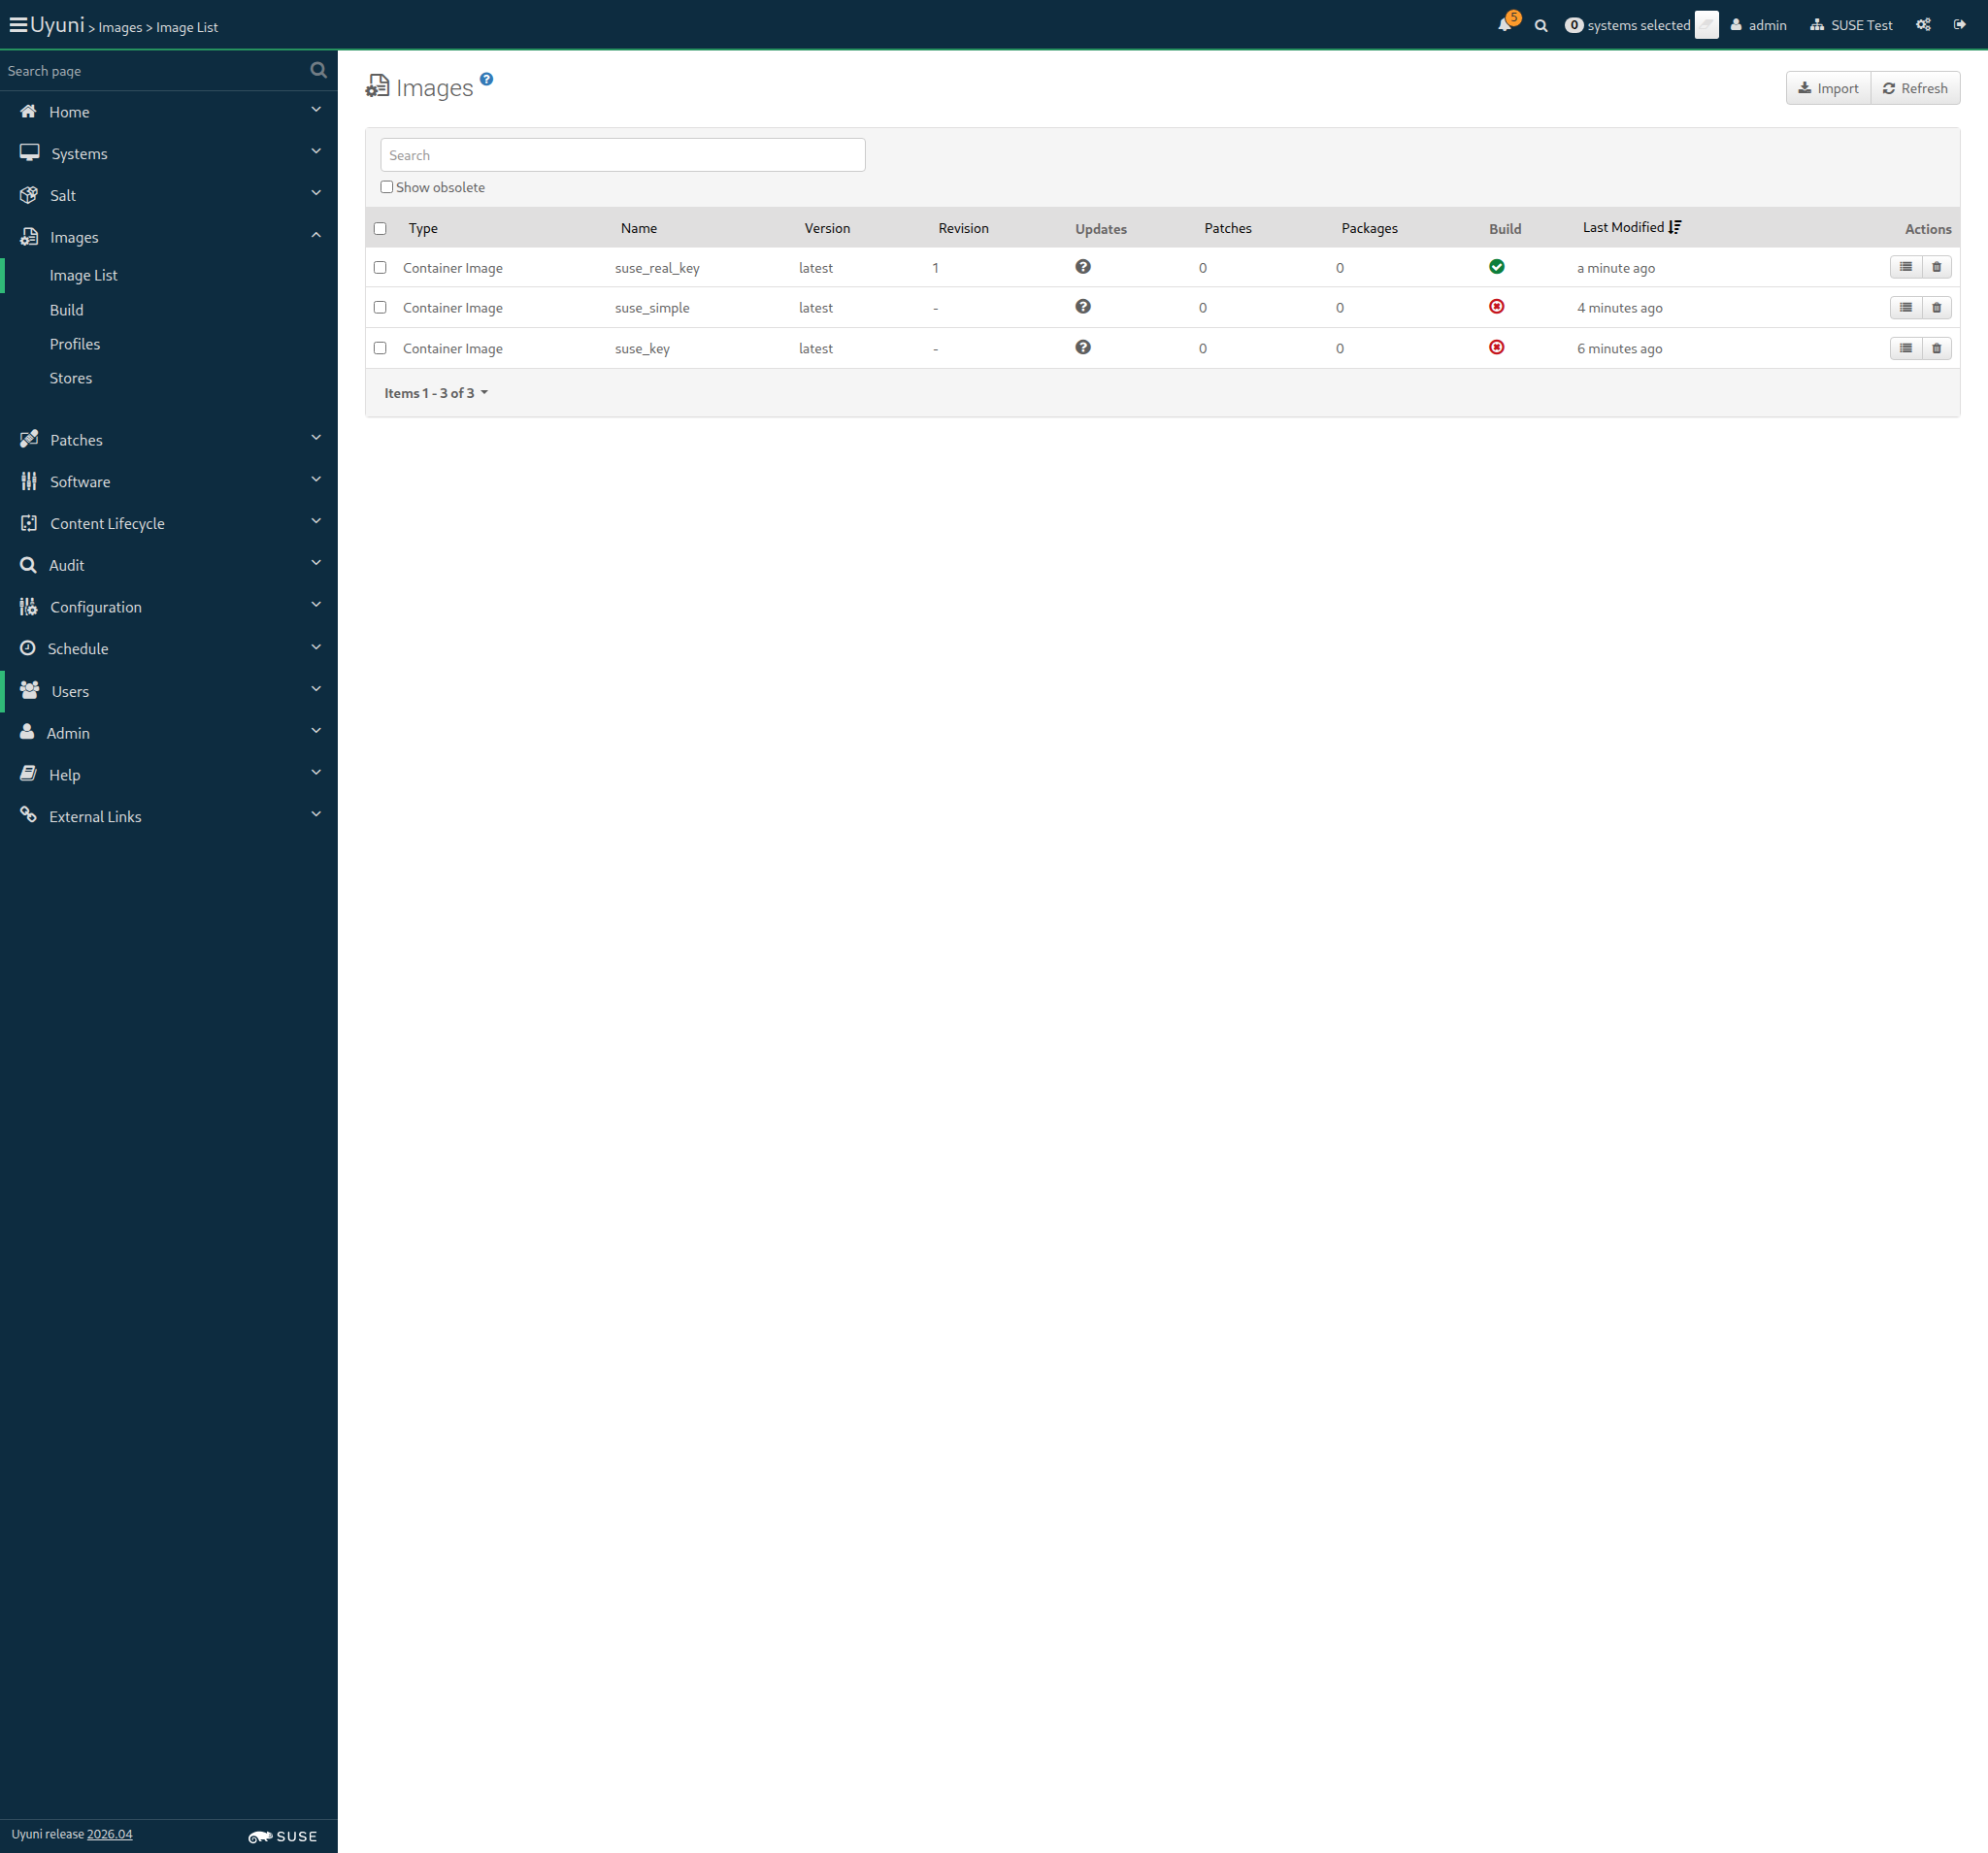
Screenshot +


List of images: [{"external"=>false, "name"=>"suse_key", "checksum"=>"", "obsolete"=>false, "id"=>1, "arch"=>"x86_64-redhat-linux", "type"=>"dockerfile", "version"=>"latest", "storeLabel"=>"galaxy-registry", "revision"=>0}, {"external"=>false, "name"=>"suse_simple", "checksum"=>"", "obsolete"=>false, "id"=>2, "arch"=>"x86_64-redhat-linux", "type"=>"dockerfile", "version"=>"latest", "storeLabel"=>"galaxy-registry", "revision"=>0}, {"external"=>false, "name"=>"suse_real_key", "checksum"=>"", "obsolete"=>false, "id"=>3, "arch"=>"x86_64-redhat-linux", "type"=>"dockerfile", "version"=>"latest", "storeLabel"=>"galaxy-registry", "revision"=>1}]
Image Details: {"outdatedPackages"=>0, "buildServerId"=>1000010004, "obsolete"=>false, "bugErrata"=>0, "installedPackages"=>0, "type"=>"dockerfile", "inspectStatus"=>"picked up", "version"=>"latest", "storeLabel"=>"galaxy-registry", "revision"=>1, "securityErrata"=>0, "buildStatus"=>"completed", "external"=>false, "profileLabel"=>"suse_real_key", "name"=>"suse_real_key", "checksum"=>"", "files"=>[], "id"=>3, "arch"=>"x86_64", "enhancementErrata"=>0}

Then the list of packages of image "suse_real_key" with version "latest" is not empty 702ms Show Error +
                                            
the list of image packages is empty (ScriptError) ./features/step_definitions/docker_steps.rb:143:in `/^the list of packages of image "([^"]*)" with version "([^"]*)" is not empty$/' features/secondary/buildhost_docker_build_image.feature:94:in `the list of packages of image "suse_real_key" with version "latest" is not empty'

18s 845ms Show Info +
18:03:22:000 - 18:03:23:000 | Current URL: https://uyuni-master-server.sumaci.aws/rhn/manager/cm/images
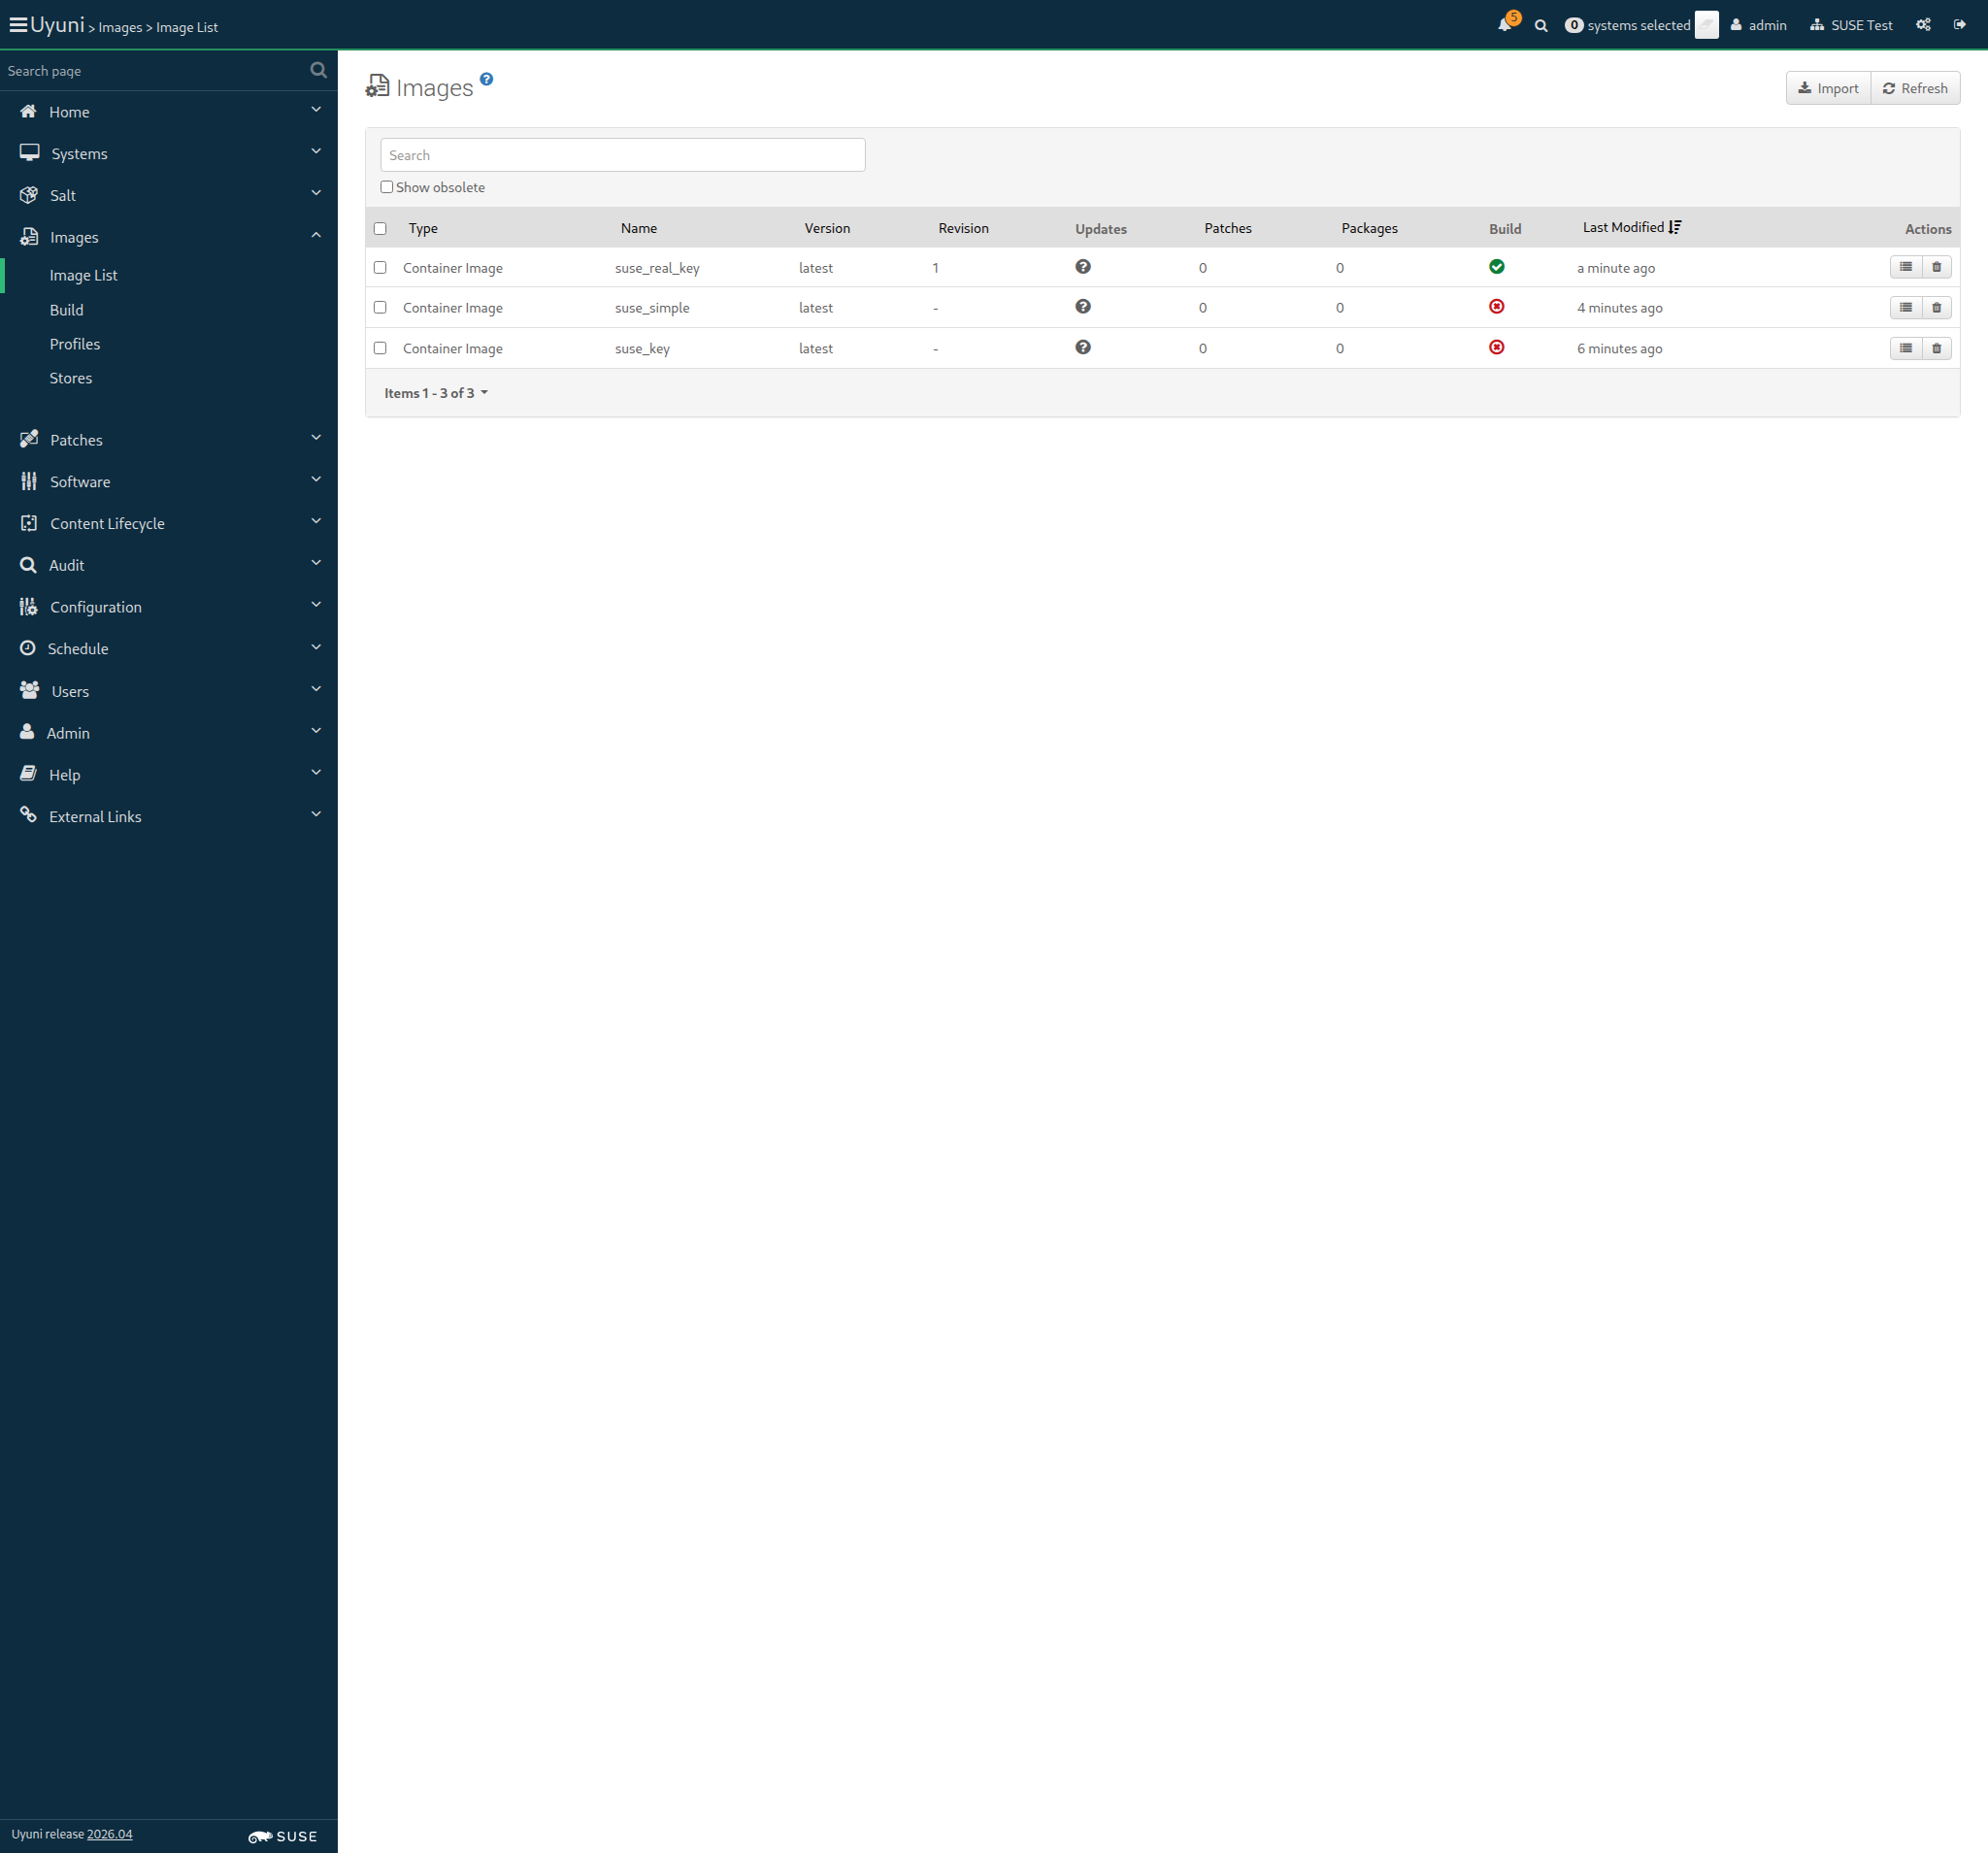
Screenshot +


List of images: [{"external"=>false, "name"=>"suse_key", "checksum"=>"", "obsolete"=>false, "id"=>1, "arch"=>"x86_64-redhat-linux", "type"=>"dockerfile", "version"=>"latest", "storeLabel"=>"galaxy-registry", "revision"=>0}, {"external"=>false, "name"=>"suse_simple", "checksum"=>"", "obsolete"=>false, "id"=>2, "arch"=>"x86_64-redhat-linux", "type"=>"dockerfile", "version"=>"latest", "storeLabel"=>"galaxy-registry", "revision"=>0}, {"external"=>false, "name"=>"suse_real_key", "checksum"=>"", "obsolete"=>false, "id"=>3, "arch"=>"x86_64-redhat-linux", "type"=>"dockerfile", "version"=>"latest", "storeLabel"=>"galaxy-registry", "revision"=>1}, {"external"=>false, "name"=>"suse_key", "checksum"=>"", "obsolete"=>false, "id"=>4, "arch"=>"x86_64-redhat-linux", "type"=>"dockerfile", "version"=>"Latest_key-activation1", "storeLabel"=>"galaxy-registry", "revision"=>0}]
Image Details: {"outdatedPackages"=>0, "buildServerId"=>1000010004, "obsolete"=>false, "bugErrata"=>0, "installedPackages"=>0, "type"=>"dockerfile", "version"=>"Latest_key-activation1", "storeLabel"=>"galaxy-registry", "revision"=>0, "securityErrata"=>0, "buildStatus"=>"picked up", "external"=>false, "profileLabel"=>"suse_key", "name"=>"suse_key", "checksum"=>"", "files"=>[], "id"=>4, "arch"=>"x86_64", "enhancementErrata"=>0}
Image Details: {"outdatedPackages"=>0, "buildServerId"=>1000010004, "obsolete"=>false, "bugErrata"=>0, "installedPackages"=>0, "type"=>"dockerfile", "version"=>"Latest_key-activation1", "storeLabel"=>"galaxy-registry", "revision"=>0, "securityErrata"=>0, "buildStatus"=>"failed", "external"=>false, "profileLabel"=>"suse_key", "name"=>"suse_key", "checksum"=>"", "files"=>[], "id"=>4, "arch"=>"x86_64", "enhancementErrata"=>0}

When I schedule the build of image "suse_key" with version "Latest_key-activation1" via API calls 1s 906ms

And I wait at most 900 seconds until image "suse_key" with version "Latest_key-activation1" is built successfully via API 1m 26s 783ms Show Error +
                                            
unknown error - image build failed. (SystemCallError) ./features/step_definitions/docker_steps.rb:55:in `block (2 levels) in (top (required))' ./features/support/commonlib.rb:100:in `block in repeat_until_timeout' ./features/support/commonlib.rb:89:in `repeat_until_timeout' ./features/step_definitions/docker_steps.rb:41:in `/^I wait at most (\d+) seconds until image "([^"]*)" with version "([^"]*)" is built successfully via API$/' features/secondary/buildhost_docker_build_image.feature:99:in `I wait at most 900 seconds until image "suse_key" with version "Latest_key-activation1" is built successfully via API'

And I wait at most 300 seconds until image "suse_key" with version "Latest_key-activation1" is inspected successfully via API 0s

When I wait until no Salt job is running on "build_host" 0s

20s 869ms Show Info +
18:03:42:000 - 18:05:10:000 | Current URL: https://uyuni-master-server.sumaci.aws/rhn/manager/cm/images
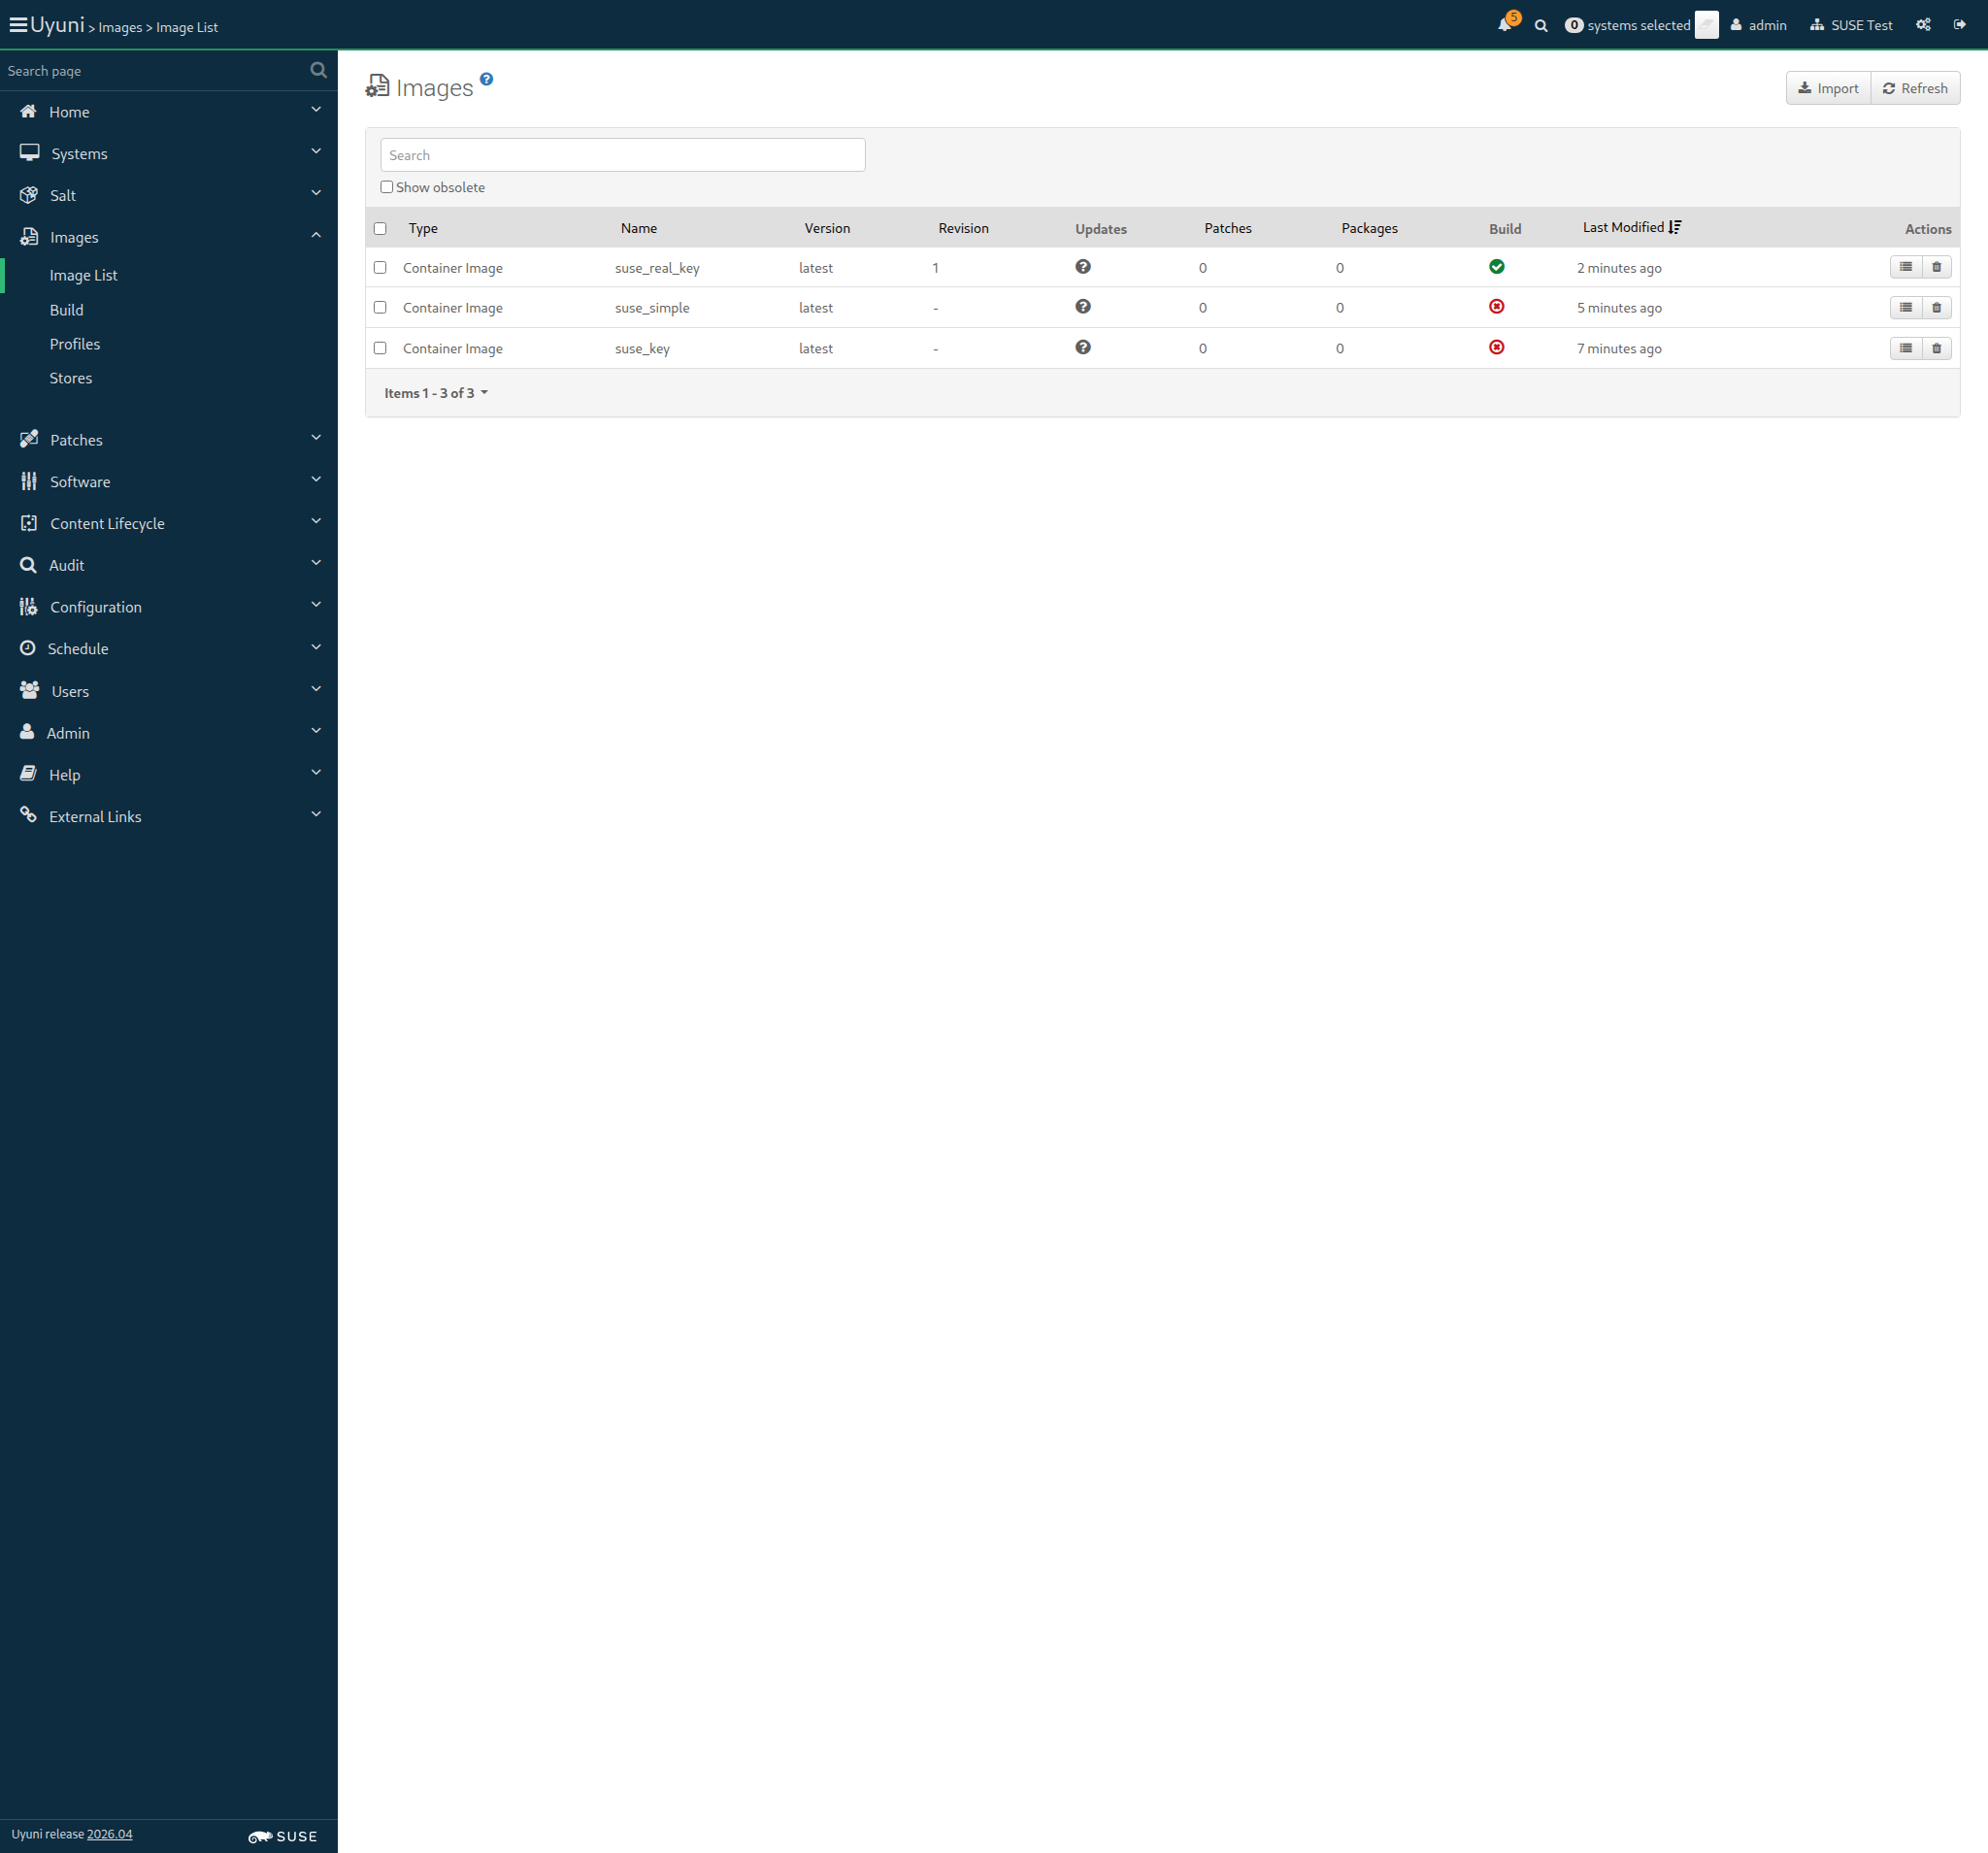
Screenshot +


List of images: [{"external"=>false, "name"=>"suse_key", "checksum"=>"", "obsolete"=>false, "id"=>1, "arch"=>"x86_64-redhat-linux", "type"=>"dockerfile", "version"=>"latest", "storeLabel"=>"galaxy-registry", "revision"=>0}, {"external"=>false, "name"=>"suse_simple", "checksum"=>"", "obsolete"=>false, "id"=>2, "arch"=>"x86_64-redhat-linux", "type"=>"dockerfile", "version"=>"latest", "storeLabel"=>"galaxy-registry", "revision"=>0}, {"external"=>false, "name"=>"suse_real_key", "checksum"=>"ab6e2a89fa18f8238659c9ae840d0eab861c13712f63e2bc38405d7ebf27e217", "obsolete"=>false, "id"=>3, "arch"=>"x86_64-redhat-linux", "type"=>"dockerfile", "version"=>"latest", "storeLabel"=>"galaxy-registry", "revision"=>1}, {"external"=>false, "name"=>"suse_key", "checksum"=>"", "obsolete"=>false, "id"=>4, "arch"=>"x86_64-redhat-linux", "type"=>"dockerfile", "version"=>"Latest_key-activation1", "storeLabel"=>"galaxy-registry", "revision"=>0}]
Image Details: {"outdatedPackages"=>0, "buildServerId"=>1000010004, "obsolete"=>false, "bugErrata"=>0, "installedPackages"=>0, "type"=>"dockerfile", "version"=>"Latest_key-activation1", "storeLabel"=>"galaxy-registry", "revision"=>0, "securityErrata"=>0, "buildStatus"=>"failed", "external"=>false, "profileLabel"=>"suse_key", "name"=>"suse_key", "checksum"=>"", "files"=>[], "id"=>4, "arch"=>"x86_64", "enhancementErrata"=>0}

Then the list of packages of image "suse_key" with version "Latest_key-activation1" is not empty 731ms Show Error +
                                            
the list of image packages is empty (ScriptError) ./features/step_definitions/docker_steps.rb:143:in `/^the list of packages of image "([^"]*)" with version "([^"]*)" is not empty$/' features/secondary/buildhost_docker_build_image.feature:105:in `the list of packages of image "suse_key" with version "Latest_key-activation1" is not empty'

18s 979ms Show Info +
18:05:31:000 - 18:05:32:000 | Current URL: https://uyuni-master-server.sumaci.aws/rhn/manager/cm/images
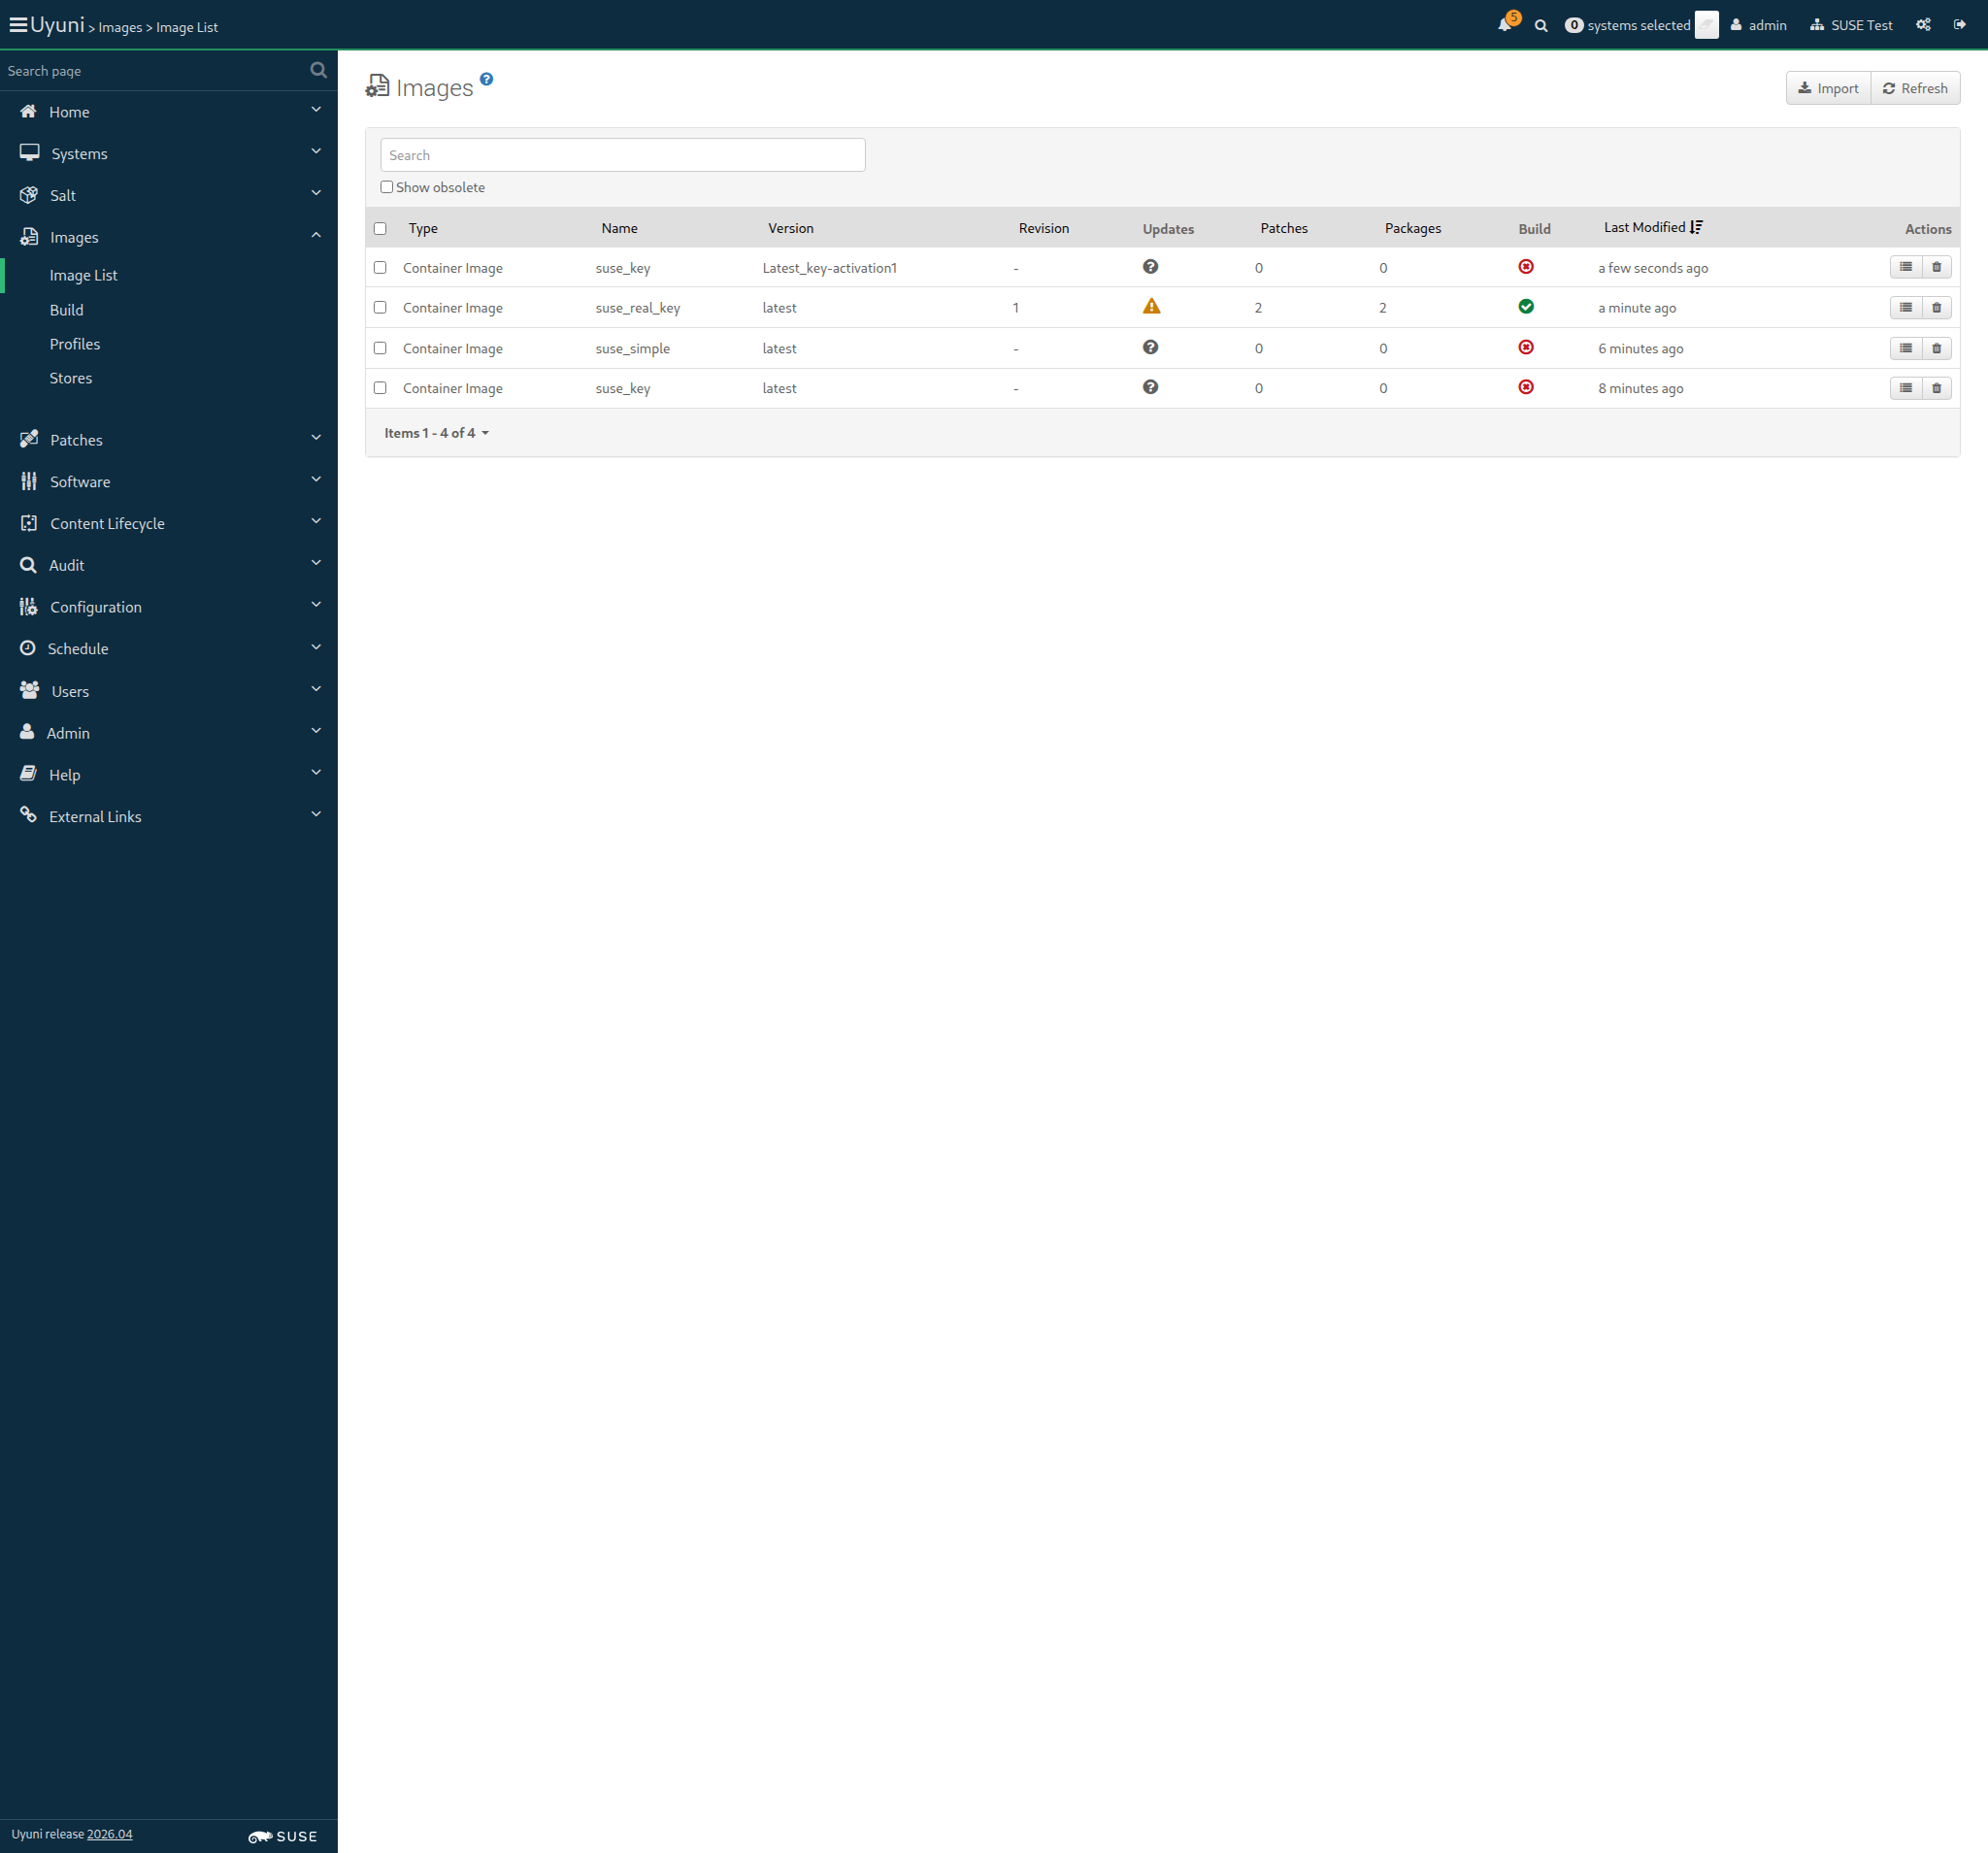
Screenshot +


List of images: [{"external"=>false, "name"=>"suse_key", "checksum"=>"", "obsolete"=>false, "id"=>1, "arch"=>"x86_64-redhat-linux", "type"=>"dockerfile", "version"=>"latest", "storeLabel"=>"galaxy-registry", "revision"=>0}, {"external"=>false, "name"=>"suse_simple", "checksum"=>"", "obsolete"=>false, "id"=>2, "arch"=>"x86_64-redhat-linux", "type"=>"dockerfile", "version"=>"latest", "storeLabel"=>"galaxy-registry", "revision"=>0}, {"external"=>false, "name"=>"suse_real_key", "checksum"=>"ab6e2a89fa18f8238659c9ae840d0eab861c13712f63e2bc38405d7ebf27e217", "obsolete"=>false, "id"=>3, "arch"=>"x86_64-redhat-linux", "type"=>"dockerfile", "version"=>"latest", "storeLabel"=>"galaxy-registry", "revision"=>1}, {"external"=>false, "name"=>"suse_key", "checksum"=>"", "obsolete"=>false, "id"=>4, "arch"=>"x86_64-redhat-linux", "type"=>"dockerfile", "version"=>"Latest_key-activation1", "storeLabel"=>"galaxy-registry", "revision"=>0}, {"external"=>false, "name"=>"suse_simple", "checksum"=>"", "obsolete"=>false, "id"=>5, "arch"=>"x86_64-redhat-linux", "type"=>"dockerfile", "version"=>"Latest_simple", "storeLabel"=>"galaxy-registry", "revision"=>0}]
Image Details: {"outdatedPackages"=>0, "buildServerId"=>1000010004, "obsolete"=>false, "bugErrata"=>0, "installedPackages"=>0, "type"=>"dockerfile", "version"=>"Latest_simple", "storeLabel"=>"galaxy-registry", "revision"=>0, "securityErrata"=>0, "buildStatus"=>"picked up", "external"=>false, "profileLabel"=>"suse_simple", "name"=>"suse_simple", "checksum"=>"", "files"=>[], "id"=>5, "arch"=>"x86_64", "enhancementErrata"=>0}
Image Details: {"outdatedPackages"=>0, "buildServerId"=>1000010004, "obsolete"=>false, "bugErrata"=>0, "installedPackages"=>0, "type"=>"dockerfile", "version"=>"Latest_simple", "storeLabel"=>"galaxy-registry", "revision"=>0, "securityErrata"=>0, "buildStatus"=>"failed", "external"=>false, "profileLabel"=>"suse_simple", "name"=>"suse_simple", "checksum"=>"", "files"=>[], "id"=>5, "arch"=>"x86_64", "enhancementErrata"=>0}

When I schedule the build of image "suse_simple" with version "Latest_simple" via API calls 843ms

And I wait at most 900 seconds until image "suse_simple" with version "Latest_simple" is built successfully via API 22s 81ms Show Error +
                                            
unknown error - image build failed. (SystemCallError) ./features/step_definitions/docker_steps.rb:55:in `block (2 levels) in (top (required))' ./features/support/commonlib.rb:100:in `block in repeat_until_timeout' ./features/support/commonlib.rb:89:in `repeat_until_timeout' ./features/step_definitions/docker_steps.rb:41:in `/^I wait at most (\d+) seconds until image "([^"]*)" with version "([^"]*)" is built successfully via API$/' features/secondary/buildhost_docker_build_image.feature:109:in `I wait at most 900 seconds until image "suse_simple" with version "Latest_simple" is built successfully via API'

And I wait at most 300 seconds until image "suse_simple" with version "Latest_simple" is inspected successfully via API 0s

When I wait until no Salt job is running on "build_host" 0s

20s 280ms Show Info +
18:05:51:000 - 18:06:14:000 | Current URL: https://uyuni-master-server.sumaci.aws/rhn/manager/cm/images
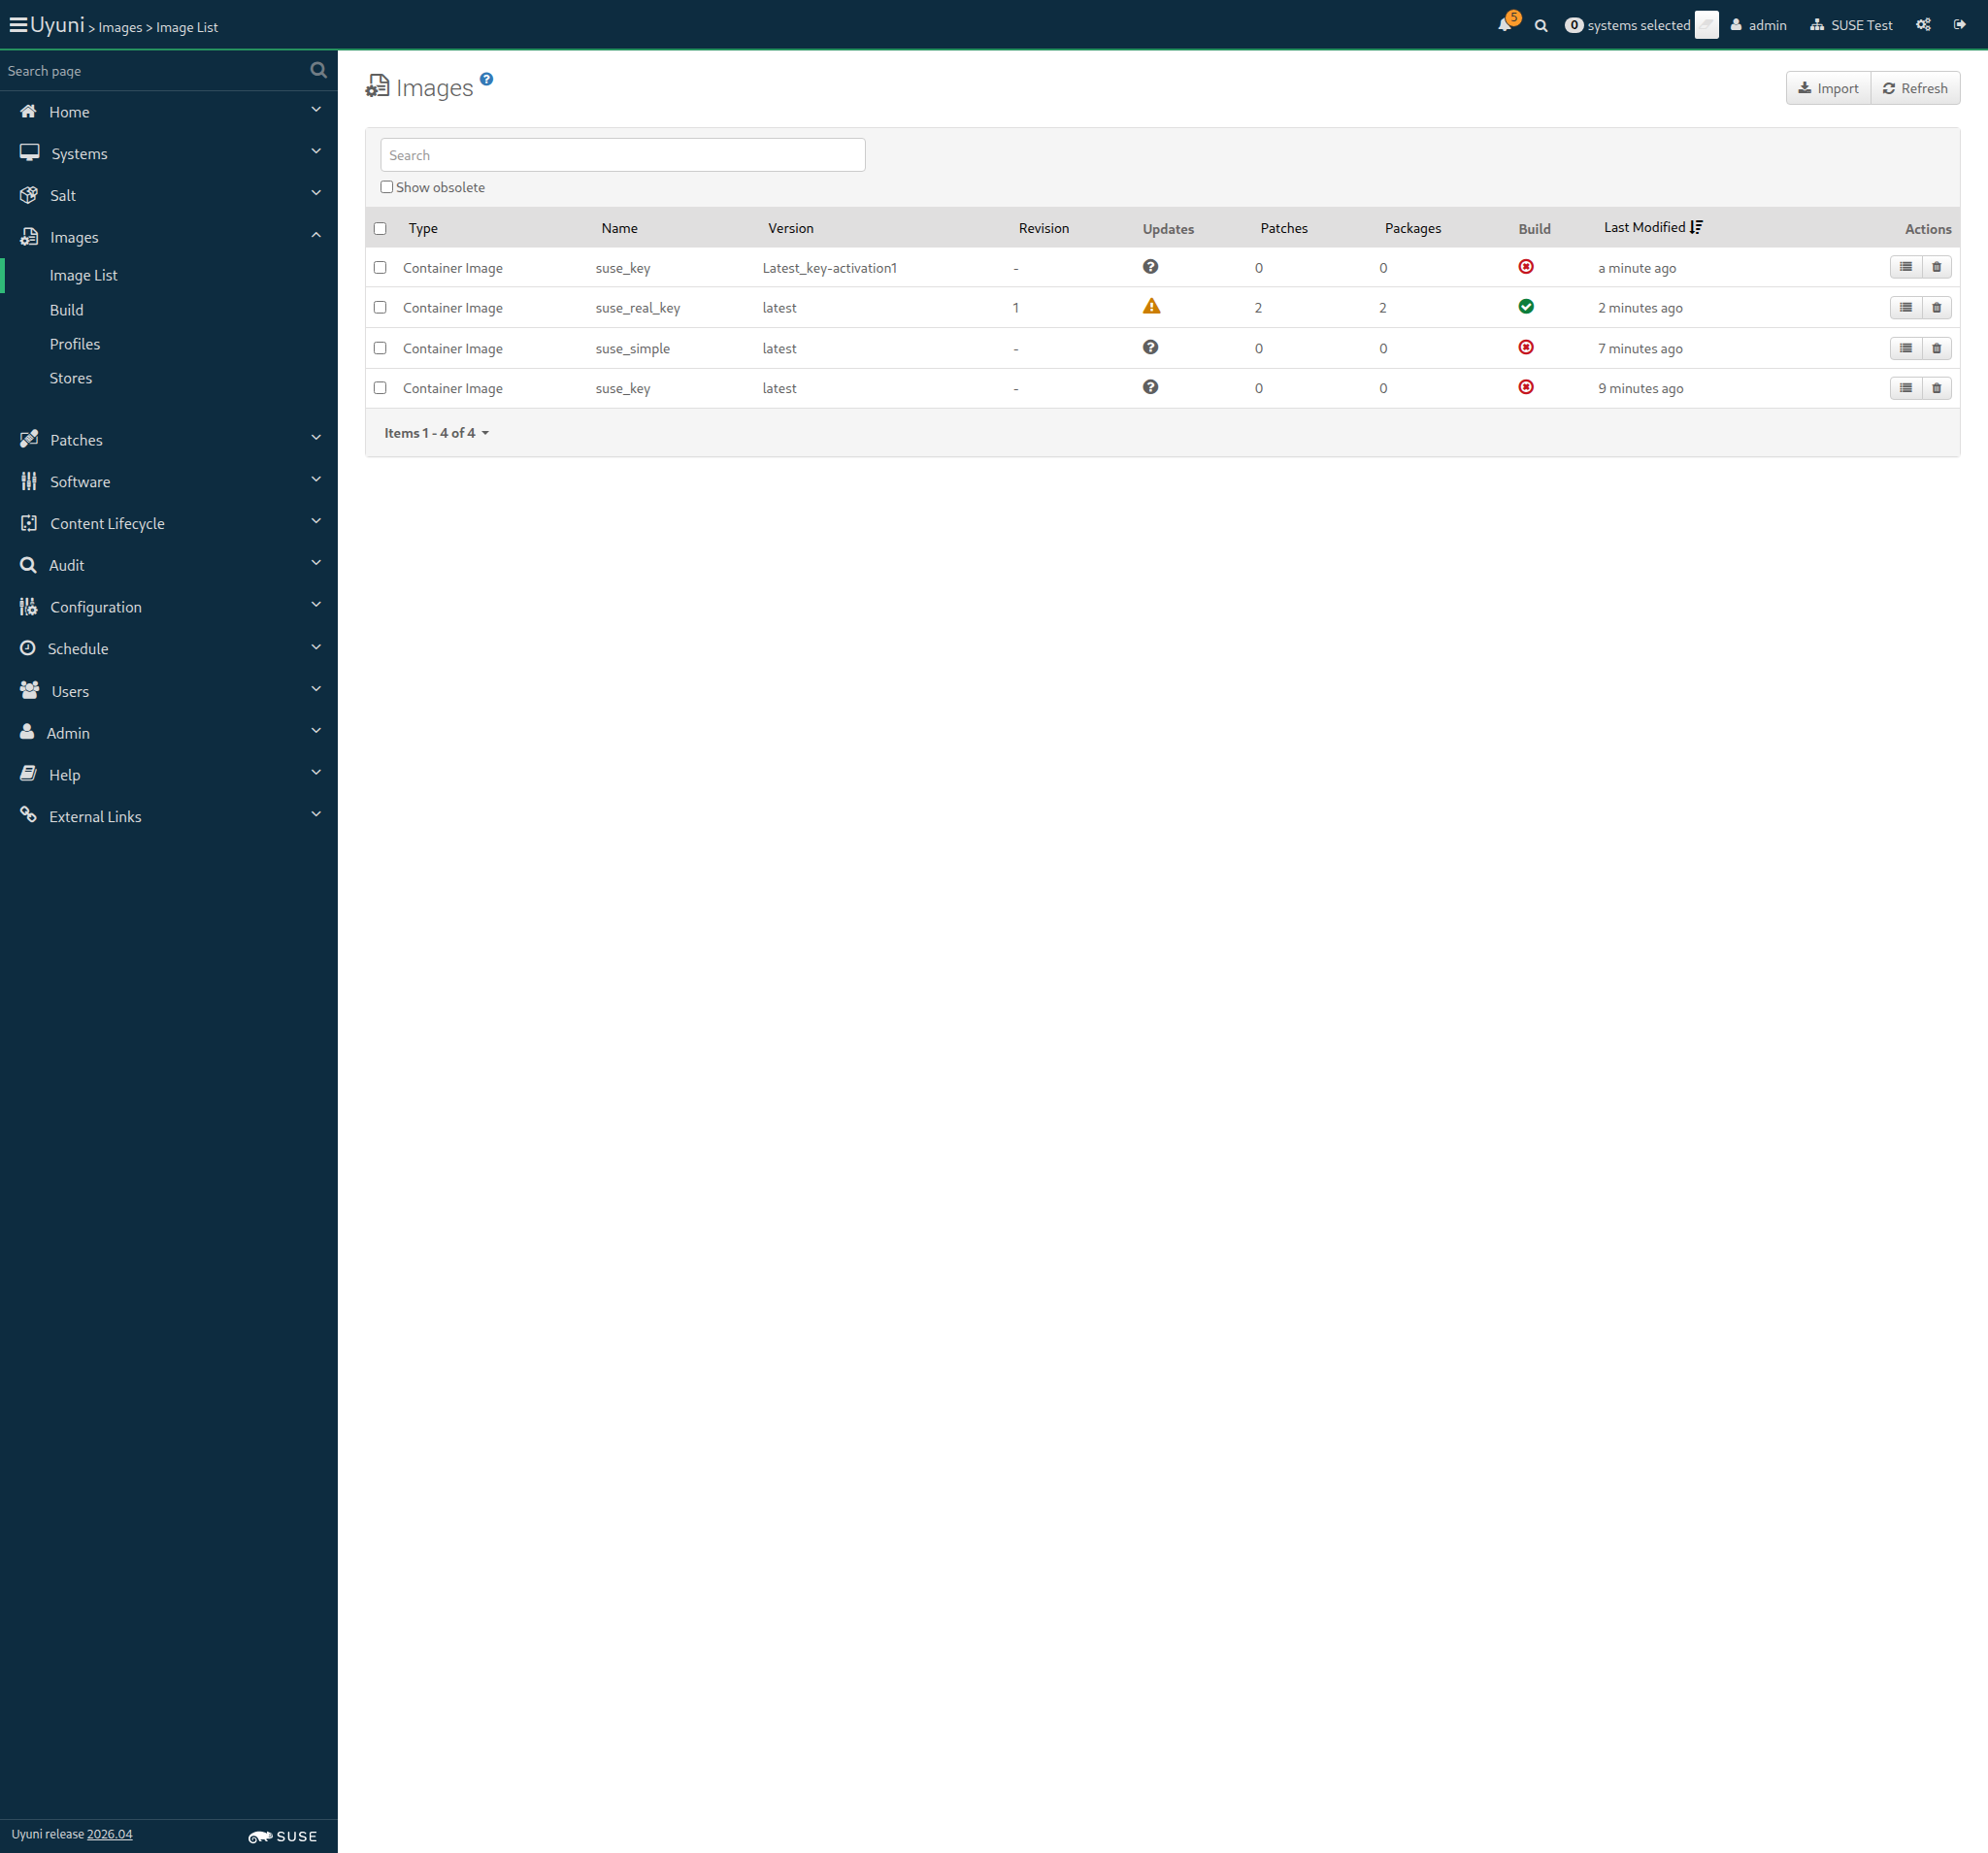
Screenshot +


List of images: [{"external"=>false, "name"=>"suse_key", "checksum"=>"", "obsolete"=>false, "id"=>1, "arch"=>"x86_64-redhat-linux", "type"=>"dockerfile", "version"=>"latest", "storeLabel"=>"galaxy-registry", "revision"=>0}, {"external"=>false, "name"=>"suse_simple", "checksum"=>"", "obsolete"=>false, "id"=>2, "arch"=>"x86_64-redhat-linux", "type"=>"dockerfile", "version"=>"latest", "storeLabel"=>"galaxy-registry", "revision"=>0}, {"external"=>false, "name"=>"suse_real_key", "checksum"=>"ab6e2a89fa18f8238659c9ae840d0eab861c13712f63e2bc38405d7ebf27e217", "obsolete"=>false, "id"=>3, "arch"=>"x86_64-redhat-linux", "type"=>"dockerfile", "version"=>"latest", "storeLabel"=>"galaxy-registry", "revision"=>1}, {"external"=>false, "name"=>"suse_key", "checksum"=>"", "obsolete"=>false, "id"=>4, "arch"=>"x86_64-redhat-linux", "type"=>"dockerfile", "version"=>"Latest_key-activation1", "storeLabel"=>"galaxy-registry", "revision"=>0}, {"external"=>false, "name"=>"suse_simple", "checksum"=>"", "obsolete"=>false, "id"=>5, "arch"=>"x86_64-redhat-linux", "type"=>"dockerfile", "version"=>"Latest_simple", "storeLabel"=>"galaxy-registry", "revision"=>0}]
Image Details: {"outdatedPackages"=>0, "buildServerId"=>1000010004, "obsolete"=>false, "bugErrata"=>0, "installedPackages"=>0, "type"=>"dockerfile", "version"=>"Latest_simple", "storeLabel"=>"galaxy-registry", "revision"=>0, "securityErrata"=>0, "buildStatus"=>"failed", "external"=>false, "profileLabel"=>"suse_simple", "name"=>"suse_simple", "checksum"=>"", "files"=>[], "id"=>5, "arch"=>"x86_64", "enhancementErrata"=>0}

Then the list of packages of image "suse_simple" with version "Latest_simple" is not empty 675ms Show Error +
                                            
the list of image packages is empty (ScriptError) ./features/step_definitions/docker_steps.rb:143:in `/^the list of packages of image "([^"]*)" with version "([^"]*)" is not empty$/' features/secondary/buildhost_docker_build_image.feature:115:in `the list of packages of image "suse_simple" with version "Latest_simple" is not empty'

18s 931ms Show Info +
18:06:34:000 - 18:06:35:000 | Current URL: https://uyuni-master-server.sumaci.aws/rhn/manager/cm/images
Screenshot +


When I delete the image "suse_key" with version "Latest_key-activation1" via API calls 895ms

Then the image "suse_simple" with version "Latest_key-activation1" doesn't exist via API calls 511ms

When I wait until no Salt job is running on "build_host" 1s 878ms

When I delete the image "suse_simple" with version "Latest_simple" via API calls 782ms

Then the image "suse_simple" with version "Latest_simple" doesn't exist via API calls 439ms

When I wait until no Salt job is running on "build_host" 1s 630ms

List of images: [{"external"=>false, "name"=>"suse_key", "checksum"=>"", "obsolete"=>false, "id"=>1, "arch"=>"x86_64-redhat-linux", "type"=>"dockerfile", "version"=>"latest", "storeLabel"=>"galaxy-registry", "revision"=>0}, {"external"=>false, "name"=>"suse_simple", "checksum"=>"", "obsolete"=>false, "id"=>2, "arch"=>"x86_64-redhat-linux", "type"=>"dockerfile", "version"=>"latest", "storeLabel"=>"galaxy-registry", "revision"=>0}, {"external"=>false, "name"=>"suse_real_key", "checksum"=>"ab6e2a89fa18f8238659c9ae840d0eab861c13712f63e2bc38405d7ebf27e217", "obsolete"=>false, "id"=>3, "arch"=>"x86_64-redhat-linux", "type"=>"dockerfile", "version"=>"latest", "storeLabel"=>"galaxy-registry", "revision"=>1}, {"external"=>false, "name"=>"suse_simple", "checksum"=>"", "obsolete"=>false, "id"=>6, "arch"=>"x86_64-redhat-linux", "type"=>"dockerfile", "version"=>"Latest_simple", "storeLabel"=>"galaxy-registry", "revision"=>0}]
Image Details: {"outdatedPackages"=>0, "buildServerId"=>1000010004, "obsolete"=>false, "bugErrata"=>0, "installedPackages"=>0, "type"=>"dockerfile", "version"=>"Latest_simple", "storeLabel"=>"galaxy-registry", "revision"=>0, "securityErrata"=>0, "buildStatus"=>"picked up", "external"=>false, "profileLabel"=>"suse_simple", "name"=>"suse_simple", "checksum"=>"", "files"=>[], "id"=>6, "arch"=>"x86_64", "enhancementErrata"=>0}
Image Details: {"outdatedPackages"=>0, "buildServerId"=>1000010004, "obsolete"=>false, "bugErrata"=>0, "installedPackages"=>0, "type"=>"dockerfile", "version"=>"Latest_simple", "storeLabel"=>"galaxy-registry", "revision"=>0, "securityErrata"=>0, "buildStatus"=>"failed", "external"=>false, "profileLabel"=>"suse_simple", "name"=>"suse_simple", "checksum"=>"", "files"=>[], "id"=>6, "arch"=>"x86_64", "enhancementErrata"=>0}

When I schedule the build of image "suse_simple" with version "Latest_simple" via API calls 818ms

And I wait at most 900 seconds until image "suse_simple" with version "Latest_simple" is built successfully via API 21s 864ms Show Error +
                                            
unknown error - image build failed. (SystemCallError) ./features/step_definitions/docker_steps.rb:55:in `block (2 levels) in (top (required))' ./features/support/commonlib.rb:100:in `block in repeat_until_timeout' ./features/support/commonlib.rb:89:in `repeat_until_timeout' ./features/step_definitions/docker_steps.rb:41:in `/^I wait at most (\d+) seconds until image "([^"]*)" with version "([^"]*)" is built successfully via API$/' features/secondary/buildhost_docker_build_image.feature:130:in `I wait at most 900 seconds until image "suse_simple" with version "Latest_simple" is built successfully via API'

And I wait at most 300 seconds until image "suse_simple" with version "Latest_simple" is inspected successfully via API 0s

When I wait until no Salt job is running on "build_host" 0s

18s 934ms Show Info +
18:07:00:000 - 18:07:23:000 | Current URL: https://uyuni-master-server.sumaci.aws/rhn/manager/cm/images
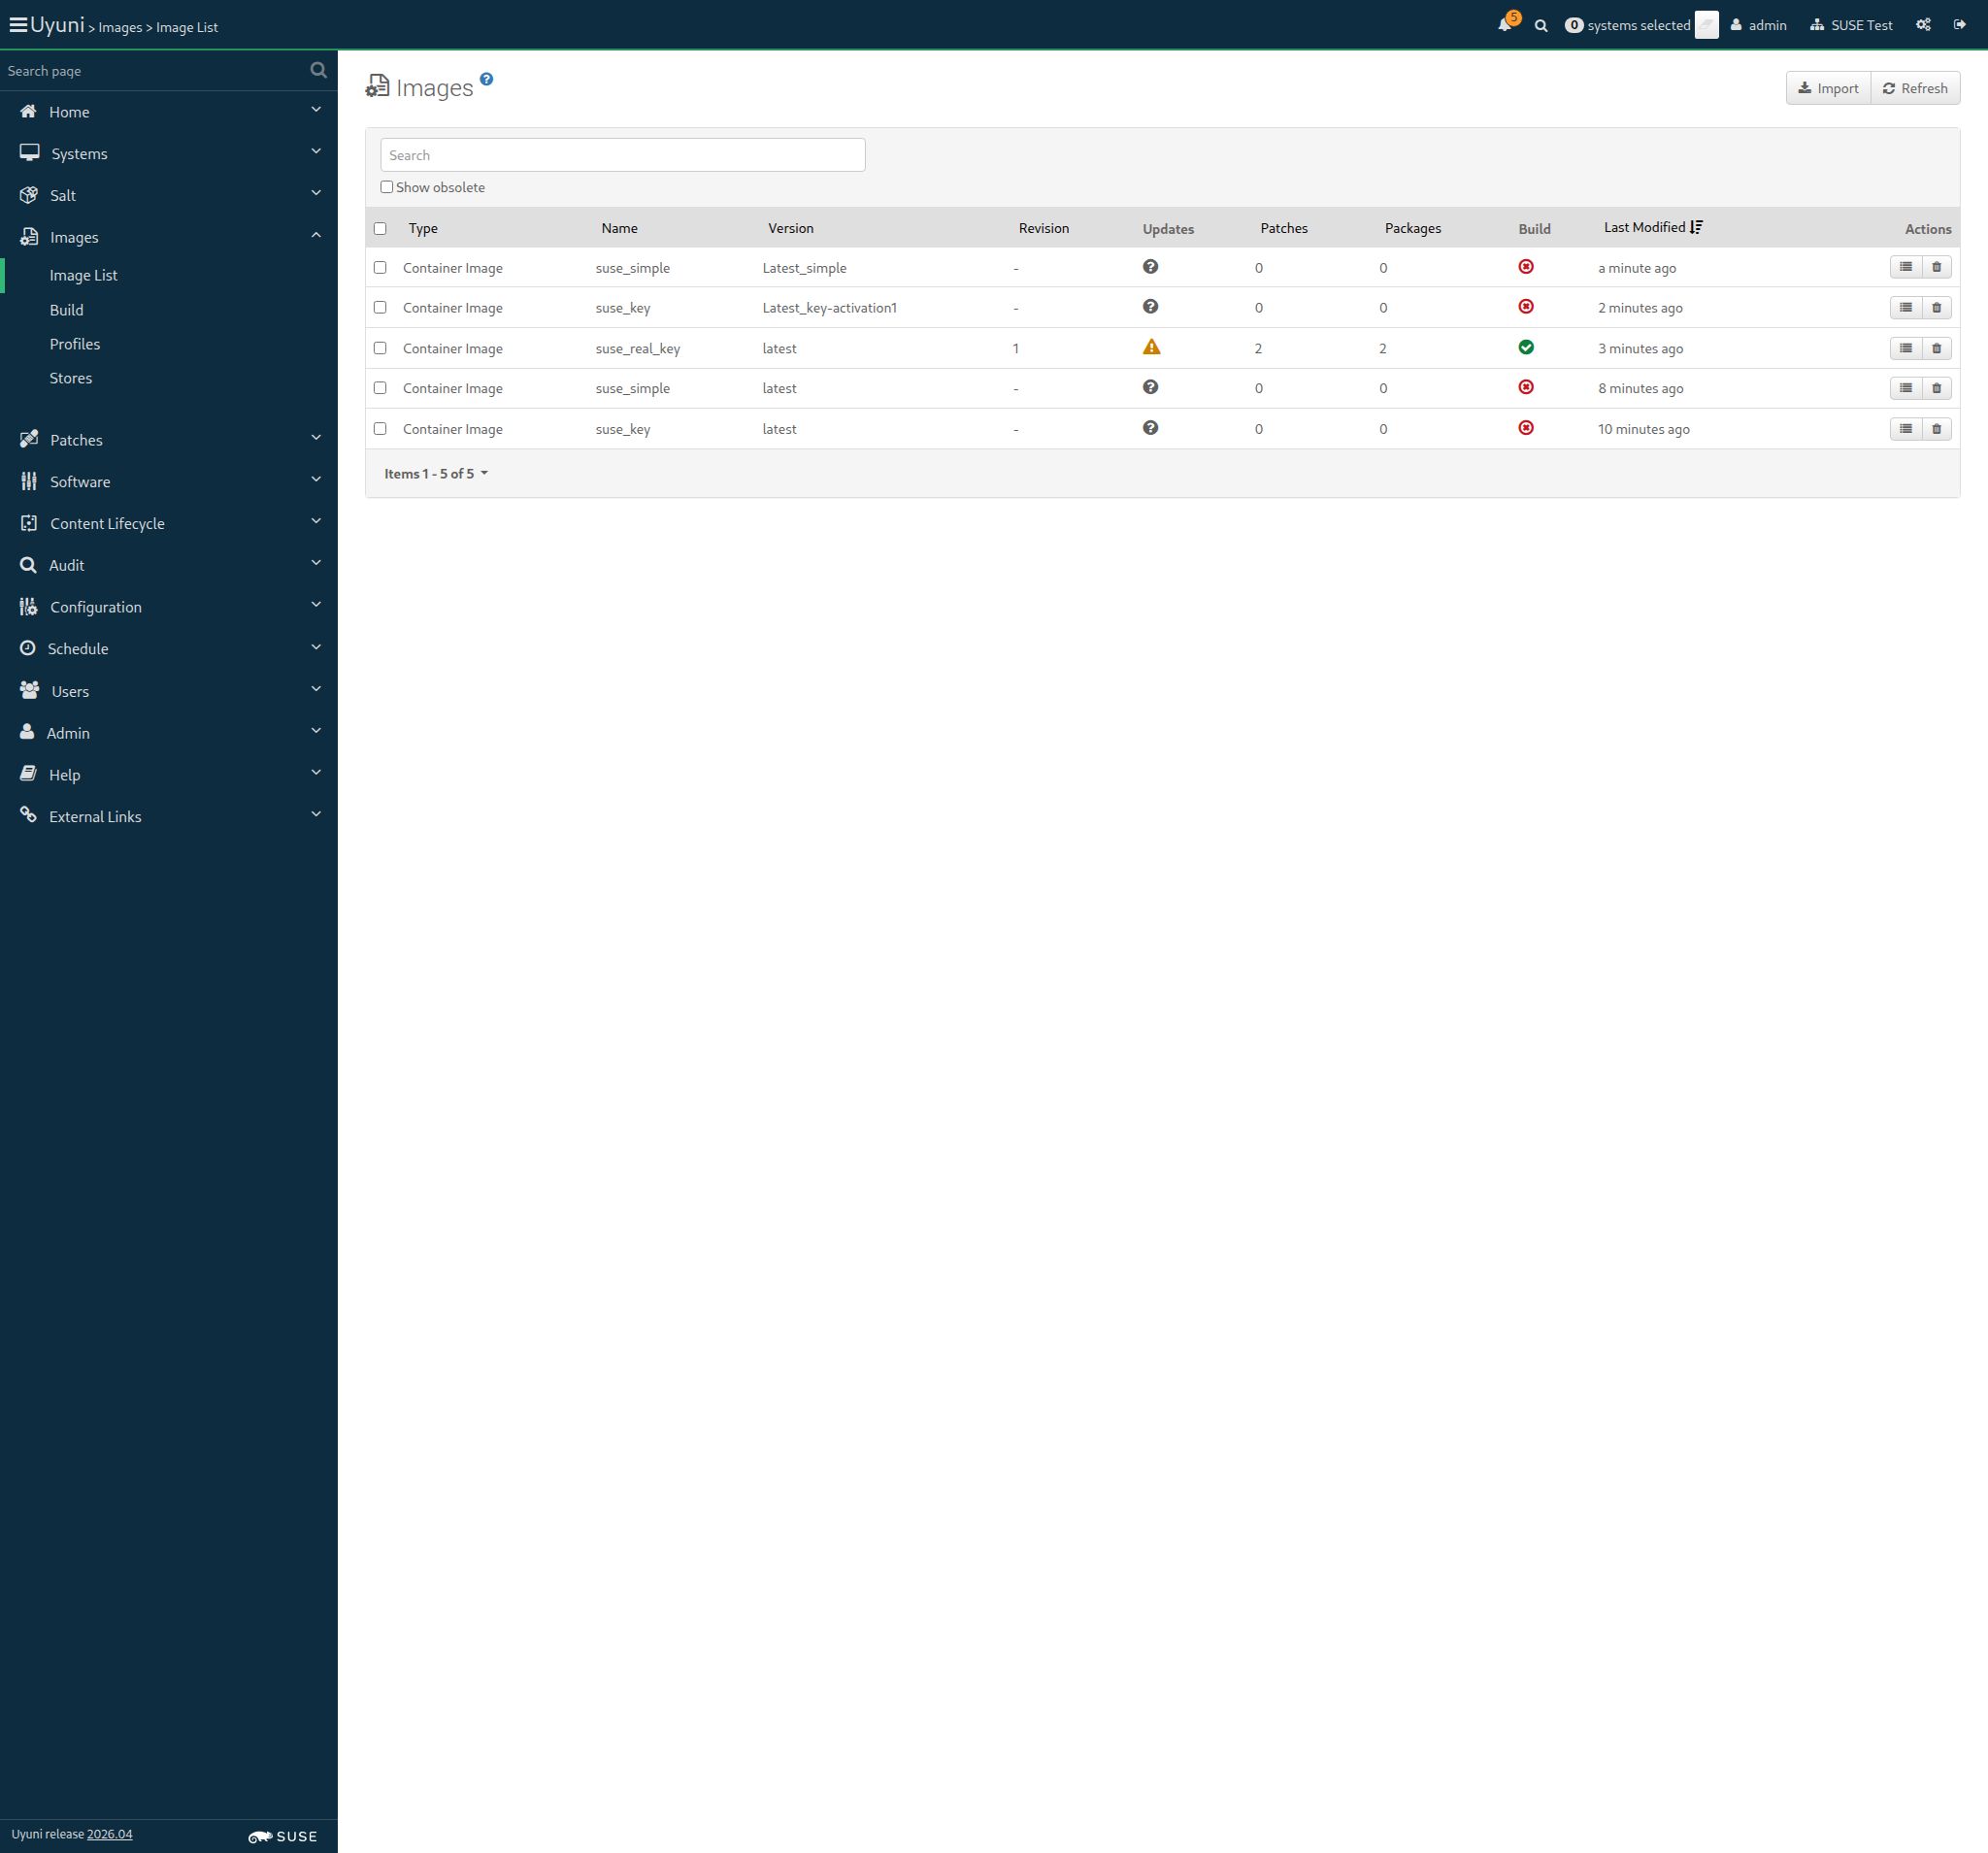
Screenshot +


List of images: [{"external"=>false, "name"=>"suse_key", "checksum"=>"", "obsolete"=>false, "id"=>1, "arch"=>"x86_64-redhat-linux", "type"=>"dockerfile", "version"=>"latest", "storeLabel"=>"galaxy-registry", "revision"=>0}, {"external"=>false, "name"=>"suse_simple", "checksum"=>"", "obsolete"=>false, "id"=>2, "arch"=>"x86_64-redhat-linux", "type"=>"dockerfile", "version"=>"latest", "storeLabel"=>"galaxy-registry", "revision"=>0}, {"external"=>false, "name"=>"suse_real_key", "checksum"=>"ab6e2a89fa18f8238659c9ae840d0eab861c13712f63e2bc38405d7ebf27e217", "obsolete"=>false, "id"=>3, "arch"=>"x86_64-redhat-linux", "type"=>"dockerfile", "version"=>"latest", "storeLabel"=>"galaxy-registry", "revision"=>1}, {"external"=>false, "name"=>"suse_simple", "checksum"=>"", "obsolete"=>false, "id"=>6, "arch"=>"x86_64-redhat-linux", "type"=>"dockerfile", "version"=>"Latest_simple", "storeLabel"=>"galaxy-registry", "revision"=>0}]
Image Details: {"outdatedPackages"=>0, "buildServerId"=>1000010004, "obsolete"=>false, "bugErrata"=>0, "installedPackages"=>0, "type"=>"dockerfile", "version"=>"Latest_simple", "storeLabel"=>"galaxy-registry", "revision"=>0, "securityErrata"=>0, "buildStatus"=>"failed", "external"=>false, "profileLabel"=>"suse_simple", "name"=>"suse_simple", "checksum"=>"", "files"=>[], "id"=>6, "arch"=>"x86_64", "enhancementErrata"=>0}

Then the list of packages of image "suse_simple" with version "Latest_simple" is not empty 725ms Show Error +
                                            
the list of image packages is empty (ScriptError) ./features/step_definitions/docker_steps.rb:143:in `/^the list of packages of image "([^"]*)" with version "([^"]*)" is not empty$/' features/secondary/buildhost_docker_build_image.feature:136:in `the list of packages of image "suse_simple" with version "Latest_simple" is not empty'

20s 785ms Show Info +
18:07:42:000 - 18:07:42:000 | Current URL: https://uyuni-master-server.sumaci.aws/rhn/manager/cm/images
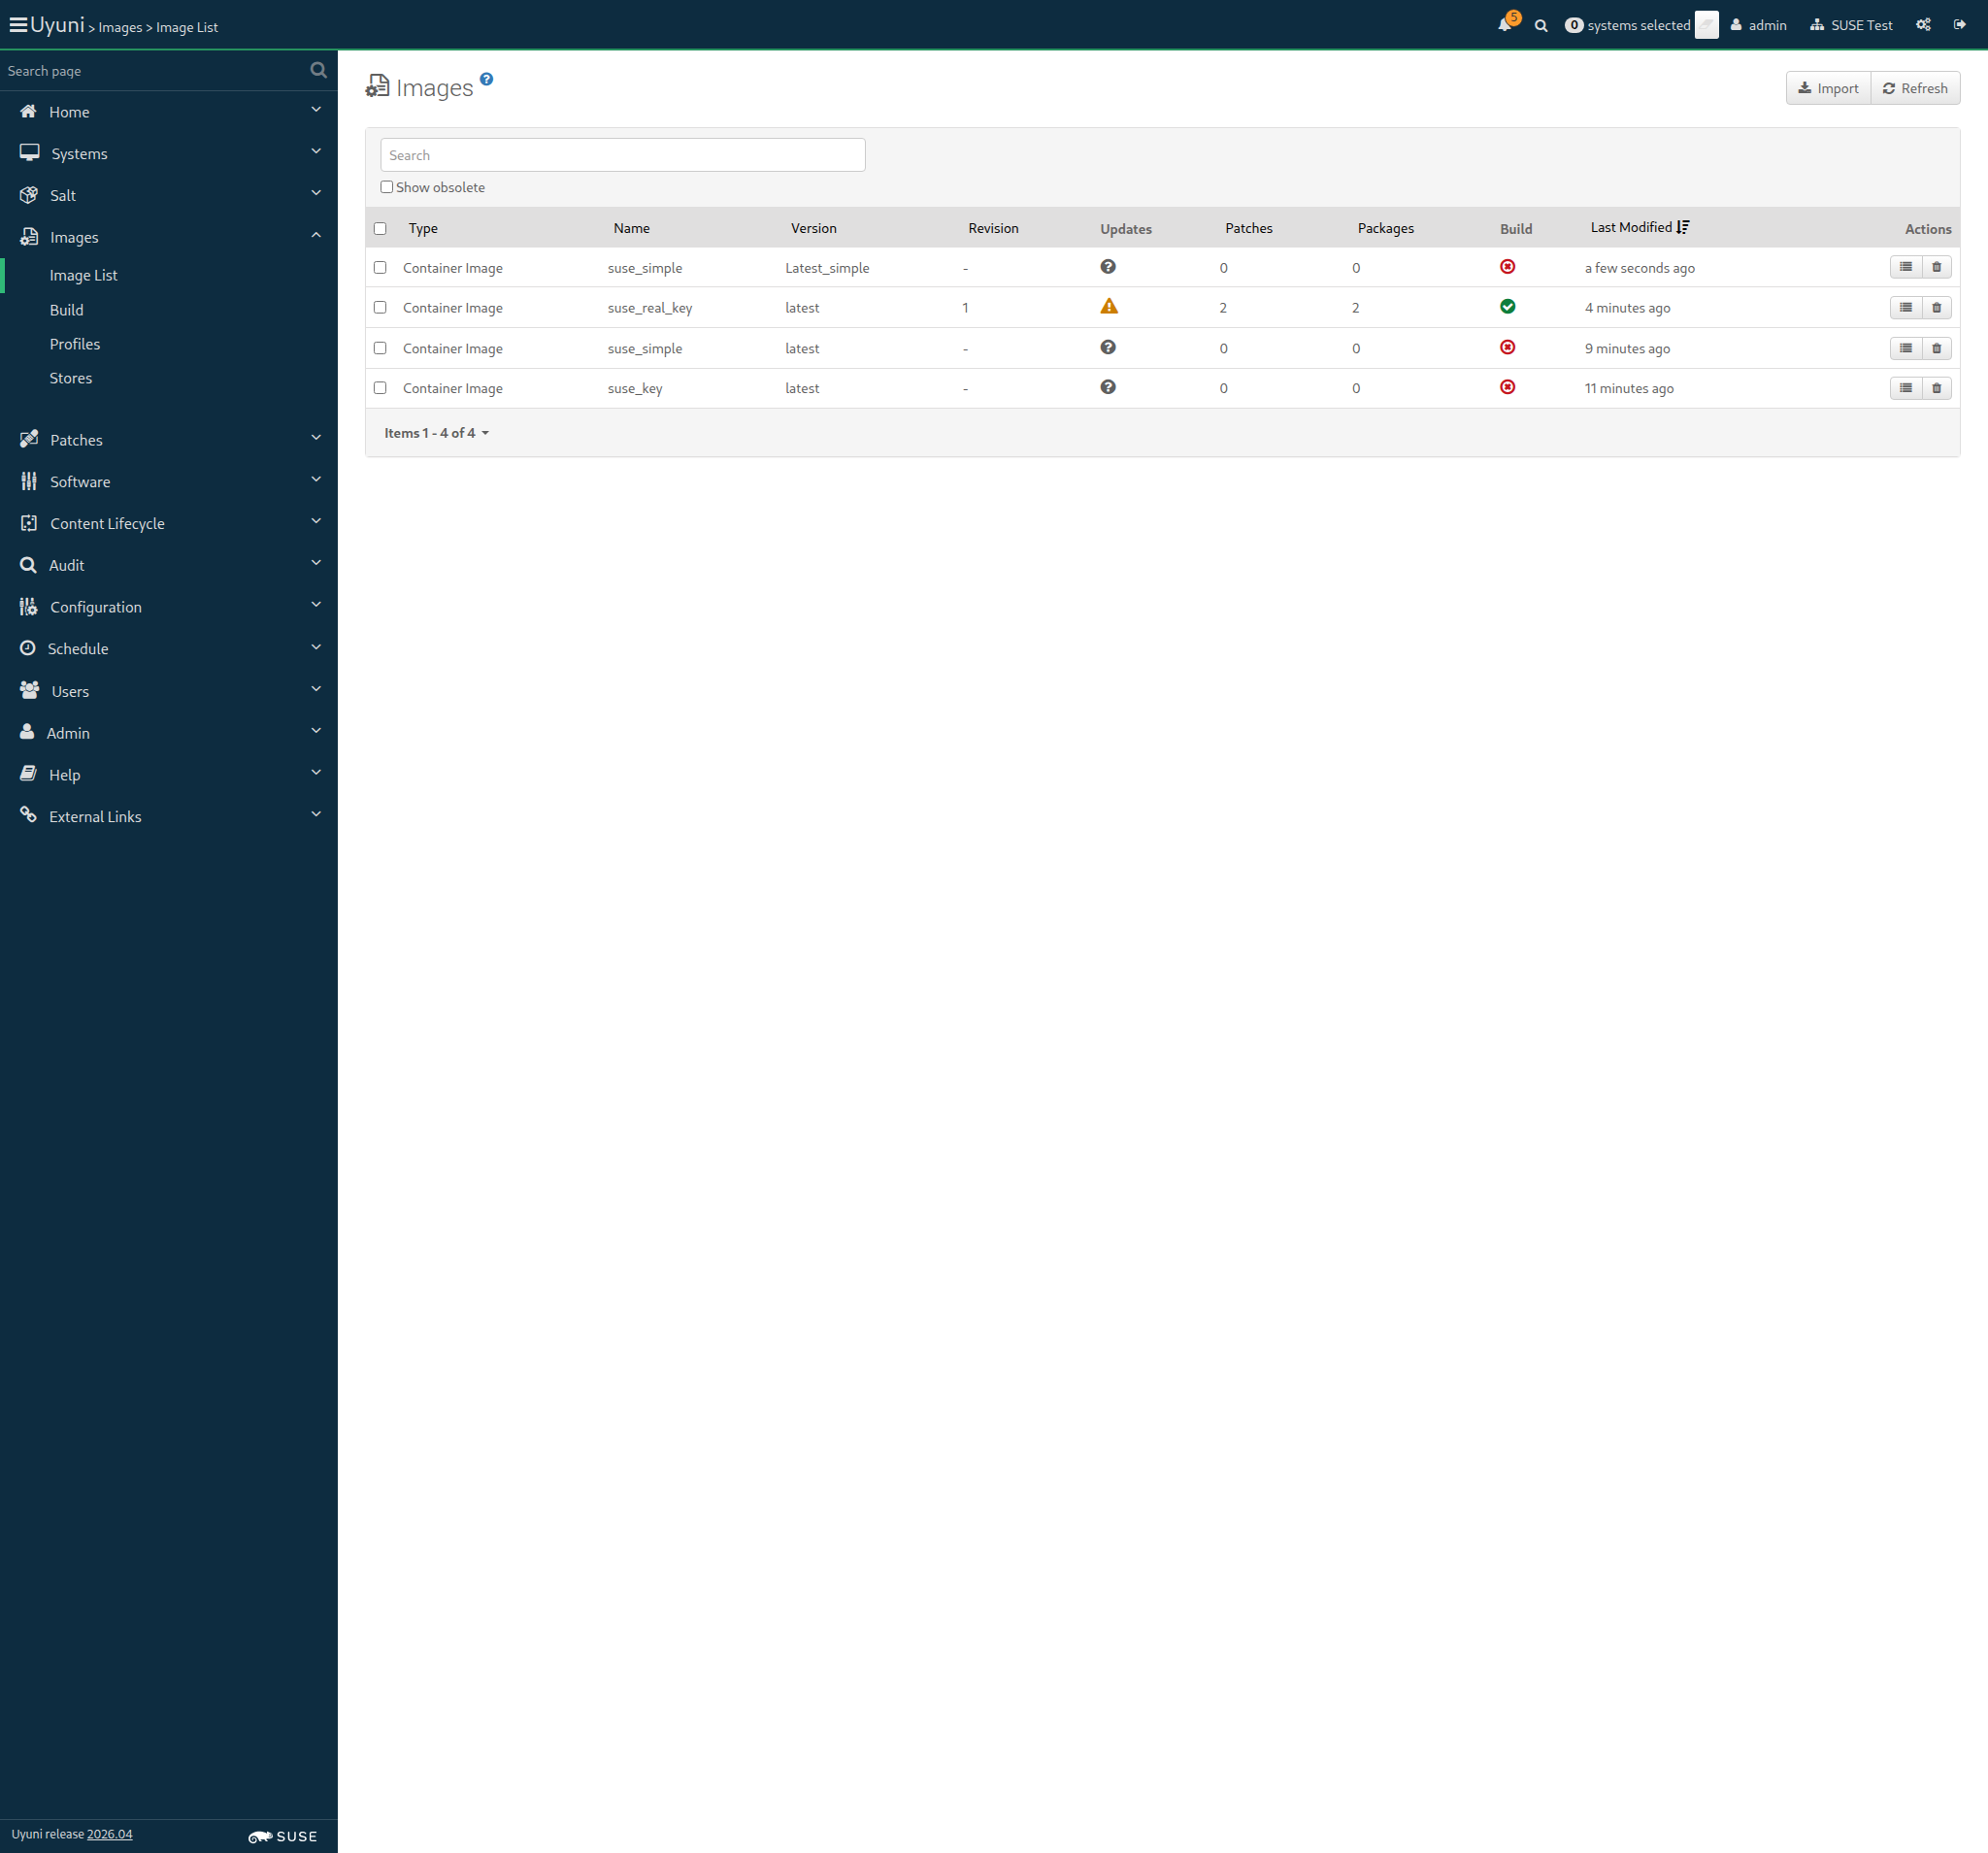
Screenshot +


List of images: [{"external"=>false, "name"=>"suse_key", "checksum"=>"", "obsolete"=>false, "id"=>1, "arch"=>"x86_64-redhat-linux", "type"=>"dockerfile", "version"=>"latest", "storeLabel"=>"galaxy-registry", "revision"=>0}, {"external"=>false, "name"=>"suse_simple", "checksum"=>"", "obsolete"=>false, "id"=>2, "arch"=>"x86_64-redhat-linux", "type"=>"dockerfile", "version"=>"latest", "storeLabel"=>"galaxy-registry", "revision"=>0}, {"external"=>false, "name"=>"suse_real_key", "checksum"=>"ab6e2a89fa18f8238659c9ae840d0eab861c13712f63e2bc38405d7ebf27e217", "obsolete"=>false, "id"=>3, "arch"=>"x86_64-redhat-linux", "type"=>"dockerfile", "version"=>"latest", "storeLabel"=>"galaxy-registry", "revision"=>1}, {"external"=>false, "name"=>"suse_simple", "checksum"=>"", "obsolete"=>false, "id"=>6, "arch"=>"x86_64-redhat-linux", "type"=>"dockerfile", "version"=>"Latest_simple", "storeLabel"=>"galaxy-registry", "revision"=>0}, {"external"=>false, "name"=>"suse_key", "checksum"=>"", "obsolete"=>false, "id"=>7, "arch"=>"x86_64-redhat-linux", "type"=>"dockerfile", "version"=>"Latest_key-activation1", "storeLabel"=>"galaxy-registry", "revision"=>0}]
Image Details: {"outdatedPackages"=>0, "buildServerId"=>1000010004, "obsolete"=>false, "bugErrata"=>0, "installedPackages"=>0, "type"=>"dockerfile", "version"=>"Latest_key-activation1", "storeLabel"=>"galaxy-registry", "revision"=>0, "securityErrata"=>0, "buildStatus"=>"picked up", "external"=>false, "profileLabel"=>"suse_key", "name"=>"suse_key", "checksum"=>"", "files"=>[], "id"=>7, "arch"=>"x86_64", "enhancementErrata"=>0}
Image Details: {"outdatedPackages"=>0, "buildServerId"=>1000010004, "obsolete"=>false, "bugErrata"=>0, "installedPackages"=>0, "type"=>"dockerfile", "version"=>"Latest_key-activation1", "storeLabel"=>"galaxy-registry", "revision"=>0, "securityErrata"=>0, "buildStatus"=>"failed", "external"=>false, "profileLabel"=>"suse_key", "name"=>"suse_key", "checksum"=>"", "files"=>[], "id"=>7, "arch"=>"x86_64", "enhancementErrata"=>0}

When I schedule the build of image "suse_key" with version "Latest_key-activation1" via API calls 780ms

And I wait at most 900 seconds until image "suse_key" with version "Latest_key-activation1" is built successfully via API 22s 79ms Show Error +
                                            
unknown error - image build failed. (SystemCallError) ./features/step_definitions/docker_steps.rb:55:in `block (2 levels) in (top (required))' ./features/support/commonlib.rb:100:in `block in repeat_until_timeout' ./features/support/commonlib.rb:89:in `repeat_until_timeout' ./features/step_definitions/docker_steps.rb:41:in `/^I wait at most (\d+) seconds until image "([^"]*)" with version "([^"]*)" is built successfully via API$/' features/secondary/buildhost_docker_build_image.feature:141:in `I wait at most 900 seconds until image "suse_key" with version "Latest_key-activation1" is built successfully via API'

And I wait at most 300 seconds until image "suse_key" with version "Latest_key-activation1" is inspected successfully via API 0s

When I wait until no Salt job is running on "build_host" 0s

20s 887ms Show Info +
18:08:03:000 - 18:08:26:000 | Current URL: https://uyuni-master-server.sumaci.aws/rhn/manager/cm/images
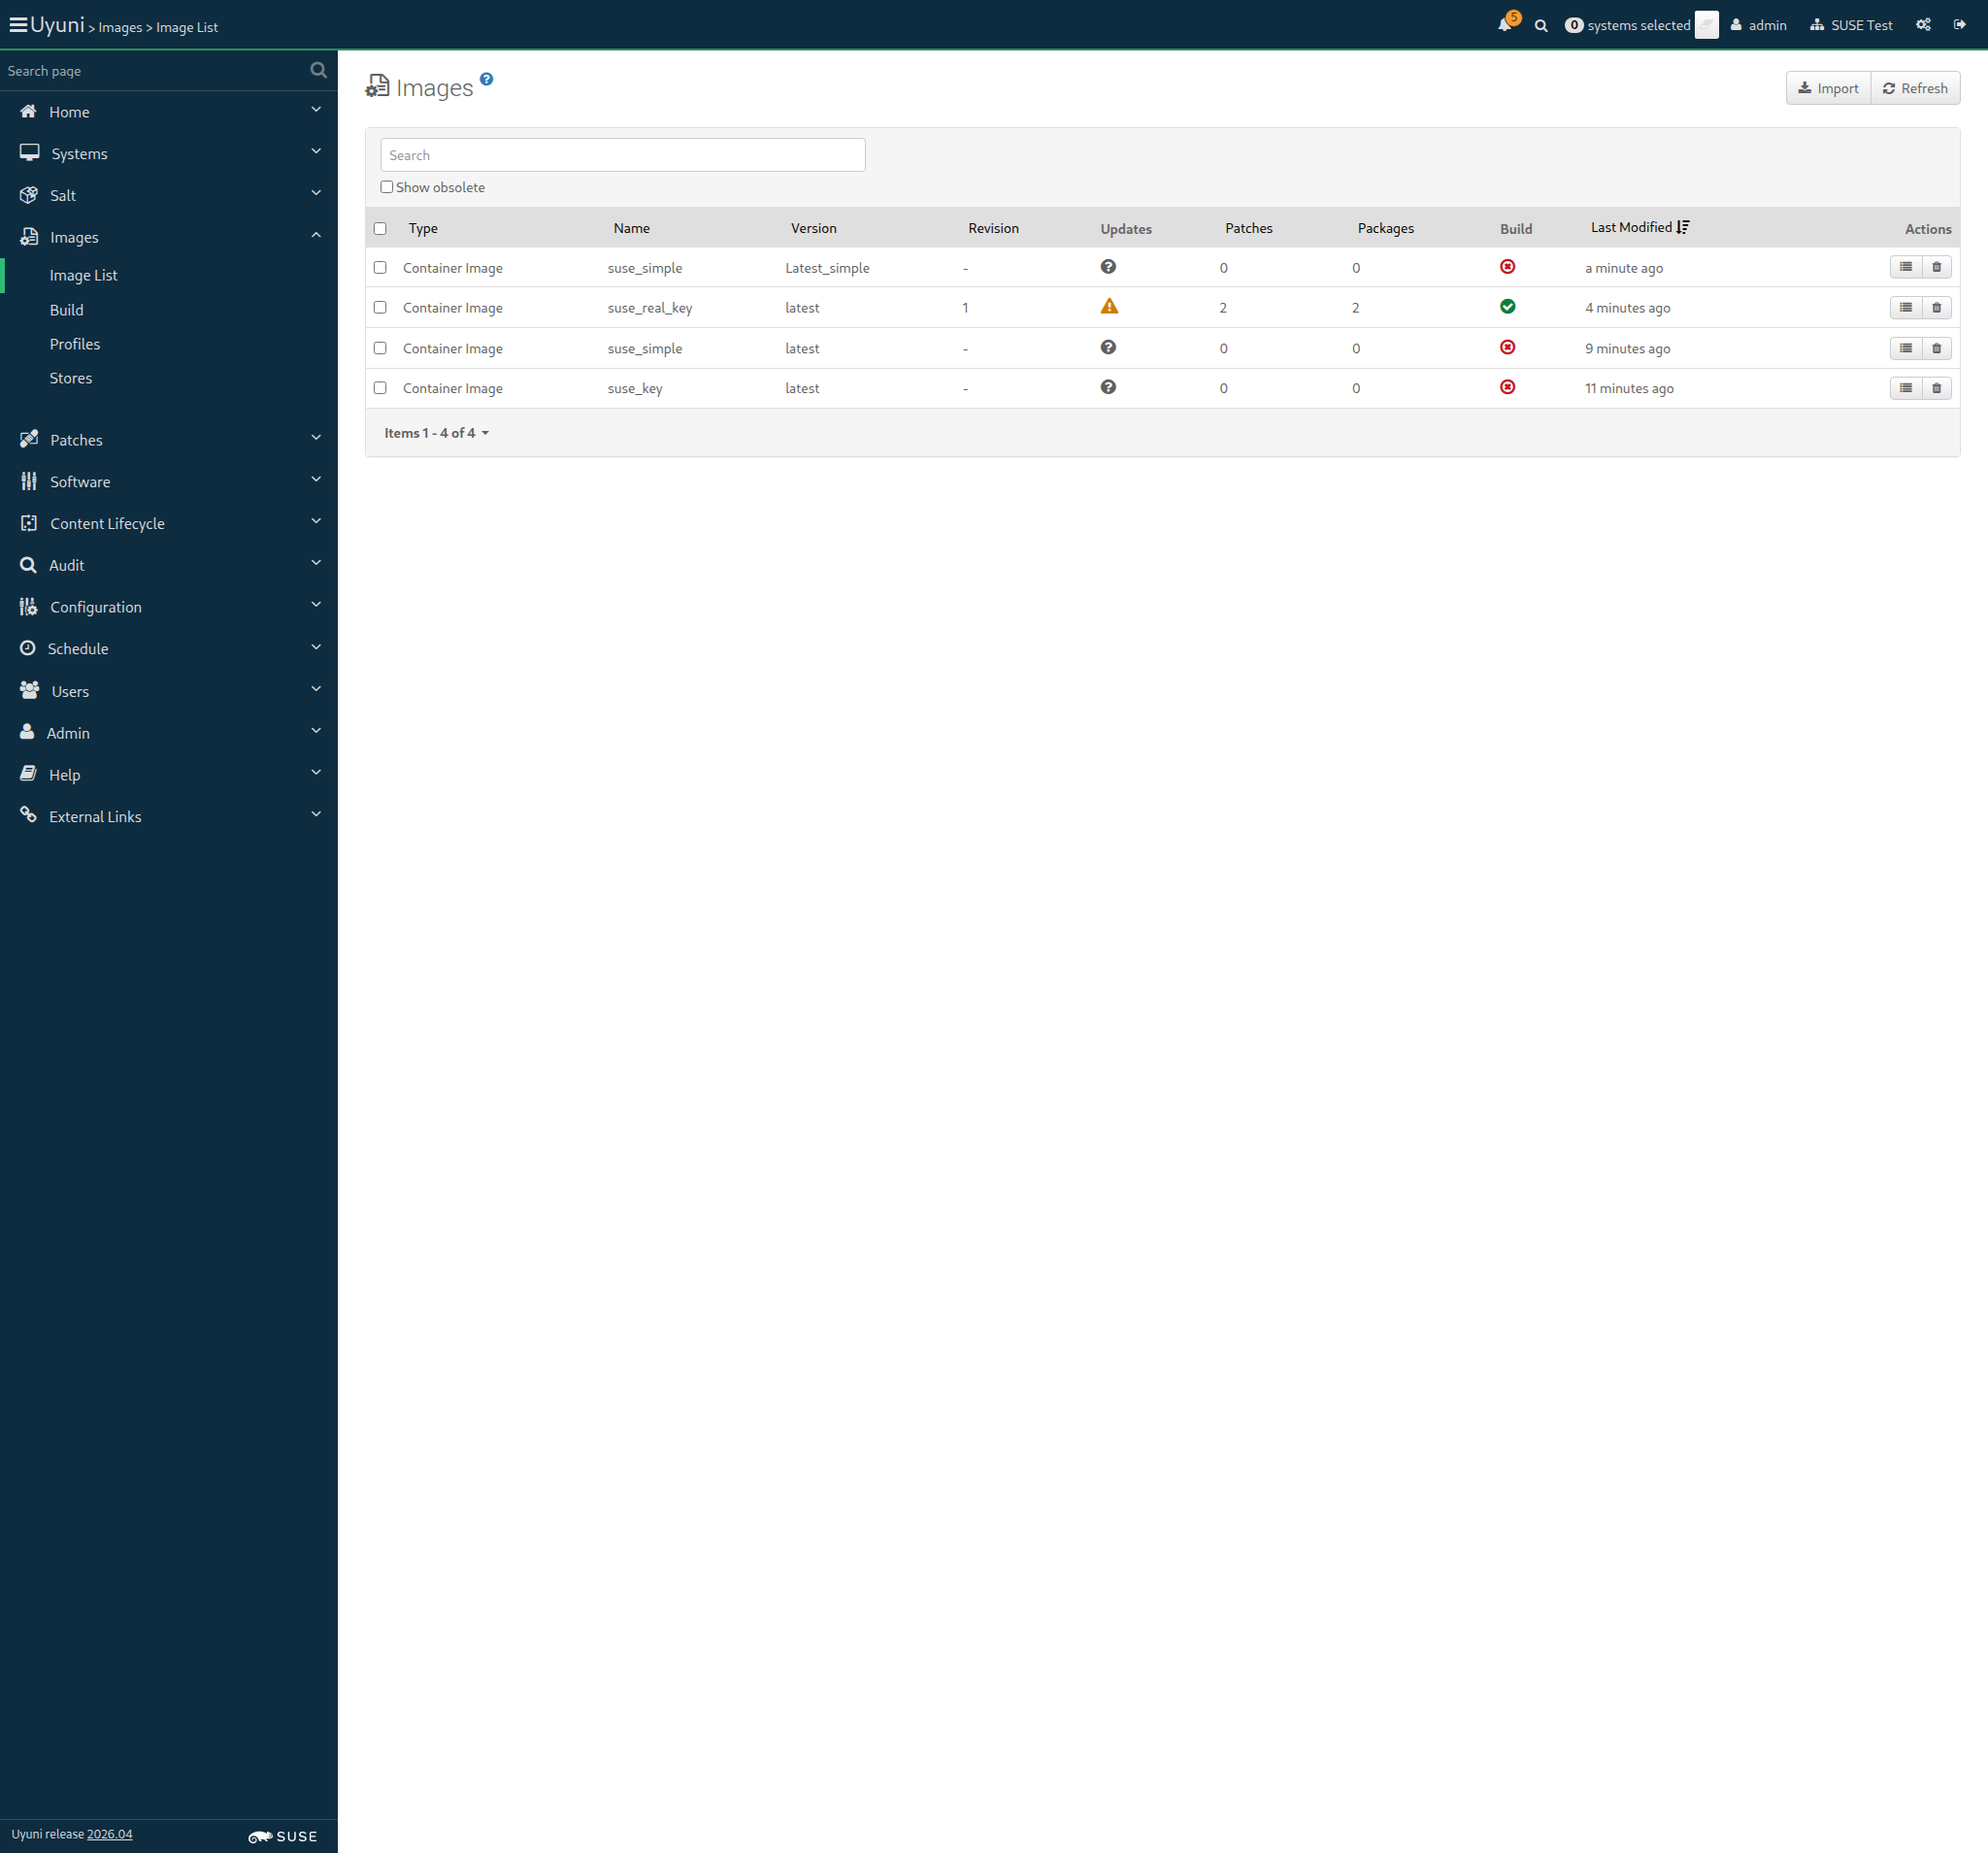
Screenshot +


List of images: [{"external"=>false, "name"=>"suse_key", "checksum"=>"", "obsolete"=>false, "id"=>1, "arch"=>"x86_64-redhat-linux", "type"=>"dockerfile", "version"=>"latest", "storeLabel"=>"galaxy-registry", "revision"=>0}, {"external"=>false, "name"=>"suse_simple", "checksum"=>"", "obsolete"=>false, "id"=>2, "arch"=>"x86_64-redhat-linux", "type"=>"dockerfile", "version"=>"latest", "storeLabel"=>"galaxy-registry", "revision"=>0}, {"external"=>false, "name"=>"suse_real_key", "checksum"=>"ab6e2a89fa18f8238659c9ae840d0eab861c13712f63e2bc38405d7ebf27e217", "obsolete"=>false, "id"=>3, "arch"=>"x86_64-redhat-linux", "type"=>"dockerfile", "version"=>"latest", "storeLabel"=>"galaxy-registry", "revision"=>1}, {"external"=>false, "name"=>"suse_simple", "checksum"=>"", "obsolete"=>false, "id"=>6, "arch"=>"x86_64-redhat-linux", "type"=>"dockerfile", "version"=>"Latest_simple", "storeLabel"=>"galaxy-registry", "revision"=>0}, {"external"=>false, "name"=>"suse_key", "checksum"=>"", "obsolete"=>false, "id"=>7, "arch"=>"x86_64-redhat-linux", "type"=>"dockerfile", "version"=>"Latest_key-activation1", "storeLabel"=>"galaxy-registry", "revision"=>0}]
Image Details: {"outdatedPackages"=>0, "buildServerId"=>1000010004, "obsolete"=>false, "bugErrata"=>0, "installedPackages"=>0, "type"=>"dockerfile", "version"=>"Latest_key-activation1", "storeLabel"=>"galaxy-registry", "revision"=>0, "securityErrata"=>0, "buildStatus"=>"failed", "external"=>false, "profileLabel"=>"suse_key", "name"=>"suse_key", "checksum"=>"", "files"=>[], "id"=>7, "arch"=>"x86_64", "enhancementErrata"=>0}

Then the list of packages of image "suse_key" with version "Latest_key-activation1" is not empty 774ms Show Error +
                                            
the list of image packages is empty (ScriptError) ./features/step_definitions/docker_steps.rb:143:in `/^the list of packages of image "([^"]*)" with version "([^"]*)" is not empty$/' features/secondary/buildhost_docker_build_image.feature:147:in `the list of packages of image "suse_key" with version "Latest_key-activation1" is not empty'

20s 453ms Show Info +
18:08:47:000 - 18:08:48:000 | Current URL: https://uyuni-master-server.sumaci.aws/rhn/manager/cm/images
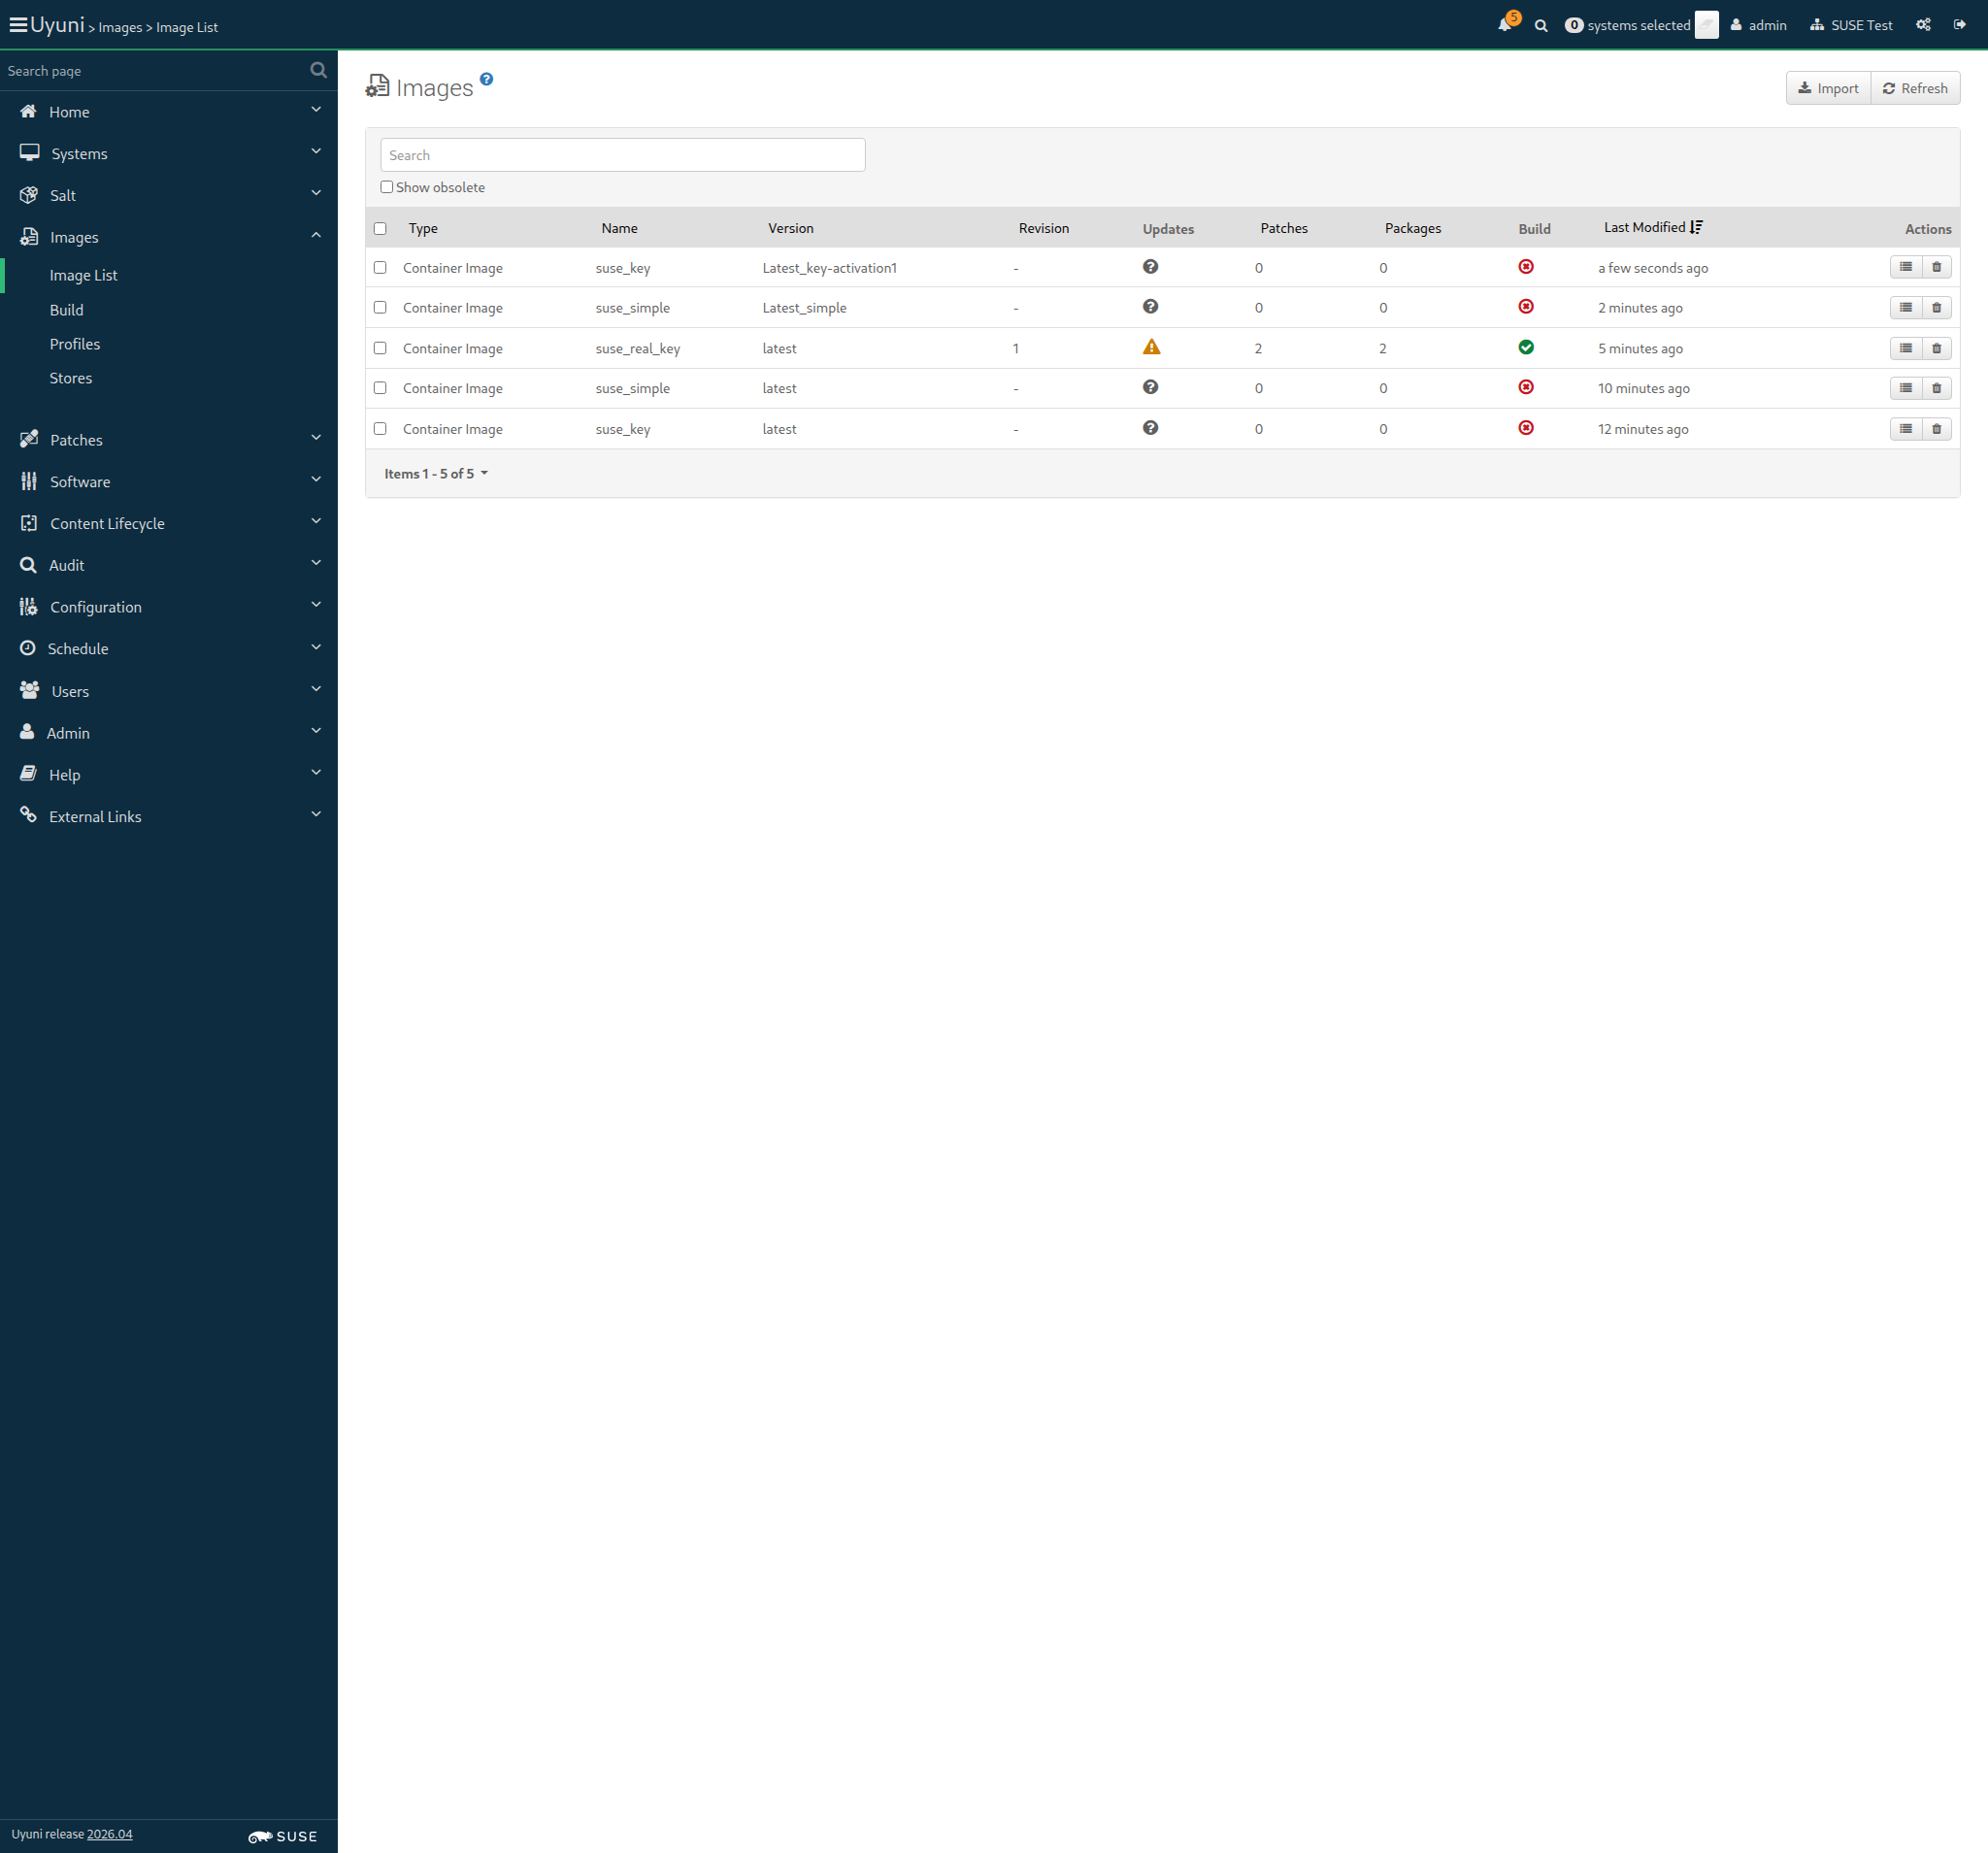
Screenshot +


List of images: [{"external"=>false, "name"=>"suse_key", "checksum"=>"", "obsolete"=>false, "id"=>1, "arch"=>"x86_64-redhat-linux", "type"=>"dockerfile", "version"=>"latest", "storeLabel"=>"galaxy-registry", "revision"=>0}, {"external"=>false, "name"=>"suse_simple", "checksum"=>"", "obsolete"=>false, "id"=>2, "arch"=>"x86_64-redhat-linux", "type"=>"dockerfile", "version"=>"latest", "storeLabel"=>"galaxy-registry", "revision"=>0}, {"external"=>false, "name"=>"suse_real_key", "checksum"=>"ab6e2a89fa18f8238659c9ae840d0eab861c13712f63e2bc38405d7ebf27e217", "obsolete"=>false, "id"=>3, "arch"=>"x86_64-redhat-linux", "type"=>"dockerfile", "version"=>"latest", "storeLabel"=>"galaxy-registry", "revision"=>1}, {"external"=>false, "name"=>"suse_simple", "checksum"=>"", "obsolete"=>false, "id"=>6, "arch"=>"x86_64-redhat-linux", "type"=>"dockerfile", "version"=>"Latest_simple", "storeLabel"=>"galaxy-registry", "revision"=>0}, {"external"=>false, "name"=>"suse_key", "checksum"=>"", "obsolete"=>false, "id"=>7, "arch"=>"x86_64-redhat-linux", "type"=>"dockerfile", "version"=>"Latest_key-activation1", "storeLabel"=>"galaxy-registry", "revision"=>0}, {"external"=>false, "name"=>"suse_real_key", "checksum"=>"", "obsolete"=>false, "id"=>8, "arch"=>"x86_64-redhat-linux", "type"=>"dockerfile", "version"=>"GUI_BUILT_IMAGE", "storeLabel"=>"galaxy-registry", "revision"=>1}]
Image Details: {"outdatedPackages"=>0, "buildServerId"=>1000010004, "obsolete"=>false, "bugErrata"=>0, "installedPackages"=>0, "type"=>"dockerfile", "inspectStatus"=>"picked up", "version"=>"GUI_BUILT_IMAGE", "storeLabel"=>"galaxy-registry", "revision"=>1, "securityErrata"=>0, "buildStatus"=>"completed", "external"=>false, "profileLabel"=>"suse_real_key", "name"=>"suse_real_key", "checksum"=>"", "files"=>[], "id"=>8, "arch"=>"x86_64", "enhancementErrata"=>0}
List of images: [{"external"=>false, "name"=>"suse_key", "checksum"=>"", "obsolete"=>false, "id"=>1, "arch"=>"x86_64-redhat-linux", "type"=>"dockerfile", "version"=>"latest", "storeLabel"=>"galaxy-registry", "revision"=>0}, {"external"=>false, "name"=>"suse_simple", "checksum"=>"", "obsolete"=>false, "id"=>2, "arch"=>"x86_64-redhat-linux", "type"=>"dockerfile", "version"=>"latest", "storeLabel"=>"galaxy-registry", "revision"=>0}, {"external"=>false, "name"=>"suse_real_key", "checksum"=>"ab6e2a89fa18f8238659c9ae840d0eab861c13712f63e2bc38405d7ebf27e217", "obsolete"=>false, "id"=>3, "arch"=>"x86_64-redhat-linux", "type"=>"dockerfile", "version"=>"latest", "storeLabel"=>"galaxy-registry", "revision"=>1}, {"external"=>false, "name"=>"suse_simple", "checksum"=>"", "obsolete"=>false, "id"=>6, "arch"=>"x86_64-redhat-linux", "type"=>"dockerfile", "version"=>"Latest_simple", "storeLabel"=>"galaxy-registry", "revision"=>0}, {"external"=>false, "name"=>"suse_key", "checksum"=>"", "obsolete"=>false, "id"=>7, "arch"=>"x86_64-redhat-linux", "type"=>"dockerfile", "version"=>"Latest_key-activation1", "storeLabel"=>"galaxy-registry", "revision"=>0}, {"external"=>false, "name"=>"suse_real_key", "checksum"=>"", "obsolete"=>false, "id"=>8, "arch"=>"x86_64-redhat-linux", "type"=>"dockerfile", "version"=>"GUI_BUILT_IMAGE", "storeLabel"=>"galaxy-registry", "revision"=>1}]
Image Details: {"outdatedPackages"=>0, "buildServerId"=>1000010004, "obsolete"=>false, "bugErrata"=>0, "installedPackages"=>0, "type"=>"dockerfile", "inspectStatus"=>"picked up", "version"=>"GUI_BUILT_IMAGE", "storeLabel"=>"galaxy-registry", "revision"=>1, "securityErrata"=>0, "buildStatus"=>"completed", "external"=>false, "profileLabel"=>"suse_real_key", "name"=>"suse_real_key", "checksum"=>"", "files"=>[], "id"=>8, "arch"=>"x86_64", "enhancementErrata"=>0}
Image Details: {"outdatedPackages"=>0, "buildServerId"=>1000010004, "obsolete"=>false, "bugErrata"=>0, "installedPackages"=>160, "type"=>"dockerfile", "inspectStatus"=>"completed", "version"=>"GUI_BUILT_IMAGE", "storeLabel"=>"galaxy-registry", "revision"=>1, "securityErrata"=>0, "buildStatus"=>"completed", "external"=>false, "profileLabel"=>"suse_real_key", "name"=>"suse_real_key", "checksum"=>"26a421e2b48b4db40959241ad946edfa25c6f1352d85341d6c497ab90e26d22a", "files"=>[], "id"=>8, "arch"=>"x86_64", "enhancementErrata"=>0}

When I follow the left menu "Images > Build" 82ms

And I select "suse_real_key" from "profileId" 1s 144ms

And I enter "GUI_BUILT_IMAGE" as "version" 298ms

And I select the hostname of "build_host" from "buildHostId" 1s 130ms

And I click on "submit-btn" 63ms

And I wait until no Salt job is running on "build_host" 2m 26s 954ms

Then I wait until I see "GUI_BUILT_IMAGE" text 98ms

And I wait at most 900 seconds until image "suse_real_key" with version "GUI_BUILT_IMAGE" is built successfully via API 5s 774ms

And I wait at most 300 seconds until image "suse_real_key" with version "GUI_BUILT_IMAGE" is inspected successfully via API 1m 473ms

List of images: [{"external"=>false, "name"=>"suse_key", "checksum"=>"", "obsolete"=>false, "id"=>1, "arch"=>"x86_64-redhat-linux", "type"=>"dockerfile", "version"=>"latest", "storeLabel"=>"galaxy-registry", "revision"=>0}, {"external"=>false, "name"=>"suse_simple", "checksum"=>"", "obsolete"=>false, "id"=>2, "arch"=>"x86_64-redhat-linux", "type"=>"dockerfile", "version"=>"latest", "storeLabel"=>"galaxy-registry", "revision"=>0}, {"external"=>false, "name"=>"suse_real_key", "checksum"=>"ab6e2a89fa18f8238659c9ae840d0eab861c13712f63e2bc38405d7ebf27e217", "obsolete"=>false, "id"=>3, "arch"=>"x86_64-redhat-linux", "type"=>"dockerfile", "version"=>"latest", "storeLabel"=>"galaxy-registry", "revision"=>1}, {"external"=>false, "name"=>"suse_simple", "checksum"=>"", "obsolete"=>false, "id"=>6, "arch"=>"x86_64-redhat-linux", "type"=>"dockerfile", "version"=>"Latest_simple", "storeLabel"=>"galaxy-registry", "revision"=>0}, {"external"=>false, "name"=>"suse_key", "checksum"=>"", "obsolete"=>false, "id"=>7, "arch"=>"x86_64-redhat-linux", "type"=>"dockerfile", "version"=>"Latest_key-activation1", "storeLabel"=>"galaxy-registry", "revision"=>0}, {"external"=>false, "name"=>"suse_real_key", "checksum"=>"26a421e2b48b4db40959241ad946edfa25c6f1352d85341d6c497ab90e26d22a", "obsolete"=>false, "id"=>8, "arch"=>"x86_64-redhat-linux", "type"=>"dockerfile", "version"=>"GUI_BUILT_IMAGE", "storeLabel"=>"galaxy-registry", "revision"=>1}, {"external"=>false, "name"=>"suse_real_key", "checksum"=>"", "obsolete"=>false, "id"=>9, "arch"=>"x86_64-redhat-linux", "type"=>"dockerfile", "version"=>"GUI_DOCKERADMIN", "storeLabel"=>"galaxy-registry", "revision"=>0}]
Image Details: {"outdatedPackages"=>0, "buildServerId"=>1000010004, "obsolete"=>false, "bugErrata"=>0, "installedPackages"=>0, "type"=>"dockerfile", "inspectStatus"=>"picked up", "version"=>"GUI_DOCKERADMIN", "storeLabel"=>"galaxy-registry", "revision"=>1, "securityErrata"=>0, "buildStatus"=>"completed", "external"=>false, "profileLabel"=>"suse_real_key", "name"=>"suse_real_key", "checksum"=>"", "files"=>[], "id"=>9, "arch"=>"x86_64", "enhancementErrata"=>0}
List of images: [{"external"=>false, "name"=>"suse_key", "checksum"=>"", "obsolete"=>false, "id"=>1, "arch"=>"x86_64-redhat-linux", "type"=>"dockerfile", "version"=>"latest", "storeLabel"=>"galaxy-registry", "revision"=>0}, {"external"=>false, "name"=>"suse_simple", "checksum"=>"", "obsolete"=>false, "id"=>2, "arch"=>"x86_64-redhat-linux", "type"=>"dockerfile", "version"=>"latest", "storeLabel"=>"galaxy-registry", "revision"=>0}, {"external"=>false, "name"=>"suse_real_key", "checksum"=>"ab6e2a89fa18f8238659c9ae840d0eab861c13712f63e2bc38405d7ebf27e217", "obsolete"=>false, "id"=>3, "arch"=>"x86_64-redhat-linux", "type"=>"dockerfile", "version"=>"latest", "storeLabel"=>"galaxy-registry", "revision"=>1}, {"external"=>false, "name"=>"suse_simple", "checksum"=>"", "obsolete"=>false, "id"=>6, "arch"=>"x86_64-redhat-linux", "type"=>"dockerfile", "version"=>"Latest_simple", "storeLabel"=>"galaxy-registry", "revision"=>0}, {"external"=>false, "name"=>"suse_key", "checksum"=>"", "obsolete"=>false, "id"=>7, "arch"=>"x86_64-redhat-linux", "type"=>"dockerfile", "version"=>"Latest_key-activation1", "storeLabel"=>"galaxy-registry", "revision"=>0}, {"external"=>false, "name"=>"suse_real_key", "checksum"=>"26a421e2b48b4db40959241ad946edfa25c6f1352d85341d6c497ab90e26d22a", "obsolete"=>false, "id"=>8, "arch"=>"x86_64-redhat-linux", "type"=>"dockerfile", "version"=>"GUI_BUILT_IMAGE", "storeLabel"=>"galaxy-registry", "revision"=>1}, {"external"=>false, "name"=>"suse_real_key", "checksum"=>"", "obsolete"=>false, "id"=>9, "arch"=>"x86_64-redhat-linux", "type"=>"dockerfile", "version"=>"GUI_DOCKERADMIN", "storeLabel"=>"galaxy-registry", "revision"=>1}]
Image Details: {"outdatedPackages"=>0, "buildServerId"=>1000010004, "obsolete"=>false, "bugErrata"=>0, "installedPackages"=>0, "type"=>"dockerfile", "inspectStatus"=>"picked up", "version"=>"GUI_DOCKERADMIN", "storeLabel"=>"galaxy-registry", "revision"=>1, "securityErrata"=>0, "buildStatus"=>"completed", "external"=>false, "profileLabel"=>"suse_real_key", "name"=>"suse_real_key", "checksum"=>"", "files"=>[], "id"=>9, "arch"=>"x86_64", "enhancementErrata"=>0}
Image Details: {"outdatedPackages"=>0, "buildServerId"=>1000010004, "obsolete"=>false, "bugErrata"=>0, "installedPackages"=>160, "type"=>"dockerfile", "inspectStatus"=>"completed", "version"=>"GUI_DOCKERADMIN", "storeLabel"=>"galaxy-registry", "revision"=>1, "securityErrata"=>0, "buildStatus"=>"completed", "external"=>false, "profileLabel"=>"suse_real_key", "name"=>"suse_real_key", "checksum"=>"568de084d049ad511011bee71fa334891a331358f5598e09ffd7bbf4d1982693", "files"=>[], "id"=>9, "arch"=>"x86_64", "enhancementErrata"=>0}

Given I am authorized as "docker" with password "docker" 1s 541ms

When I follow the left menu "Images > Build" 123ms

And I select "suse_real_key" from "profileId" 1s 122ms

And I enter "GUI_DOCKERADMIN" as "version" 263ms

And I select the hostname of "build_host" from "buildHostId" 1s 122ms

And I click on "submit-btn" 54ms

And I wait until no Salt job is running on "build_host" 2m 17s 753ms

Then I wait until I see "GUI_DOCKERADMIN" text 97ms

And I wait at most 900 seconds until image "suse_real_key" with version "GUI_DOCKERADMIN" is built successfully via API 5s 377ms

And I wait at most 300 seconds until image "suse_real_key" with version "GUI_DOCKERADMIN" is inspected successfully via API 1m 7s 755ms

When I follow the left menu "Audit > CVE Audit" 123ms

And I select "1999" from "cveIdentifierYear" 102ms

And I enter "9999" as "cveIdentifierId" 62ms

And I click on "Audit Images" 66ms

Then I should see a "No action required" text 551ms

When I follow the left menu "Audit > CVE Audit" 65ms

And I select "2012" from "cveIdentifierYear" 58ms

And I enter "2806" as "cveIdentifierId" 58ms

And I click on "Audit Images" 52ms

Then I should see a "The specified CVE number was not found" text 176ms

Given I am authorized as "admin" with password "admin" 1s 176ms

When I delete the image "suse_key" with version "latest" via API calls 1s 205ms

And I delete the image "suse_key" with version "Latest_key-activation1" via API calls 701ms

And I delete the image "suse_real_key" with version "latest" via API calls 710ms

And I delete the image "suse_real_key" with version "GUI_BUILT_IMAGE" via API calls 706ms

And I delete the image "suse_real_key" with version "GUI_DOCKERADMIN" via API calls 742ms

Given I am authorized as "admin" with password "admin" 457ms

When I delete the image "suse_simple" with version "latest" via API calls 1s 249ms

And I delete the image "suse_simple" with version "Latest_simple" via API calls 706ms

When I follow the left menu "Images > Profiles" 124ms

And I check "suse_key" in the list 202ms

And I check "suse_real_key" in the list 61ms

And I click on "Delete" 78ms

And I should see a "Are you sure you want to delete selected profiles?" text 76ms

And I click on the red confirmation button 70ms

And I wait until I see "Image profiles have been deleted" text 186ms

When I follow the left menu "Images > Profiles" 62ms

And I check "suse_simple" in the list 214ms

And I check "suse_real_simple" in the list 60ms

And I click on "Delete" 61ms

And I should see a "Are you sure you want to delete selected profiles?" text 70ms

And I click on the red confirmation button 63ms

And I wait until I see "Image profiles have been deleted" text 175ms

When I wait until no Salt job is running on "build_host" 2s 47ms

@skip_if_github_validation @build_host @scope_building_container_images @auth_registry
Feature:Build image with authenticated registry 2m 39s 491ms 2 6

Given I am authorized as "docker" with password "docker" 1s 592ms

When I follow the left menu "Images > Stores" 123ms

And I follow "Create" 297ms

And I enter "auth_registry" as "label" 95ms

And I check "useCredentials" 10s 85ms Show Error +
                                            
Checkbox useCredentials not checked. (ScriptError) ./features/step_definitions/navigation_steps.rb:179:in `/^I check "([^"]*)"$/' features/secondary/buildhost_docker_auth_registry.feature:20:in `I check "useCredentials"'

And I enter URI, username and password for registry 0s

And I click on "create-btn" 0s

Then I wait until I see "registry" text 0s

17s 241ms Show Info +
18:16:45:000 - 18:16:56:000 | Current URL: https://uyuni-master-server.sumaci.aws/rhn/manager/cm/imagestores/create
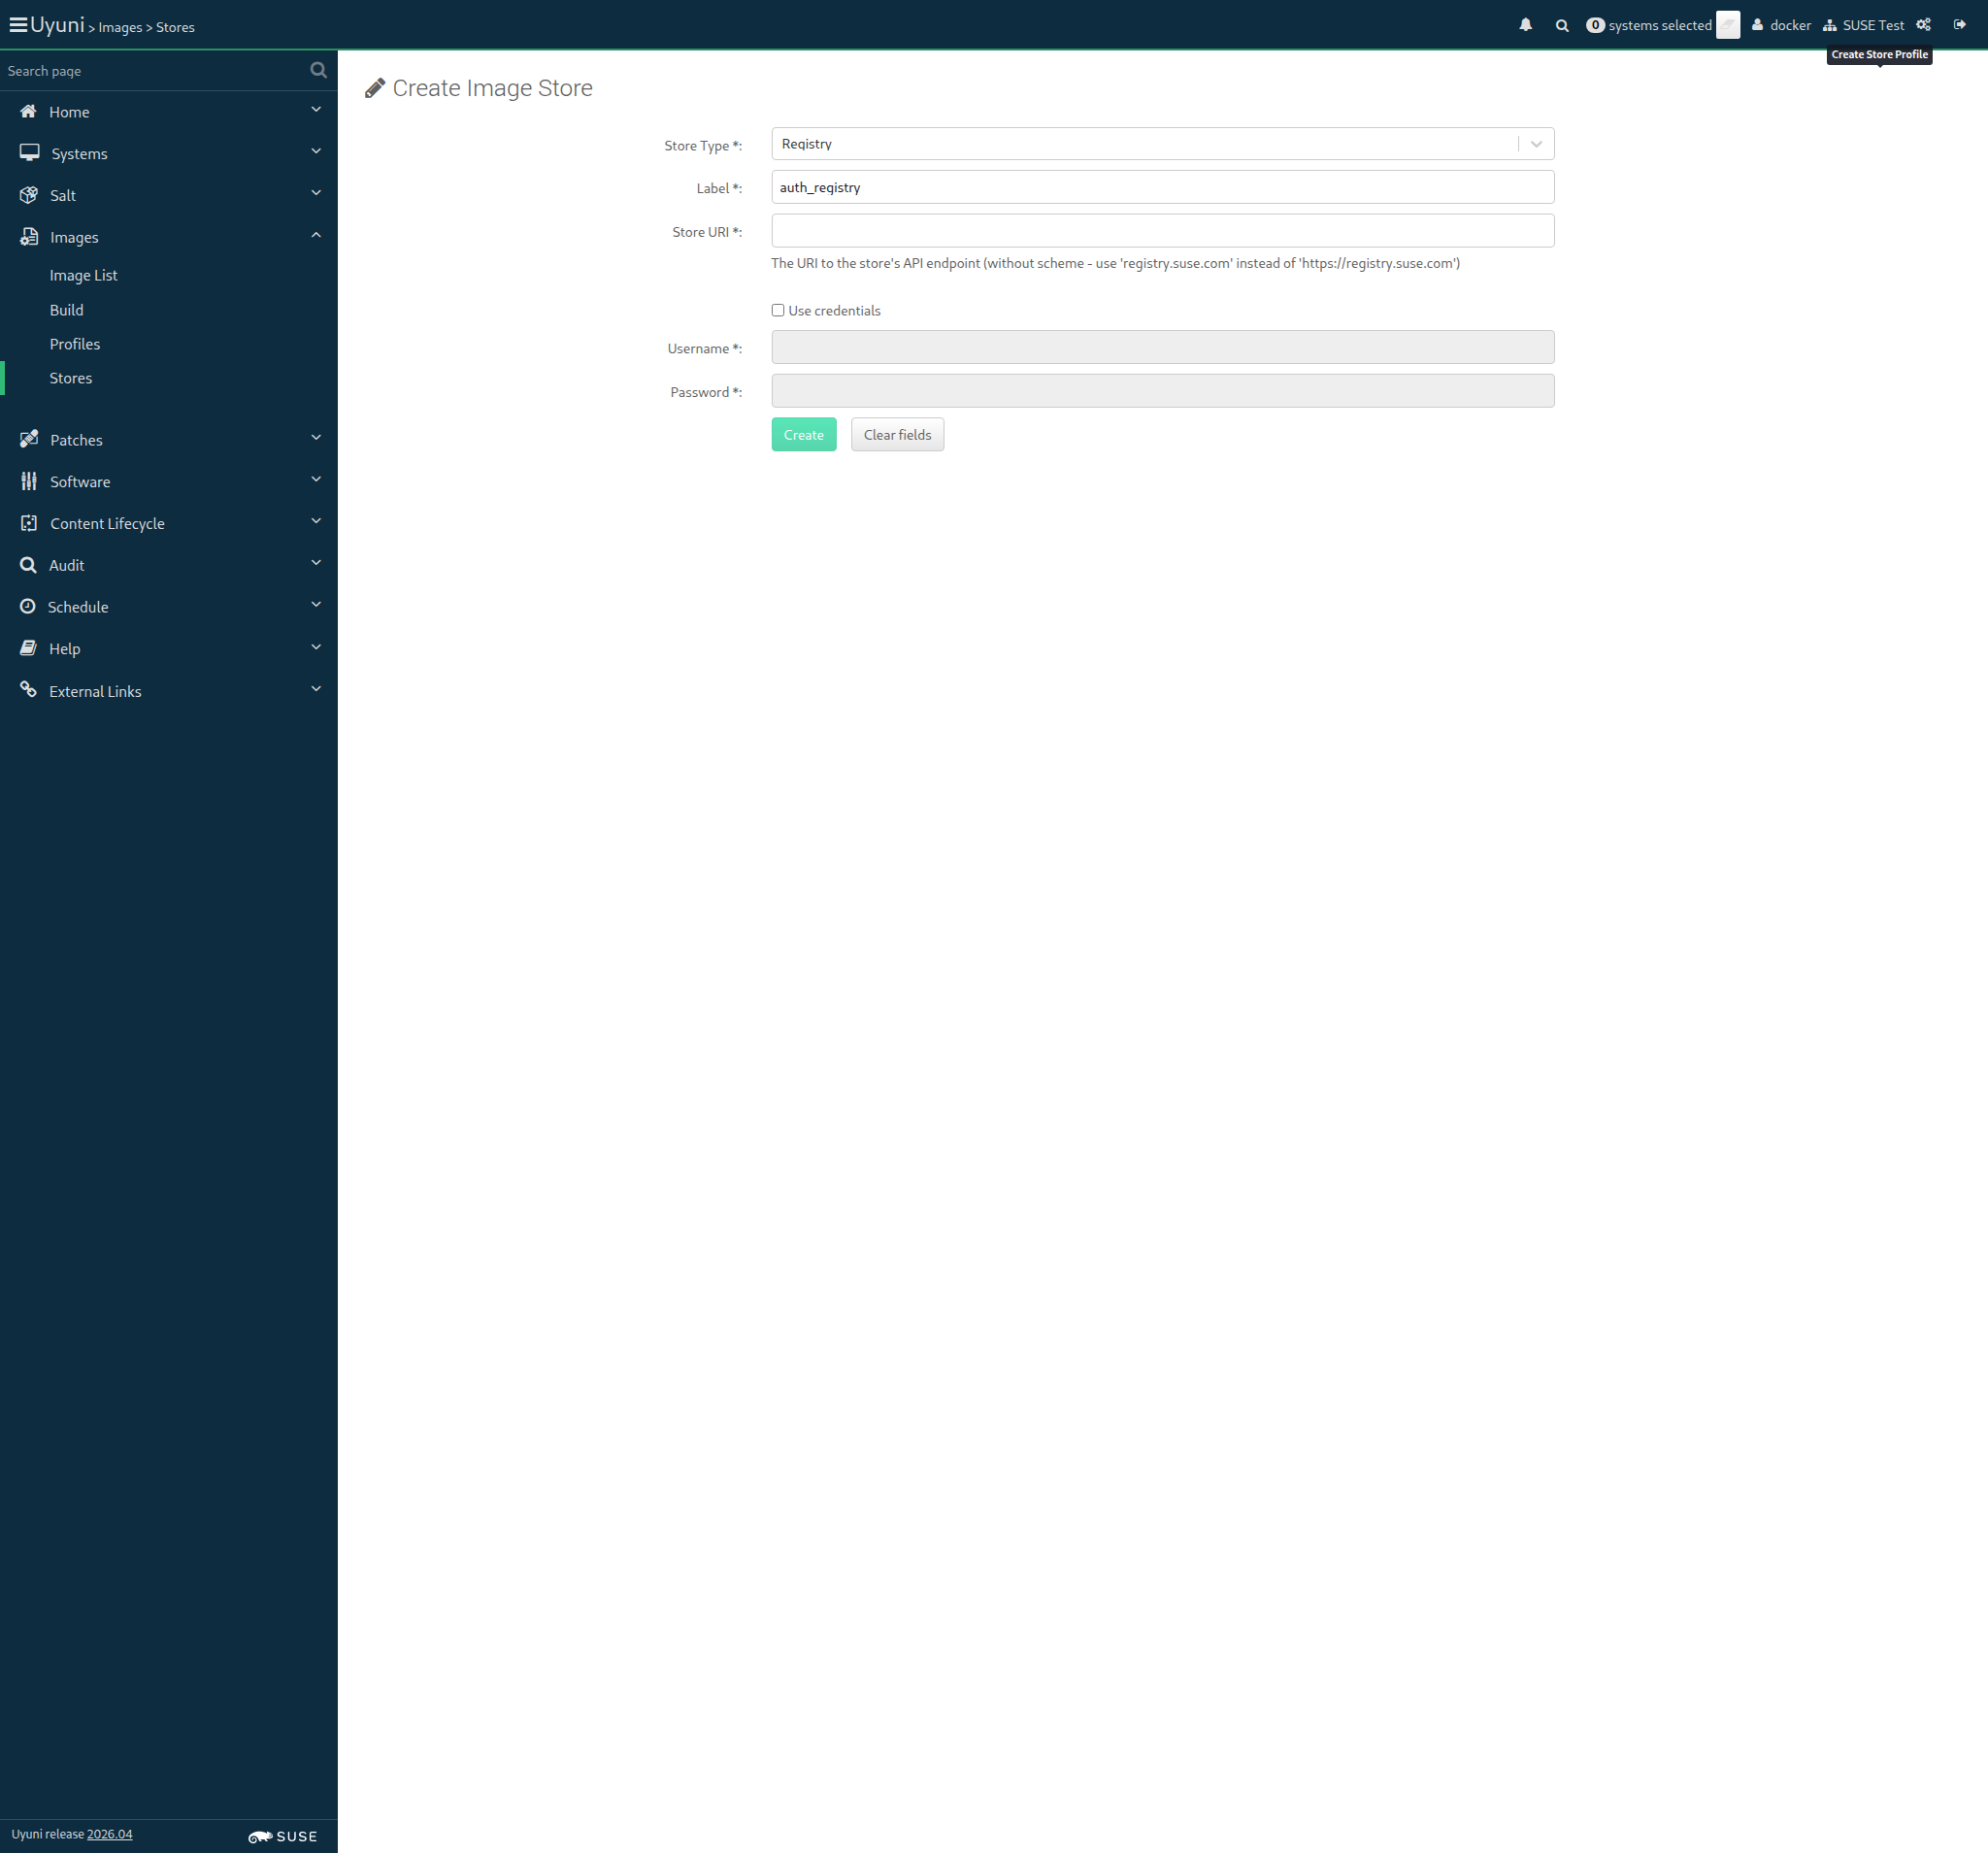
Screenshot +


When I follow the left menu "Images > Profiles" 64ms

And I follow "Create" 328ms

And I enter "auth_registry_profile" as "label" 138ms

And I select "auth_registry" from "imageStore" 11s 68ms Show Error +
                                            
Unable to find xpath ".//*[contains(@class, 'data-testid-imageStore-child__option') and contains(., 'auth_registry')]" (Capybara::ElementNotFound) ./features/step_definitions/navigation_steps.rb:212:in `/^I select "([^"]*)" from "([^"]*)"$/' features/secondary/buildhost_docker_auth_registry.feature:30:in `I select "auth_registry" from "imageStore"'

And I select "1-SUSE-KEY-x86_64" from "activationKey" 0s

And I enter "Docker/authprofile" relative to profiles as "path" 0s

And I click on "create-btn" 0s

Then I wait until I see "auth_registry_profile" text 0s

17s 559ms Show Info +
18:17:14:000 - 18:17:26:000 | Current URL: https://uyuni-master-server.sumaci.aws/rhn/manager/cm/imageprofiles/create
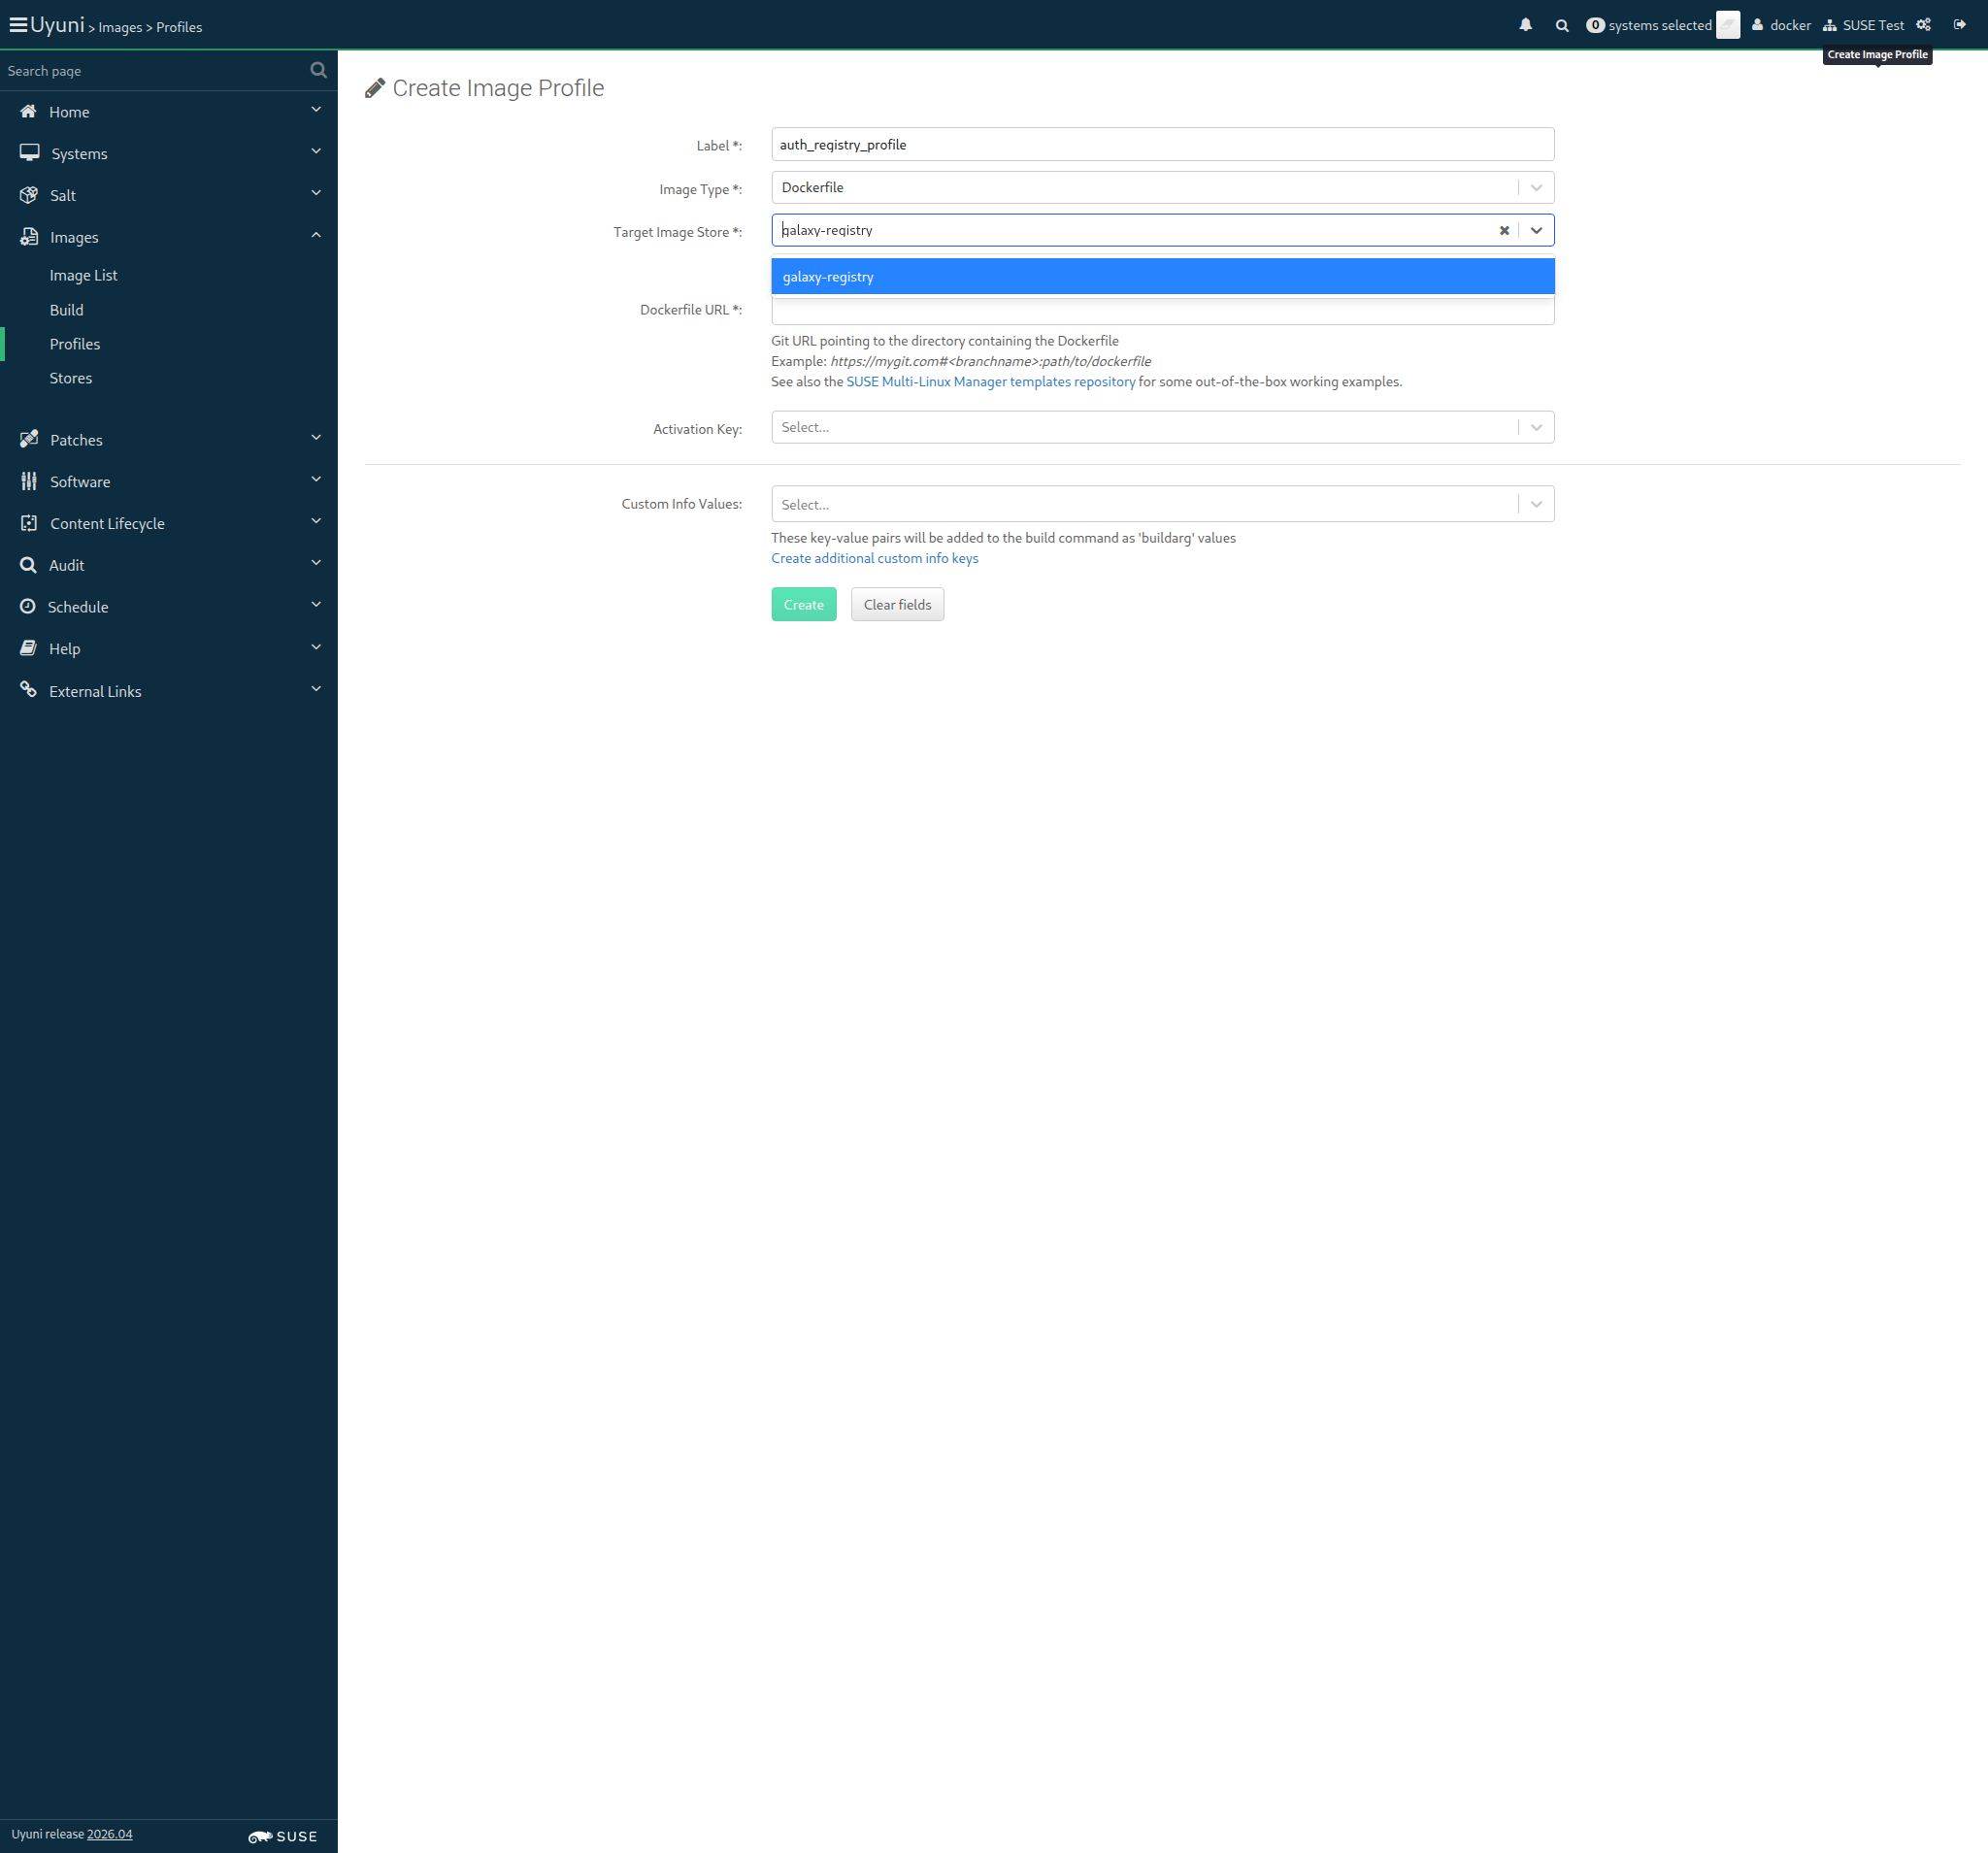
Screenshot +


When I follow the left menu "Images > Build" 71ms

And I select "auth_registry_profile" from "profileId" 11s 74ms Show Error +
                                            
Unable to find xpath ".//*[contains(@class, 'data-testid-profileId-child__option') and contains(., 'auth_registry_profile')]" (Capybara::ElementNotFound) ./features/step_definitions/navigation_steps.rb:212:in `/^I select "([^"]*)" from "([^"]*)"$/' features/secondary/buildhost_docker_auth_registry.feature:39:in `I select "auth_registry_profile" from "profileId"'

And I enter "latest" as "version" 0s

And I select the hostname of "build_host" from "buildHostId" 0s

And I click on "submit-btn" 0s

Then I wait until I see "auth_registry_profile" text 0s

When I wait at most 900 seconds until image "auth_registry_profile" with version "latest" is built successfully via API 0s

And I wait at most 300 seconds until image "auth_registry_profile" with version "latest" is inspected successfully via API 0s

And I wait until no Salt job is running on "build_host" 0s

And I refresh the page 0s

Then table row for "auth_registry_profile" should contain "1" 0s

17s 302ms Show Info +
18:17:43:000 - 18:17:54:000 | Current URL: https://uyuni-master-server.sumaci.aws/rhn/manager/cm/build
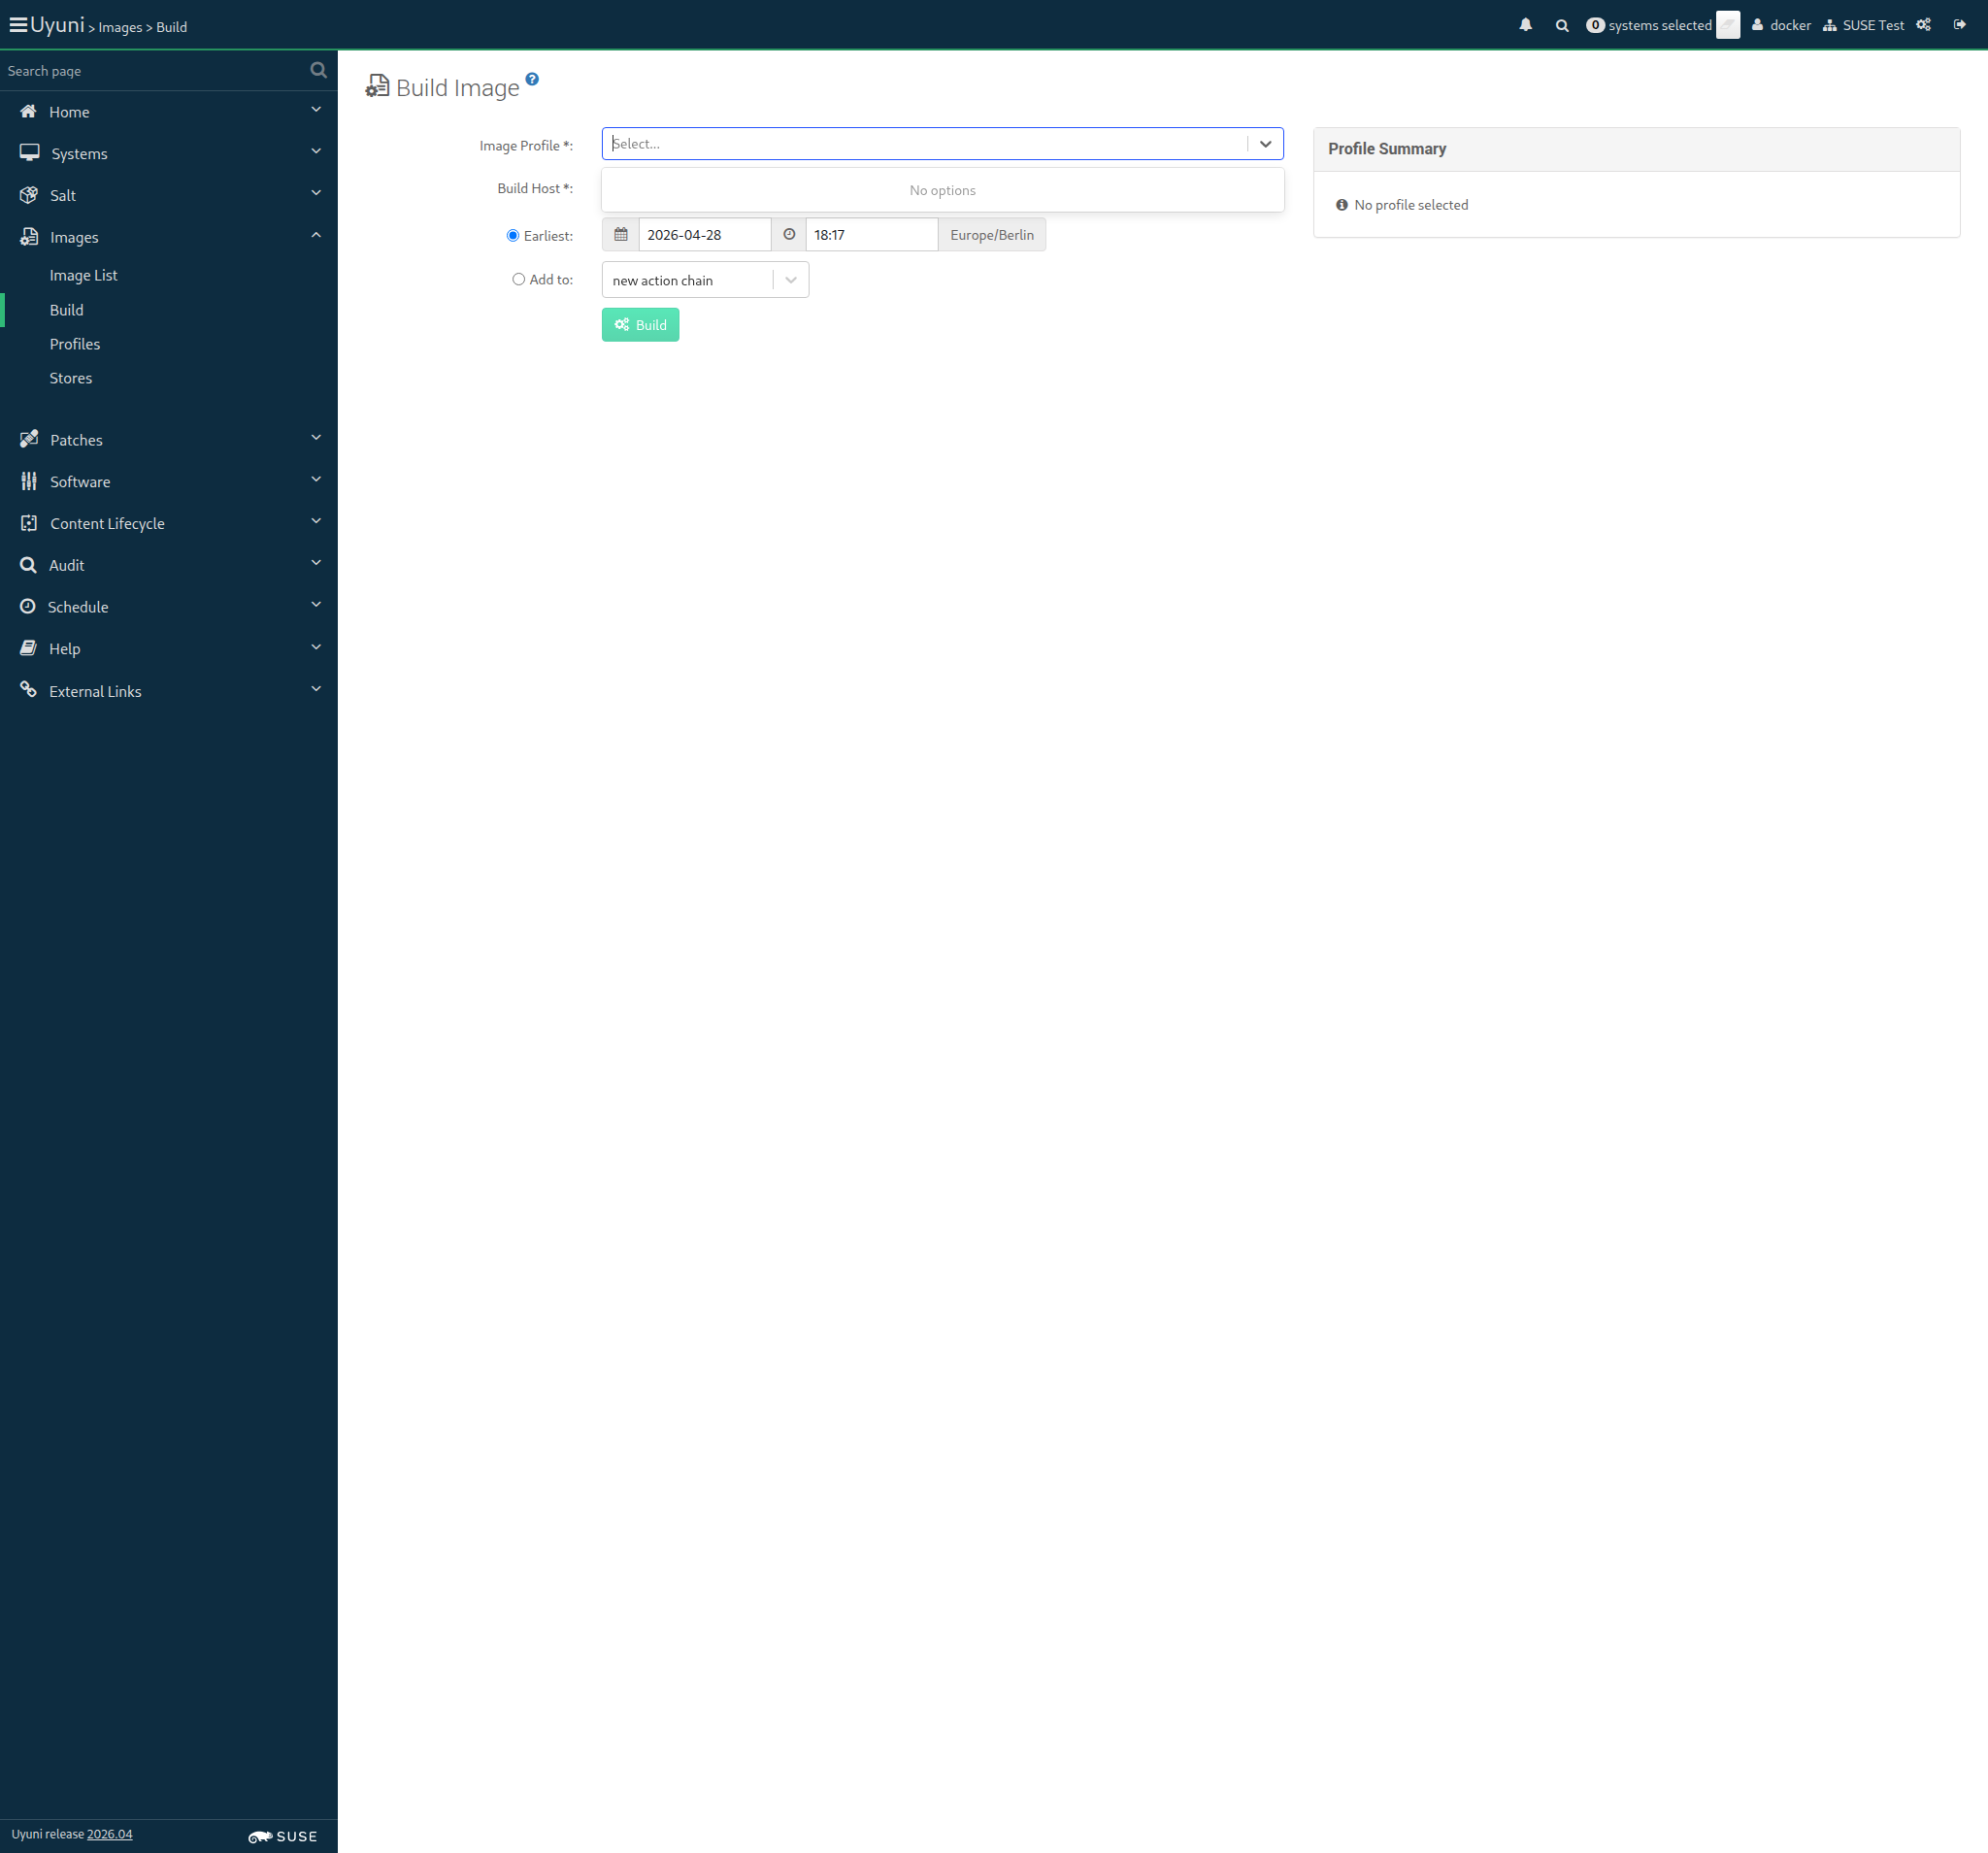
Screenshot +


List of images: []

And the list of packages of image "auth_registry_profile" with version "latest" is not empty 179ms Show Error +
                                            
unable to find the image id (ScriptError) ./features/step_definitions/docker_steps.rb:139:in `/^the list of packages of image "([^"]*)" with version "([^"]*)" is not empty$/' features/secondary/buildhost_docker_auth_registry.feature:53:in `the list of packages of image "auth_registry_profile" with version "latest" is not empty'

17s 305ms Show Info +
18:18:12:000 - 18:18:12:000 | Current URL: https://uyuni-master-server.sumaci.aws/rhn/manager/cm/build
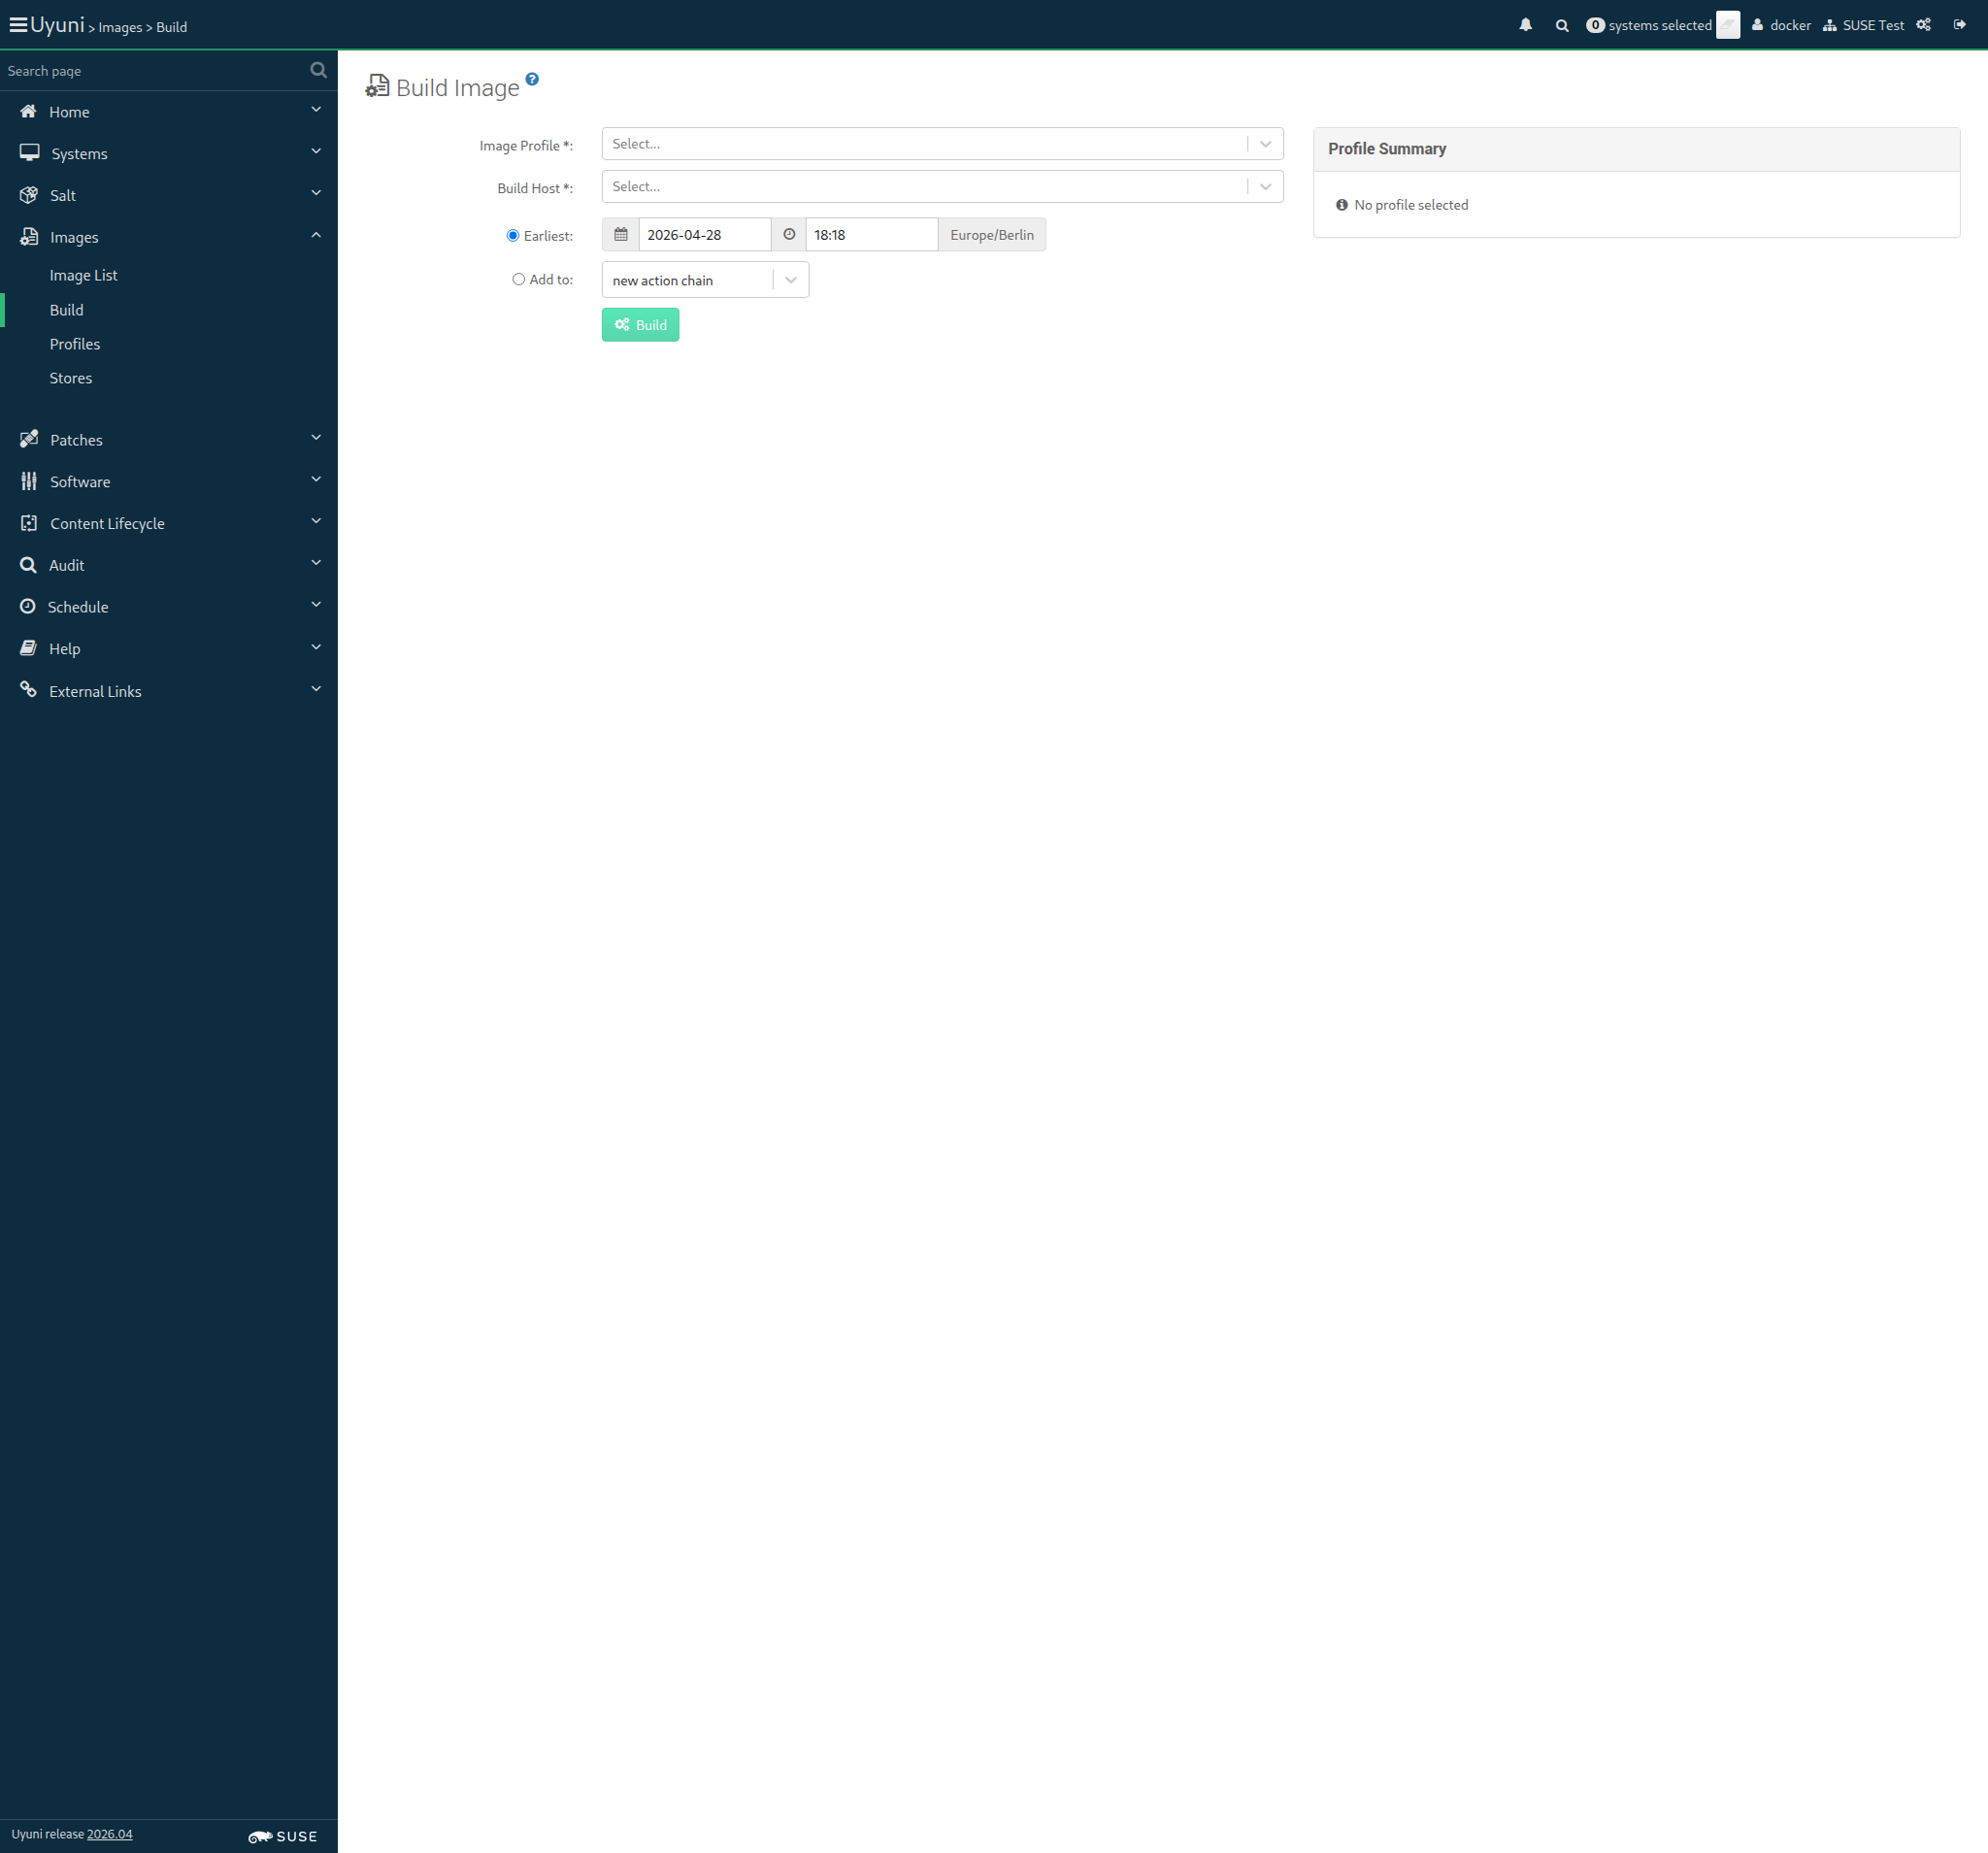
Screenshot +


When I follow the left menu "Images > Profiles" 80ms

And I check the row with the "auth_registry_profile" text 10s 7ms Show Error +
                                            
Unable to find xpath "//table/tbody/tr[.//td[contains(.,'auth_registry_profile')]]//input[@type='checkbox']" (Capybara::ElementNotFound) ./features/support/navigation_step_helper.rb:32:in `toggle_checkbox_in_list' ./features/step_definitions/navigation_steps.rb:902:in `/^I check the row with the "([^"]*)" text$/' features/secondary/buildhost_docker_auth_registry.feature:58:in `I check the row with the "auth_registry_profile" text'

And I click on "Delete" 0s

And I click on the red confirmation button 0s

And I should see a "Image profile has been deleted." text 0s

And I wait until no Salt job is running on "build_host" 0s

17s 292ms Show Info +
18:18:29:000 - 18:18:40:000 | Current URL: https://uyuni-master-server.sumaci.aws/rhn/manager/cm/imageprofiles
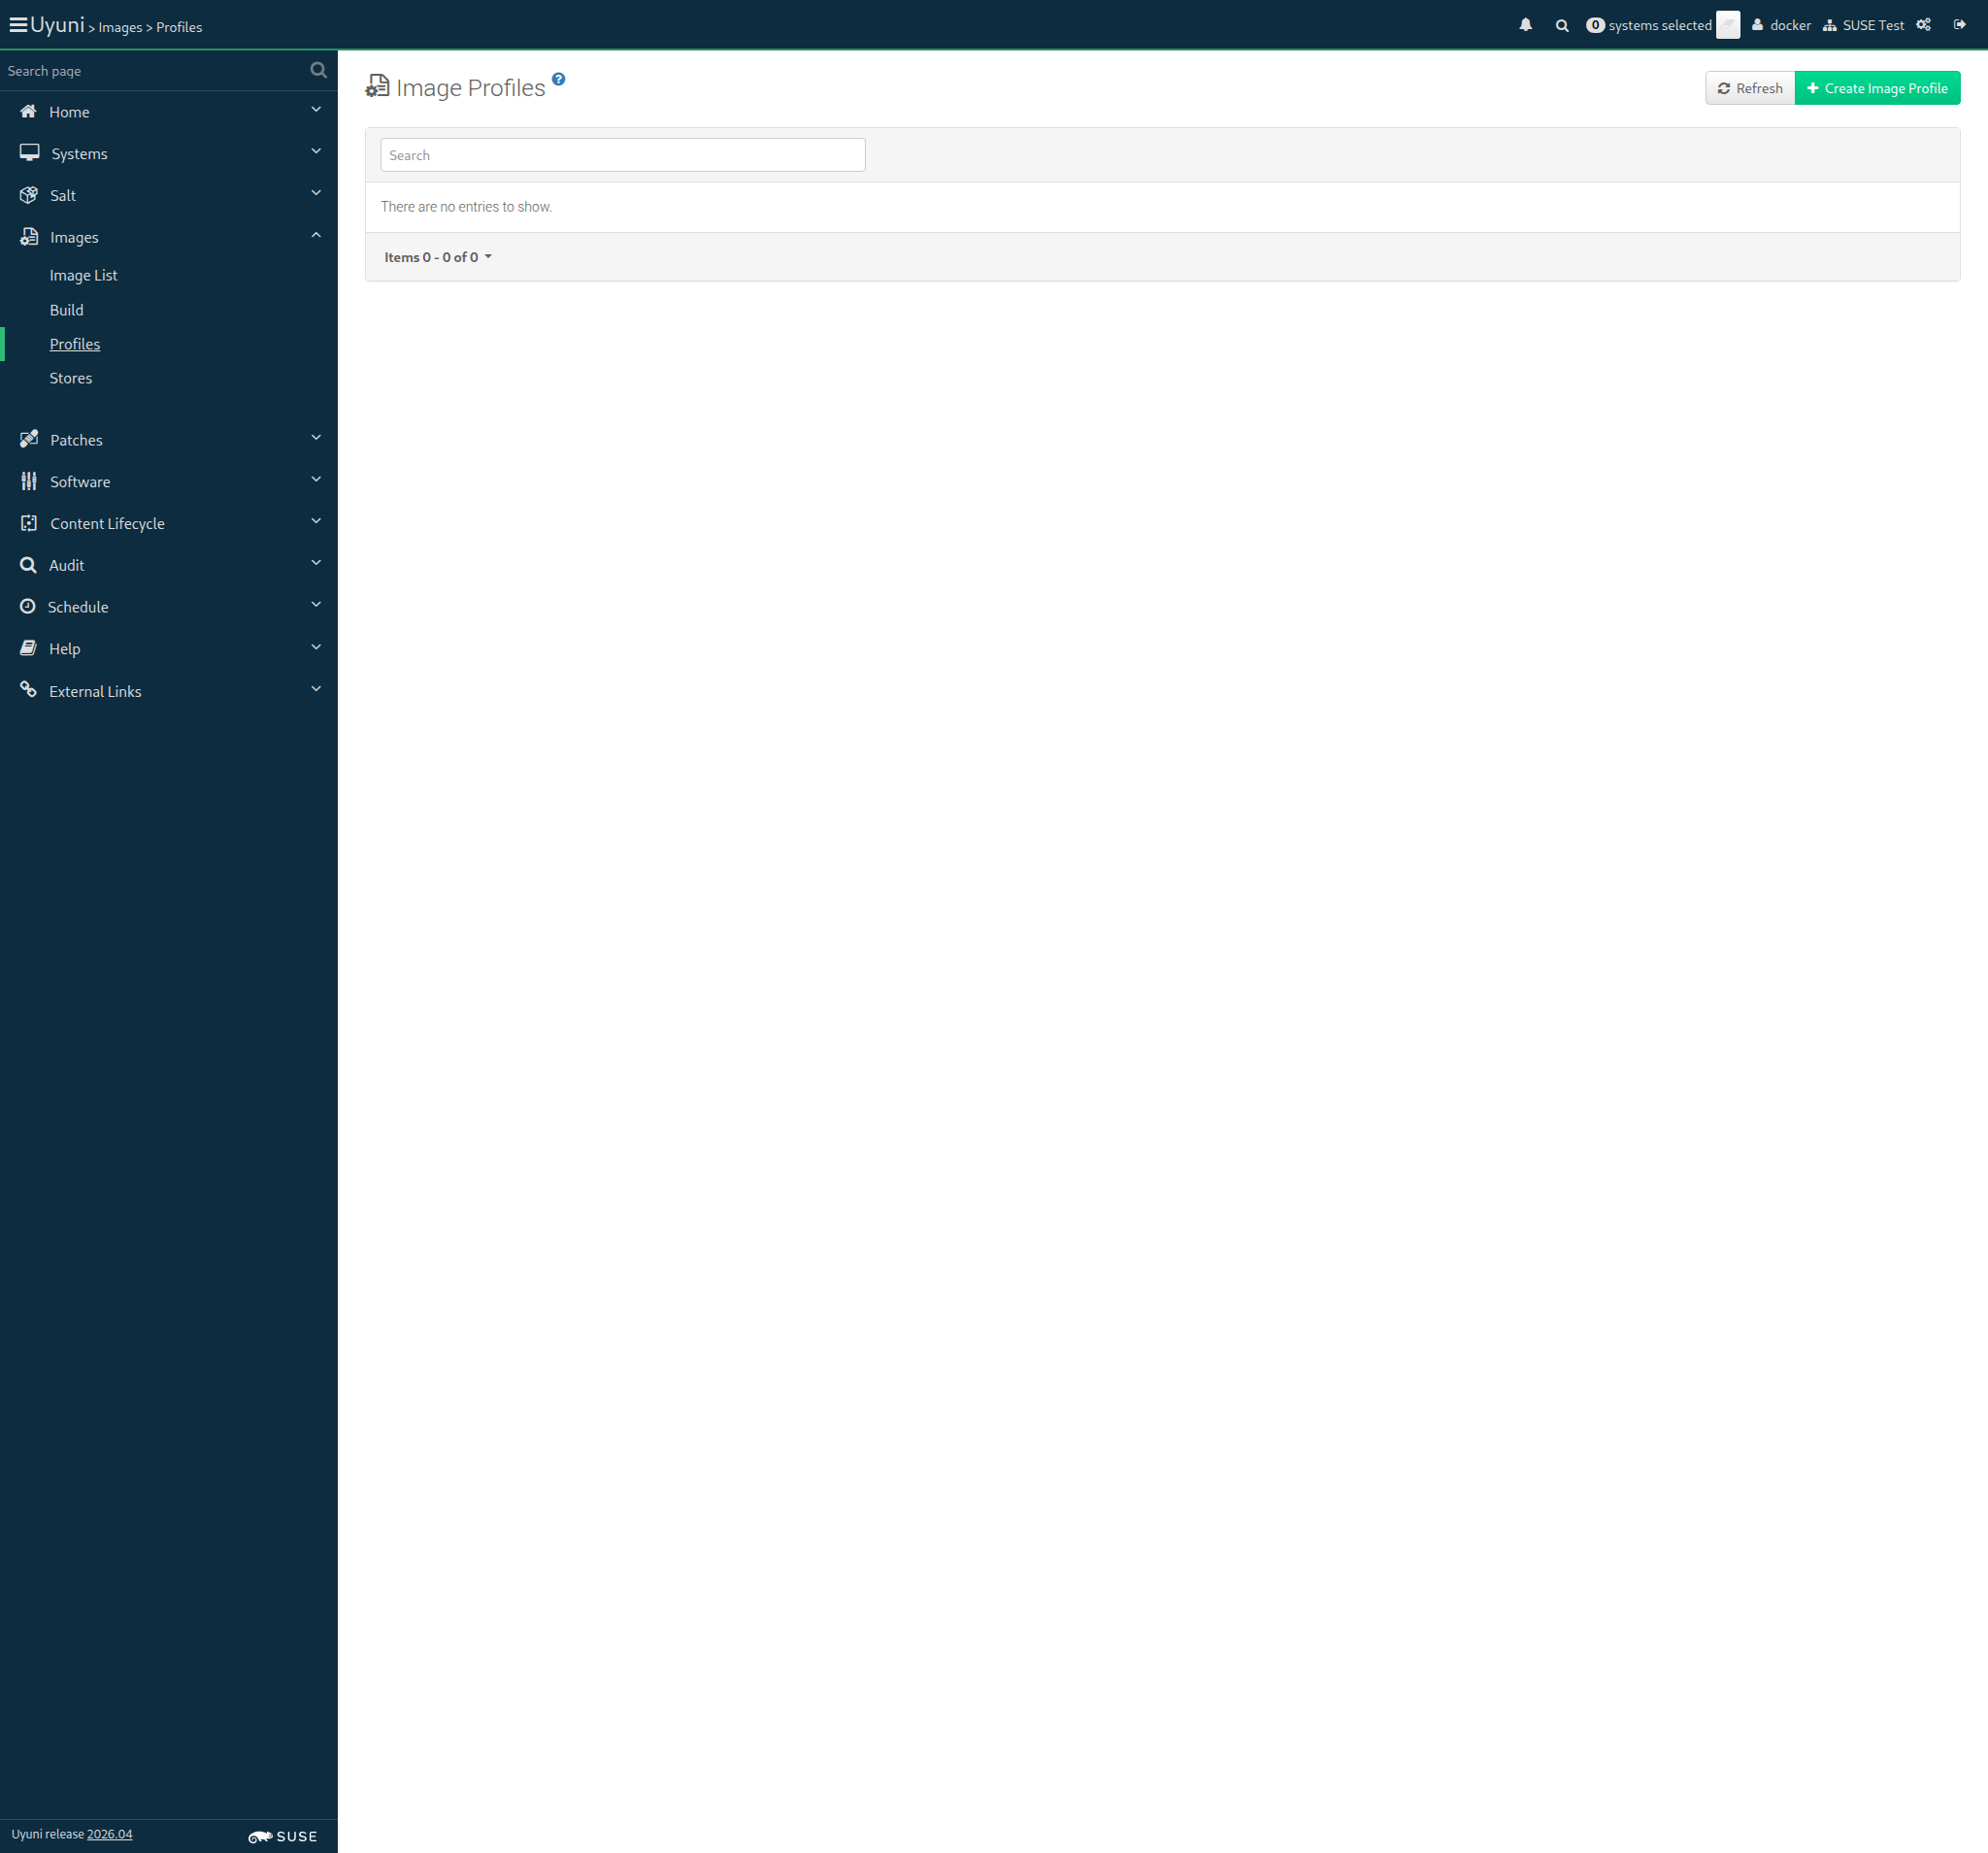
Screenshot +


When I follow the left menu "Images > Stores" 68ms

And I check the row with the "auth_registry" text 10s Show Error +
                                            
Unable to find xpath "//table/tbody/tr[.//td[contains(.,'auth_registry')]]//input[@type='checkbox']" (Capybara::ElementNotFound) ./features/support/navigation_step_helper.rb:32:in `toggle_checkbox_in_list' ./features/step_definitions/navigation_steps.rb:902:in `/^I check the row with the "([^"]*)" text$/' features/secondary/buildhost_docker_auth_registry.feature:66:in `I check the row with the "auth_registry" text'

And I click on "Delete" 0s

And I click on the red confirmation button 0s

And I should see a "Image store has been deleted." text 0s

17s 339ms Show Info +
18:18:57:000 - 18:19:07:000 | Current URL: https://uyuni-master-server.sumaci.aws/rhn/manager/cm/imagestores
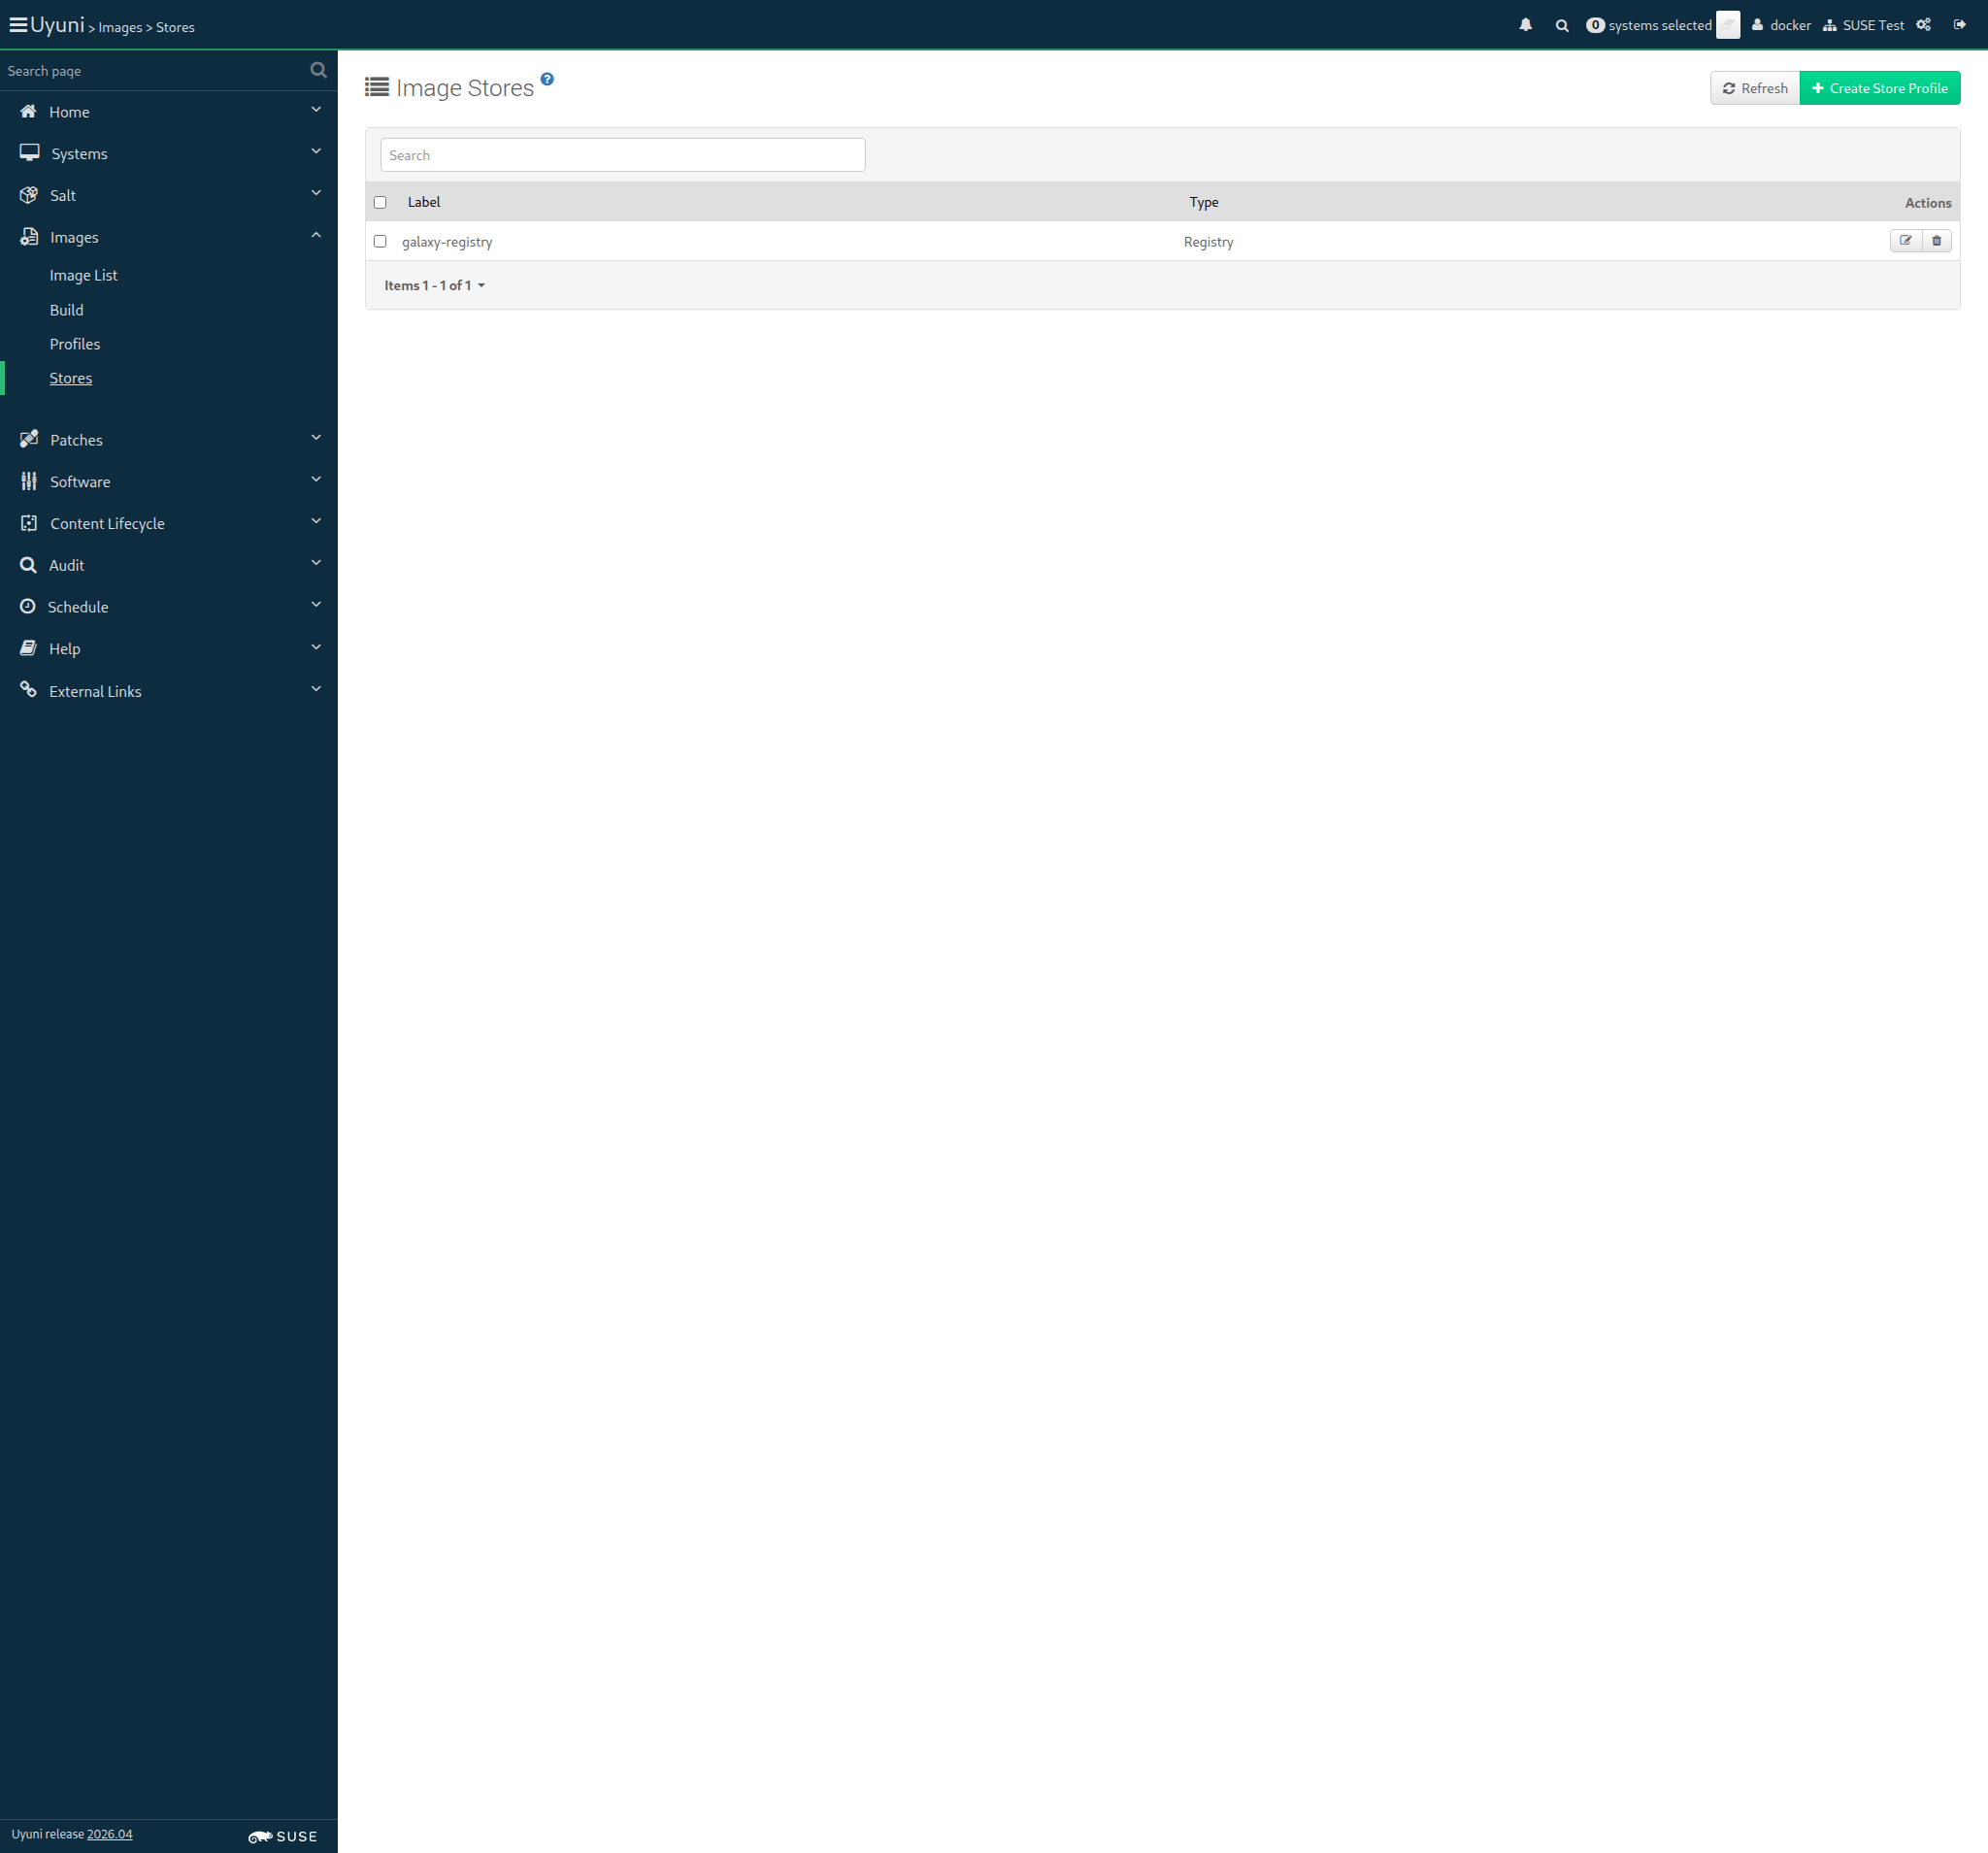
Screenshot +


Image auth_registry_profile with version latest does not exist, skipping

When I delete the image "auth_registry_profile" with version "latest" via API calls 175ms

Given I am authorized 1s 293ms

Given I navigate to the Systems overview page of this "sle_minion" 2s 472ms

When I follow "Hardware" 482ms

And I click on "Schedule Hardware Refresh" 732ms

Then I should see a "You have successfully scheduled a hardware profile refresh" text 122ms

When I wait until event "Hardware List Refresh scheduled" is completed 18s 738ms

And I wait until there is no Salt job calling the module "hardware.profileupdate" on "sle_minion" 2s 125ms

I should see kernel version: 6.19.11-1-default
IPv4 address: 172.16.3.8
IPv6 address: fe80::4b1:c6ff:fee9:486f

Given I am on the Systems overview page of this "sle_minion" 929ms

Then the hostname for "sle_minion" should be correct 93ms

And the kernel for "sle_minion" should be correct 494ms

And the OS version for "sle_minion" should be correct < 1ms

And the IPv4 address for "sle_minion" should be correct 89ms

And the IPv6 address for "sle_minion" should be correct 423ms

And the system ID for "sle_minion" should be correct 507ms

And the system name for "sle_minion" should be correct 82ms

And the uptime for "sle_minion" should be correct 417ms

And I should see a "UUID" text 79ms

And I should see a "Virtualization" text 85ms

And I should see a "Installed Products" text 91ms

And I should see a "Checked In" text 85ms

And I should see a "Registered" text 81ms

And I should see a "Contact Method" text 81ms

And I should see a "Auto Patch Update" text 90ms

And I should see a "Maintenance Schedule" text 80ms

And I should see a "Description" text 81ms

And I should see a "Location" text 81ms

Given I am on the Systems overview page of this "rhlike_minion" 994ms

When I follow "Hardware" 485ms

And I click on "Schedule Hardware Refresh" 776ms

Then I should see a "You have successfully scheduled a hardware profile refresh" text 116ms

When I wait until event "Hardware List Refresh scheduled" is completed 21s 932ms

And I wait until there is no Salt job calling the module "hardware.profileupdate" on "rhlike_minion" 1s 601ms

I should see kernel version: 4.18.0-553.el8_10.x86_64
IPv4 address: 172.16.3.10
IPv6 address: fe80::4d5:ddff:fe2a:fad5

Given I am on the Systems overview page of this "rhlike_minion" 893ms

Then the hostname for "rhlike_minion" should be correct 94ms

And the kernel for "rhlike_minion" should be correct 269ms

And the OS version for "rhlike_minion" should be correct < 1ms

And the IPv4 address for "rhlike_minion" should be correct 83ms

And the IPv6 address for "rhlike_minion" should be correct 189ms

And the system ID for "rhlike_minion" should be correct 544ms

And the system name for "rhlike_minion" should be correct 83ms

And the uptime for "rhlike_minion" should be correct 194ms

And I should see a "UUID" text 85ms

And I should see a "Virtualization" text 86ms

And I should see a "Installed Products" text 81ms

And I should see a "Checked In" text 83ms

And I should see a "Registered" text 86ms

And I should see a "Contact Method" text 84ms

And I should see a "Auto Patch Update" text 80ms

And I should see a "Maintenance Schedule" text 82ms

And I should see a "Description" text 84ms

And I should see a "Location" text 86ms

Given I am on the Systems overview page of this "deblike_minion" 1s

When I follow "Hardware" 624ms

And I click on "Schedule Hardware Refresh" 782ms

Then I should see a "You have successfully scheduled a hardware profile refresh" text 118ms

When I wait until event "Hardware List Refresh scheduled" is completed 22s 163ms

And I wait until there is no Salt job calling the module "hardware.profileupdate" on "deblike_minion" 2s 245ms

I should see kernel version: 6.17.0-1012-aws
IPv4 address: 172.16.3.11
IPv6 address: fe80::45e:d7ff:fe79:6fdf

Given I am on the Systems overview page of this "deblike_minion" 934ms

Then the hostname for "deblike_minion" should be correct 91ms

And the kernel for "deblike_minion" should be correct 285ms

And the OS version for "deblike_minion" should be correct < 1ms

And the IPv4 address for "deblike_minion" should be correct 86ms

And the IPv6 address for "deblike_minion" should be correct 214ms

And the system ID for "deblike_minion" should be correct 1s 751ms

And the system name for "deblike_minion" should be correct 96ms

And the uptime for "deblike_minion" should be correct 214ms

And I should see a "UUID" text 78ms

And I should see a "Virtualization" text 79ms

And I should see a "Installed Products" text 78ms

And I should see a "Checked In" text 81ms

And I should see a "Registered" text 78ms

And I should see a "Contact Method" text 78ms

And I should see a "Auto Patch Update" text 83ms

And I should see a "Maintenance Schedule" text 85ms

And I should see a "Description" text 87ms

And I should see a "Location" text 80ms

Given I am on the Systems overview page of this "ssh_minion" 932ms

When I follow "Hardware" 593ms

And I click on "Schedule Hardware Refresh" 905ms

Then I should see a "You have successfully scheduled a hardware profile refresh" text 116ms

And I wait until event "Hardware List Refresh scheduled" is completed 38s 384ms

I should see kernel version: 6.19.11-1-default
IPv4 address: 172.16.3.9
IPv6 address: fe80::411:dbff:fea6:6537

Given I am on the Systems overview page of this "ssh_minion" 961ms

Then the hostname for "ssh_minion" should be correct 98ms

And the kernel for "ssh_minion" should be correct 777ms

And the OS version for "ssh_minion" should be correct < 1ms

And the IPv4 address for "ssh_minion" should be correct 85ms

And the IPv6 address for "ssh_minion" should be correct 410ms

And the system ID for "ssh_minion" should be correct 505ms

And the system name for "ssh_minion" should be correct 97ms

And the uptime for "ssh_minion" should be correct 403ms

And I should see a "UUID" text 81ms

And I should see a "Virtualization" text 81ms

And I should see a "Installed Products" text 81ms

And I should see a "Checked In" text 80ms

And I should see a "Registered" text 84ms

And I should see a "Contact Method" text 81ms

And I should see a "Auto Patch Update" text 80ms

And I should see a "Maintenance Schedule" text 81ms

And I should see a "Description" text 80ms

And I should see a "Location" text 84ms

Given I am authorized for the "Admin" section 443ms

When I enable repository "test_repo_rpm_pool" on this "sle_minion" 746ms

And I refresh the metadata for "sle_minion" 849ms

And I install old package "andromeda-dummy-1.0" on this "sle_minion" 1s 637ms

And I install old package "virgo-dummy-1.0" on this "sle_minion" 1s 622ms

When I follow the left menu "Admin > Task Schedules" 160ms

And I follow "errata-cache-default" 1s 239ms

And I follow "errata-cache-bunch" 1s 295ms

And I click on "Single Run Schedule" 1s 285ms

Then I should see a "bunch was scheduled" text 270ms

And I wait until the table contains "FINISHED" or "SKIPPED" followed by "FINISHED" in its first rows 2s 273ms

When I follow the left menu "Patches > Patch List > Relevant" 214ms

Then I should see an update in the list 77ms

When I wait until I see "andromeda-dummy" text, refreshing the page 240ms

Then I should see a "andromeda-dummy-6789" link 13ms

When I enter "virgo-dummy" as the filtered synopsis 142ms

And I click on the filter button until page does contain "virgo-dummy-3456" text 51s 233ms

Then I should see a "virgo-dummy-3456" link 13ms

When I follow the left menu "Systems > System Groups" 134ms

And I follow "Create Group" 215ms

And I enter "new-systems-group" as "name" 74ms

And I click on "Create Group" 66ms

Then I should see a "Both name and description are required for System Groups." text 61ms

When I follow the left menu "Systems > System Groups" 66ms

And I follow "Create Group" 202ms

And I enter "My new group" as "description" 63ms

And I click on "Create Group" 55ms

Then I should see a "Both name and description are required for System Groups." text 62ms

When I follow the left menu "Systems > System Groups" 67ms

And I follow "Create Group" 276ms

And I enter "new-systems-group" as "name" 62ms

And I enter "My new group" as "description" 55ms

And I click on "Create Group" 393ms

Then I should see a "System group new-systems-group created." text 71ms

When I follow the left menu "Systems > System Groups" 63ms

And I follow "new-systems-group" 310ms

And I follow "Target Systems" 605ms

And I check the "sle_minion" client 62ms

And I click on "Add Systems" 1s 93ms

Then I should see a "1 systems were added to new-systems-group server group." text 99ms

When I click on "Add Selected to SSM" 502ms

Given I am on the Systems overview page of this "sle_minion" 1s 177ms

When I follow "Groups" in the content area 83ms

Then I should see a "new-systems-group" text 73ms

When I follow the left menu "Systems > System Groups" 68ms

And I follow "new-systems-group" 299ms

And I follow first "Patches" 418ms

When I enter "virgo-dummy" as the filtered synopsis 126ms

And I click on the filter button until page does contain "virgo-dummy-3456" text 250ms

Then I should see a "virgo-dummy-3456" link 8ms

When I follow "virgo-dummy-3456" 376ms

And I follow first "Affected Systems" 301ms

And I check the "sle_minion" client 53ms

And I click on "Apply Patches" 499ms

And I click on "Confirm" 62ms

Then I should see a "Patch virgo-dummy-3456 has been scheduled for 1 system" text 862ms

And I am on the Systems overview page of this "sle_minion" 1s 161ms

And I wait until event "Patch Update: virgo-dummy-3456 - Test update for virgo-dummy scheduled by admin" is completed 22s 229ms

When I follow the left menu "Systems > System Set Manager > Overview" 459ms

And I follow first "Patches" 458ms

When I enter "andromeda-dummy" as the filtered synopsis 152ms

And I click on the filter button 456ms

When I wait until I see "andromeda-dummy-6789" text, refreshing the page 70ms

Then I should see a "andromeda-dummy-6789" link 11ms

When I follow "andromeda-dummy-6789" 369ms

And I follow first "Affected Systems" 309ms

And I check the "sle_minion" client 62ms

And I click on "Apply Patches" 433ms

And I click on "Confirm" 65ms

Then I should see a "Patch andromeda-dummy-6789 has been scheduled for 1 system" text 269ms

And I am on the Systems overview page of this "sle_minion" 960ms

And I wait until event "Patch Update: andromeda-dummy-6789 - Test update for andromeda-dummy scheduled by admin" is completed 21s 859ms

When I follow the left menu "Systems > System Groups" 74ms

And I click on "Use in SSM" in row "new-systems-group" 74ms

Then I should see a "Selected Systems List" text 74ms

And I should see "sle_minion" as link 18ms

When I follow the left menu "Systems > System Set Manager > Overview" 79ms

And I follow "Packages" 340ms

And I follow "Remove" 480ms

And I wait until I see "Package Removal" text, refreshing the page 229ms

And I enter "virgo-dummy" as the filtered package name 131ms

And I click on the filter button until page does contain "virgo-dummy-2.0-1.1" text 11s 12ms

And I check "virgo-dummy-2.0-1.1" in the list 64ms

And I click on "Remove Packages" 358ms

And I click on "Confirm" 409ms

Then I should see a "Package removals are being scheduled, it may take several minutes for this to complete." text 64ms

When I follow the left menu "Systems > System Groups" 75ms

And I click on "Use in SSM" in row "new-systems-group" 72ms

Then I should see a "Selected Systems List" text 76ms

And I should see "sle_minion" as link 15ms

When I follow the left menu "Systems > System Set Manager > Overview" 78ms

And I follow "Packages" 344ms

And I follow "Install" 447ms

And I wait until I see "Fake-RPM-SUSE-Channel" text, refreshing the page 67ms

Then I should see a "Fake-RPM-SUSE-Channel" text 64ms

When I follow "Fake-RPM-SUSE-Channel" 402ms

Then I should see a "virgo-dummy-2.0-1.1" text 89ms

And I enter "virgo-dummy" as the filtered package name 54ms

And I click on the filter button until page does contain "virgo-dummy-2.0-1.1" text 89ms

When I check "virgo-dummy-2.0-1.1" in the list 58ms

And I click on "Install Packages" 300ms

And I click on "Confirm" 1s 131ms

Then I should see a "Package installations are being scheduled, it may take several minutes for this to complete." text 78ms

When I follow the left menu "Systems > System Groups" 59ms

Then I should see a "System Groups" text 70ms

When I follow "new-systems-group" 310ms

And I follow "Target Systems" 519ms

Then I should see a "The following are systems that may be added to this group." text 96ms

When I check the "rhlike_minion" client 58ms

And I click on "Add Systems" 1s 251ms

Then I should see a "1 systems were added to new-systems-group server group" text 90ms

When I follow the left menu "Systems > System Groups" 58ms

And I click on "Use in SSM" in row "new-systems-group" 60ms

Then I should see a "Selected Systems List" text 83ms

And I should see "rhlike_minion" as link 15ms

And I should see "sle_minion" as link 10ms

When I manually install the "locale" formula on the server 0s

When I synchronize all Salt dynamic modules on "sle_minion" 5s 12ms

When I follow the left menu "Systems > System Groups" 60ms

And I follow "new-systems-group" 310ms

And I follow "Formulas" 383ms

Then I should see a "Choose formulas:" text 67ms

And I should see a "General System Configuration" text 189ms

And the "locale" formula should be unchecked 10s 37ms

When I follow the left menu "Systems > System Groups" 64ms

Then I should see a "System Groups" text 74ms

When I follow "new-systems-group" 296ms

And I follow "States" 410ms

And I click on "Apply Highstate" 62ms

Then I should see a "Applying the highstate has been scheduled." text 1s 351ms

When I follow "scheduled" 271ms

Then I should see a "Apply states (highstate)" text 55ms

And I should see a "Action Details" text 52ms

And I wait until I see "2 systems successfully completed this action." text, refreshing the page 29s 813ms

Given I am on the Systems overview page of this "sle_minion" 1s 807ms

When I follow "Groups" 497ms

And I check "new-systems-group" in the list 66ms

And I click on "Leave Groups" 1s 20ms

Then I should see a "1 system groups removed." text 63ms

When I manually uninstall the "locale" formula from the server 0s

When I follow the left menu "Systems > System Groups" 62ms

When I follow "new-systems-group" in the content area 67ms

And I follow "Delete Group" in the content area 94ms

And I click on "Confirm Deletion" 60ms

Then I should see a "System group" text 60ms

And I should see a "new-systems-group" text 59ms

And I should see a "deleted" text 56ms

Search by hostname: uyuni-master-suse-minion
[{"last_boot"=>"2026-04-28T13:25:56Z", "name"=>"uyuni-master-suse-minion.sumaci.aws", "id"=>1000010023, "last_checkin"=>"2026-04-28T16:25:25Z"}]

When I clean the search index on the server 13s 397ms

When I disable repository "test_repo_rpm_pool" on this "sle_minion" without error control 739ms

And I refresh the metadata for "sle_minion" 875ms

And I remove package "andromeda-dummy" from this "sle_minion" without error control 1s 465ms

And I remove package "virgo-dummy" from this "sle_minion" without error control 1s 483ms

When I follow the left menu "Configuration > Channels" 122ms

And I follow "Create Config Channel" 453ms

And I enter "Mixed Channel" as "cofName" 67ms

And I enter "mixedchannel" as "cofLabel" 82ms

And I enter "This is a configuration channel for different system types" as "cofDescription" 96ms

And I click on "Create Config Channel" 758ms

Then I should see a "Mixed Channel" text 68ms

When I follow the left menu "Configuration > Channels" 65ms

And I follow "Mixed Channel" 437ms

And I follow "Create Configuration File or Directory" 389ms

And I enter "/etc/s-mgr/config" as "cffPath" 68ms

And I enter "COLOR=white" in the editor 4ms

And I click on "Create Configuration File" 706ms

Then I should see a "Revision 1 of /etc/s-mgr/config from channel Mixed Channel" text 95ms

And file "/srv/susemanager/salt/manager_org_1/mixedchannel/init.sls" should exist on server 3s 366ms

And file "/srv/susemanager/salt/manager_org_1/mixedchannel/etc/s-mgr/config" should exist on server 4s 963ms

When I am on the Systems overview page of this "sle_minion" 2s 17ms

And I follow "Configuration" in the content area 75ms

And I follow "Manage Configuration Channels" in the content area 69ms

And I follow first "Subscribe to Channels" in the content area 67ms

And I check "Mixed Channel" in the list 62ms

And I click on "Continue" 765ms

And I click on "Update Channel Rankings" 918ms

Then I should see a "Channel Subscriptions successfully changed for" text 79ms

When I am on the Systems overview page of this "rhlike_minion" 1s 241ms

And I follow "Configuration" in the content area 63ms

And I follow "Manage Configuration Channels" in the content area 58ms

And I follow first "Subscribe to Channels" in the content area 58ms

And I check "Mixed Channel" in the list 52ms

And I click on "Continue" 53ms

And I click on "Update Channel Rankings" 853ms

Then I should see a "Channel Subscriptions successfully changed for" text 76ms

When I am on the Systems overview page of this "deblike_minion" 1s 134ms

And I follow "Configuration" in the content area 64ms

And I follow "Manage Configuration Channels" in the content area 59ms

And I follow first "Subscribe to Channels" in the content area 61ms

And I check "Mixed Channel" in the list 58ms

And I click on "Continue" 50ms

And I click on "Update Channel Rankings" 1s 56ms

Then I should see a "Channel Subscriptions successfully changed for" text 76ms

When I am on the Systems overview page of this "ssh_minion" 2s 95ms

And I follow "Configuration" in the content area 70ms

And I follow "Manage Configuration Channels" in the content area 60ms

And I follow first "Subscribe to Channels" in the content area 64ms

And I check "Mixed Channel" in the list 53ms

And I click on "Continue" 633ms

And I click on "Update Channel Rankings" 861ms

Then I should see a "Channel Subscriptions successfully changed for" text 79ms

When I follow the left menu "Configuration > Channels" 122ms

And I follow "Mixed Channel" 495ms

And I follow "Deploy all configuration files to all subscribed systems" 497ms

Then I should see a "/etc/s-mgr/config" link 11ms

When I click on "Deploy Files to Selected Systems" 776ms

Then I should see a "revision-deploys are being scheduled," text 67ms

And I should see a "0 revision-deploys overridden." text 63ms

When I wait until file "/etc/s-mgr/config" exists on "sle_minion" 2s 218ms

Then file "/etc/s-mgr/config" should contain "COLOR=white" on "sle_minion" 799ms

When I wait until file "/etc/s-mgr/config" exists on "rhlike_minion" 298ms

Then file "/etc/s-mgr/config" should contain "COLOR=white" on "rhlike_minion" 355ms

When I wait until file "/etc/s-mgr/config" exists on "deblike_minion" 908ms

Then file "/etc/s-mgr/config" should contain "COLOR=white" on "deblike_minion" 386ms

When I wait until file "/etc/s-mgr/config" exists on "ssh_minion" 6s 310ms

Then file "/etc/s-mgr/config" should contain "COLOR=white" on "ssh_minion" 784ms

Salt command: salt uyuni-master-suse-minion.sumaci.aws state.highstate

When I store "COLOR=blue" into file "/etc/s-mgr/config" on "sle_minion" 399ms

And I apply highstate on "sle_minion" 11s 711ms

Then file "/etc/s-mgr/config" should contain "COLOR=white" on "sle_minion" 1s 99ms

Salt command: salt uyuni-master-rhlike-minion state.highstate

When I store "COLOR=blue" into file "/etc/s-mgr/config" on "rhlike_minion" 284ms

And I apply highstate on "rhlike_minion" 4m 11s 700ms Show Error +
                                            
execution expired (Timeout::Error) ./features/support/commonlib.rb:89:in `repeat_until_timeout' ./features/support/remote_node.rb:189:in `run_until_ok' ./features/step_definitions/salt_steps.rb:650:in `/^I apply highstate on "([^"]*)"$/' features/secondary/allcli_config_channel.feature:112:in `I apply highstate on "rhlike_minion"'

Then file "/etc/s-mgr/config" should contain "COLOR=white" on "rhlike_minion" 0s

20s 201ms Show Info +
18:27:01:000 - 18:31:13:000 | Current URL: https://uyuni-master-server.sumaci.aws/rhn/configuration/ChannelOverview.do?ccid=7
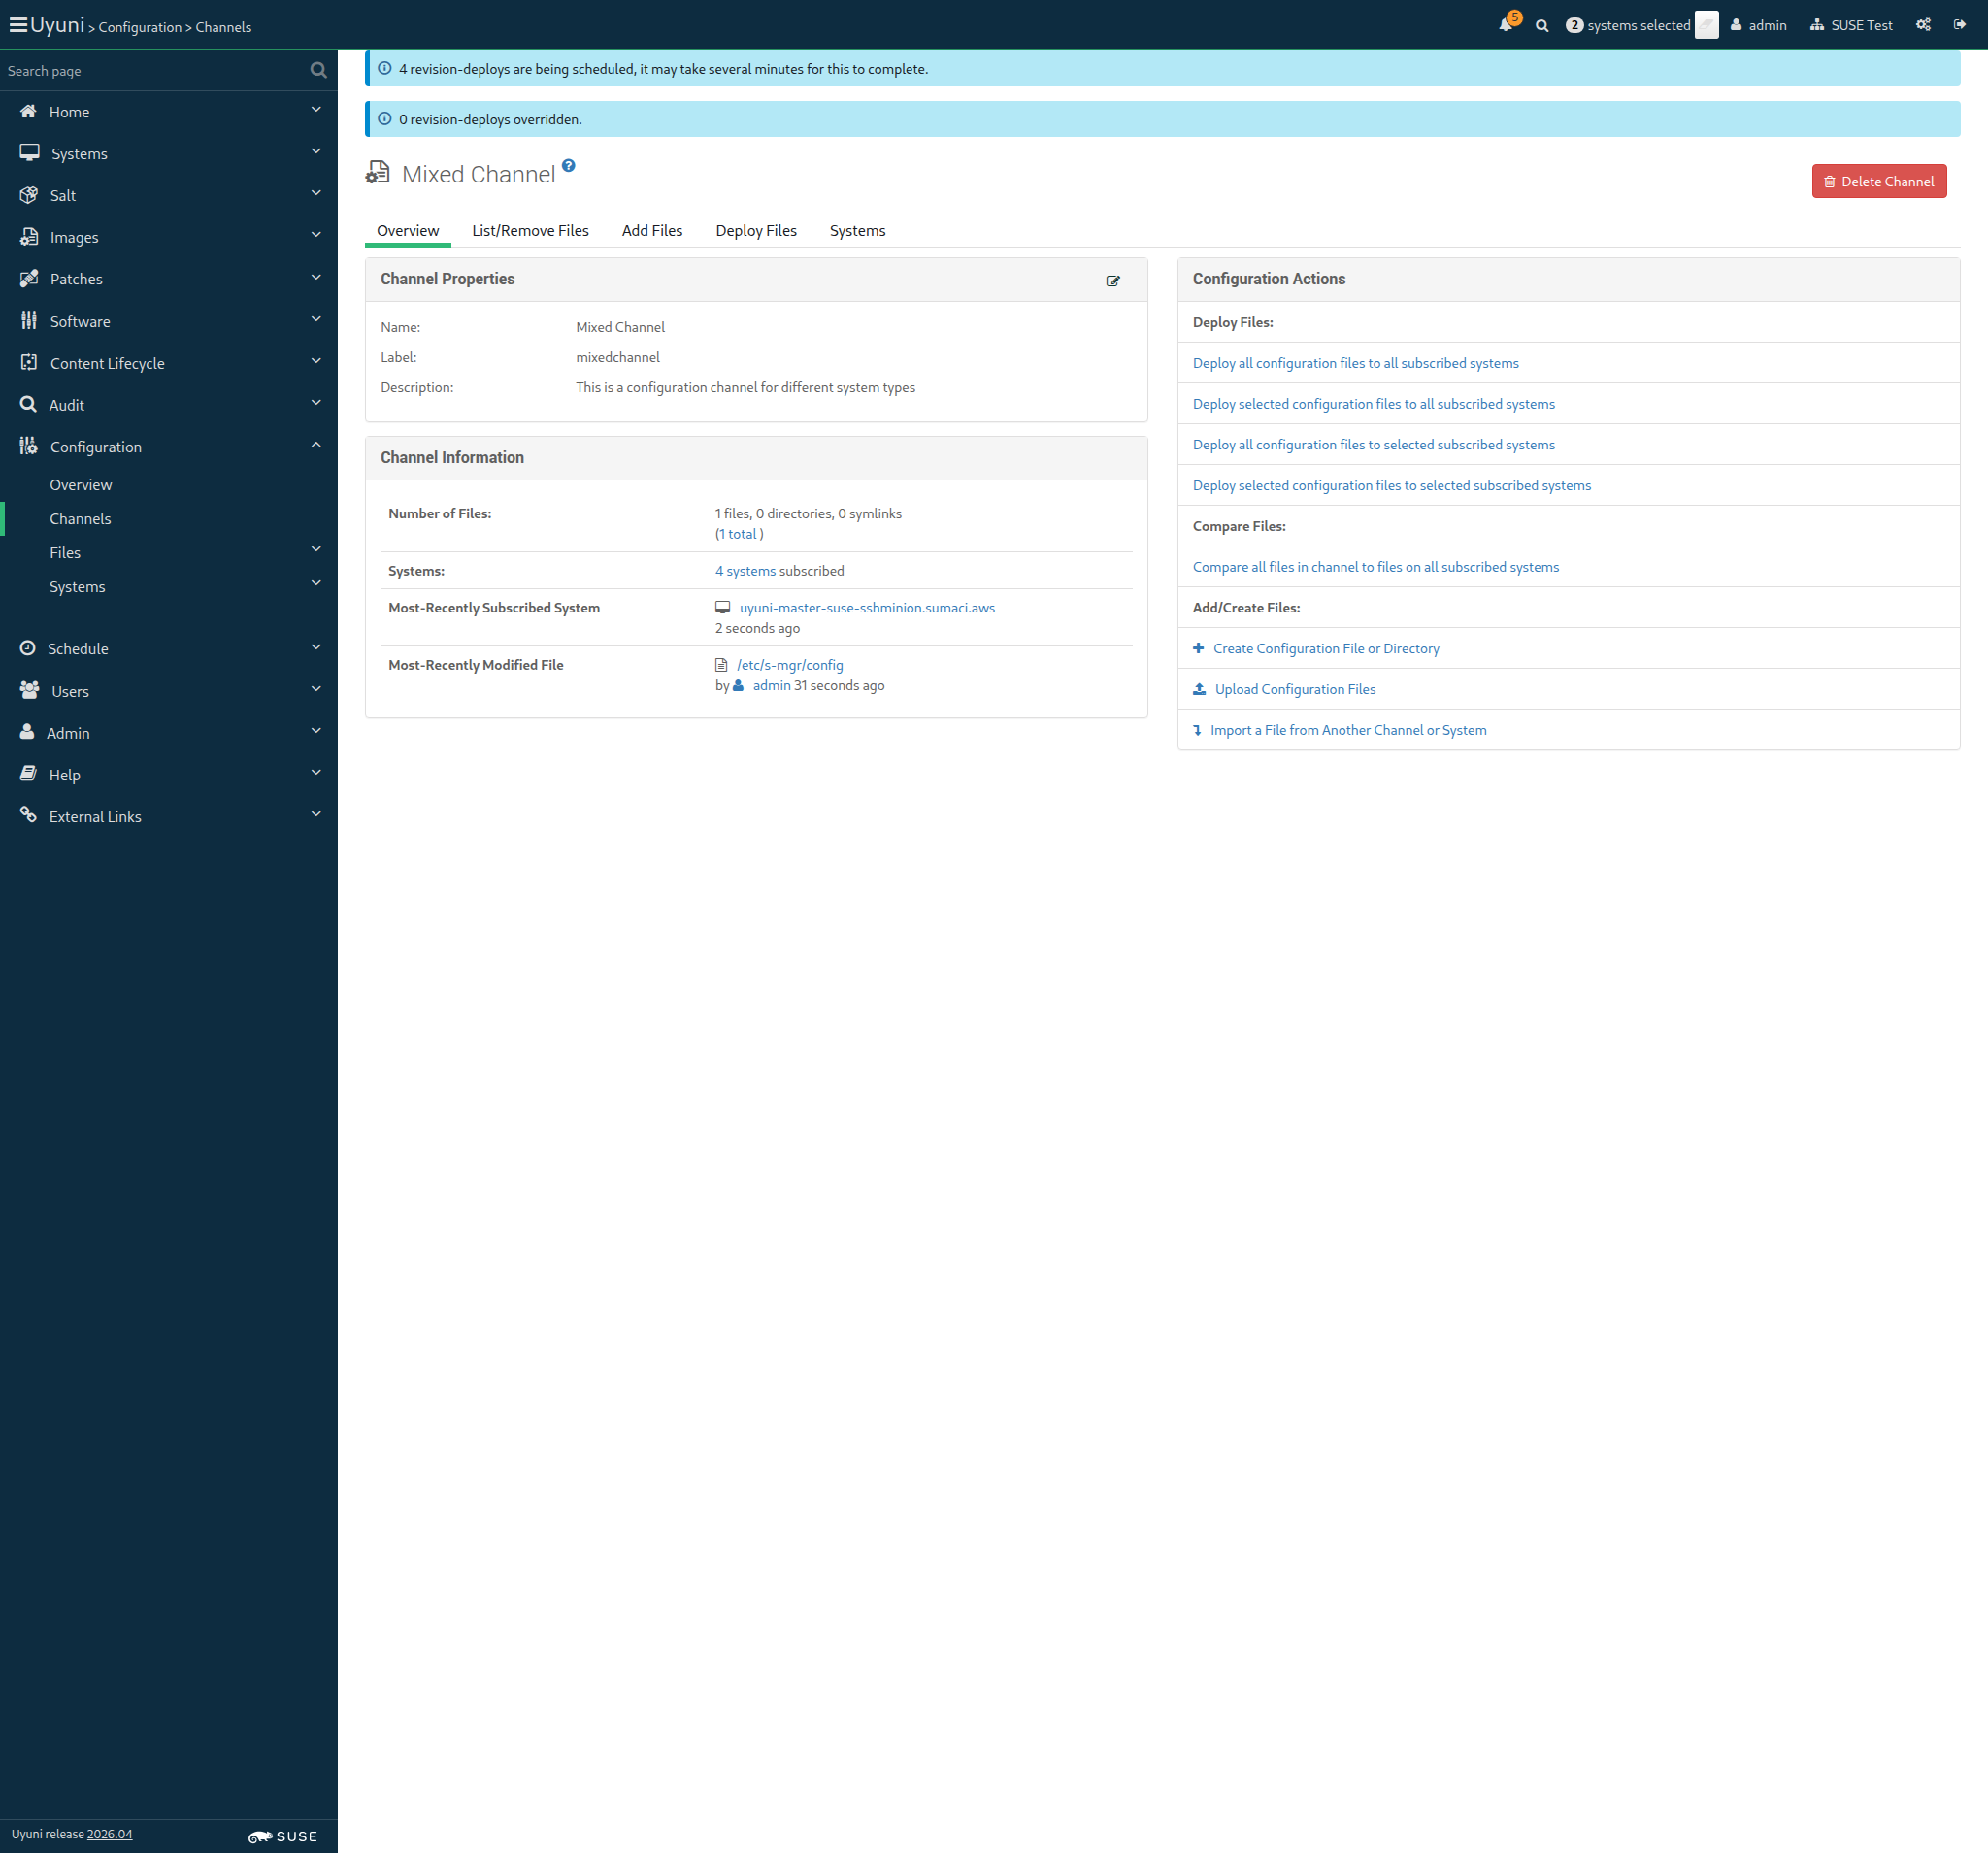
Screenshot +


Salt command: salt uyuni-master-deblike-minion state.highstate

When I store "COLOR=blue" into file "/etc/s-mgr/config" on "deblike_minion" 905ms

And I apply highstate on "deblike_minion" 8s 70ms

Then file "/etc/s-mgr/config" should contain "COLOR=white" on "deblike_minion" 388ms

Salt command: mgr-salt-ssh uyuni-master-suse-sshminion.sumaci.aws state.highstate

When I store "COLOR=blue" into file "/etc/s-mgr/config" on "ssh_minion" 677ms

And I apply highstate on "ssh_minion" 30s 864ms

Then file "/etc/s-mgr/config" should contain "COLOR=white" on "ssh_minion" 781ms

When I follow the left menu "Configuration > Channels" 79ms

And I follow "Mixed Channel" 435ms

And I follow "Systems" in the content area 65ms

And I check the "rhlike_minion" client 69ms

And I click on "Unsubscribe systems" 54ms

Then I should see a "Successfully unsubscribed 1 system(s)." text 578ms

And I destroy "/etc/s-mgr" directory on "rhlike_minion" 283ms

When I follow the left menu "Configuration > Channels" 57ms

And I follow "Mixed Channel" 484ms

And I follow "Systems" in the content area 57ms

And I check the "deblike_minion" client 56ms

And I click on "Unsubscribe systems" 610ms

Then I should see a "Successfully unsubscribed 1 system(s)." text 72ms

And I destroy "/etc/s-mgr" directory on "deblike_minion" 414ms

When I follow the left menu "Configuration > Channels" 60ms

And I follow "Mixed Channel" 492ms

And I follow "Systems" in the content area 58ms

And I check the "ssh_minion" client 53ms

And I click on "Unsubscribe systems" 551ms

Then I should see a "Successfully unsubscribed 1 system(s)." text 68ms

And I destroy "/etc/s-mgr" directory on "ssh_minion" 388ms

When I am on the Systems overview page of this "sle_minion" 1s 16ms

And I store "COLOR=red" into file "/etc/s-mgr/config" on "sle_minion" 691ms

And I follow "Configuration" in the content area 68ms

And I follow "Compare Files" in the content area 63ms

And I check "/etc/s-mgr/config" in the list 56ms

And I click on "Compare Files" 616ms

And I click on "Schedule Compare" 838ms

Then I should see a "1 files scheduled for comparison." text 70ms

When I wait until event "Show differences between profiled config files and deployed config files scheduled" is completed 2s 138ms

Then I should see a "Differences exist" link 10ms

When I follow "Differences exist" 367ms

Then I should see a "+COLOR=white" text 73ms

And I should see a "-COLOR=red" text 64ms

Then channel "mixedchannel" should exist 343ms

And channel "mixedchannel" should contain file "/etc/s-mgr/config" 343ms

And "sle_minion" should be subscribed to channel "mixedchannel" 353ms

When I store "COLOR=green" into file "/etc/s-mgr/config" on "sle_minion" 396ms

And I add file "/etc/s-mgr/other" containing "NAME=Dante" to channel "mixedchannel" 393ms

And I deploy all systems registered to channel "mixedchannel" 461ms

And I wait until file "/etc/s-mgr/other" exists on "sle_minion" 1s 888ms

Then file "/etc/s-mgr/config" should contain "COLOR=white" on "sle_minion" 793ms

And file "/etc/s-mgr/other" should contain "NAME=Dante" on "sle_minion" 791ms

When I unsubscribe "sle_minion" from configuration channel "mixedchannel" 994ms

Then "sle_minion" should not be subscribed to channel "mixedchannel" 577ms

When I follow the left menu "Systems > System List > All" 130ms

And I click on the clear SSM button 61ms

And I check the "sle_minion" client 432ms

And I follow the left menu "Systems > System Set Manager > Overview" 456ms

And I follow "config channel subscriptions" in the content area 63ms

And I check "Mixed Channel" in the list 54ms

And I click on "Continue" 54ms

And I click on "Apply Subscriptions" 484ms

And I click on "Confirm" 595ms

Then I should see a "Configuration channel subscriptions changed for 1 system successfully." text 63ms

When I follow the left menu "Configuration > Channels" 113ms

And I follow "Mixed Channel" 437ms

And I follow "Systems" in the content area 55ms

And I check the "sle_minion" client 49ms

And I click on "Unsubscribe systems" 49ms

Then I should see a "Successfully unsubscribed 1 system(s)." text 54ms

When I follow the left menu "Configuration > Channels" 60ms

And I follow "Mixed Channel" 425ms

And I follow "Delete Channel" 301ms

And I click on "Delete Config Channel" 373ms

Then file "/srv/susemanager/salt/manager_org_1/mixedchannel/init.sls" should not exist on server 2s 937ms

When I destroy "/etc/s-mgr" directory on "sle_minion" 692ms

@scope_changing_software_channels @scc_credentials
Feature:Channel subscription via SSM 5m 18s 488ms 14 5

When I follow the left menu "Systems > System List > All" 0s

And I click on the clear SSM button 0s

And I check the "sle_minion" client 0s

And I should see "1" systems selected for SSM 0s

And I follow the left menu "Systems > System Set Manager > Overview" 0s

And I follow "channel memberships" in the content area 0s

Then I should see a "Base Channel" text 0s

And I should see a "Next" text 0s

When I select "Fake-Base-Channel-SUSE-like" from drop-down in table line with "SLE-Product-SLES15-SP7-Pool for x86_64" 0s

And I click on "Next" 0s

Then I should see a "Child Channels" text 0s

And I should see a "Fake-Base-Channel-SUSE-like" text 0s

And I should see a "1 system(s) to subscribe" text 0s

When I choose radio button "Subscribe" for child channel "Fake-Child-Channel-SUSE-like" 0s

And I click on "Next" 0s

Then I should see a "Channel Changes Overview" text 0s

And I should see a "1 system(s) to subscribe" text 0s

When I schedule action to 3 minutes from now 0s

And I click on "Confirm" 0s

And I remember when I scheduled an action 0s

Then I wait until I see "Channel Changes Actions" text 0s

And a table line should contain system "sle_minion", "Scheduled" 0s

When I follow the left menu "Systems > System List > All" 172ms

And I click on the clear SSM button 51ms

And I check the "sle_minion" client 420ms

And I should see "1" systems selected for SSM 148ms

And I follow the left menu "Systems > System Set Manager > Overview" 424ms

And I follow "channel memberships" in the content area 68ms

Then I should see a "Base Channel" text 71ms

And I should see a "Next" text 68ms

When I select "Fake-Base-Channel-SUSE-like" from drop-down in table line with "openSUSE Tumbleweed (x86_64)" 206ms

And I click on "Next" 61ms

Then I should see a "Child Channels" text 720ms

And I should see a "Fake-Base-Channel-SUSE-like" text 66ms

And I should see a "1 system(s) to subscribe" text 65ms

When I choose radio button "Subscribe" for child channel "Fake-Child-Channel-SUSE-like" 67ms

And I click on "Next" 59ms

Then I should see a "Channel Changes Overview" text 67ms

And I should see a "1 system(s) to subscribe" text 75ms

When I schedule action to 3 minutes from now 241ms

And I click on "Confirm" 53ms

And I remember when I scheduled an action < 1ms

Then I wait until I see "Channel Changes Actions" text 489ms

And a table line should contain system "sle_minion", "Scheduled" 20ms

Given I am on the Systems overview page of this "sle_minion" 0s

When I follow "Software" in the content area 0s

And I follow "Software Channels" in the content area 0s

And I wait until I do not see "Loading..." text 0s

Then radio button "SLE-Product-SLES15-SP7-Pool for x86_64" should be checked 0s

And I wait until I do not see "Loading..." text 0s

And I should see "SLE15-SP7-Installer-Updates for x86_64" as unchecked 0s

Given I am on the Systems overview page of this "sle_minion" 1s 66ms

When I follow "Software" in the content area 68ms

And I follow "Software Channels" in the content area 64ms

And I wait until I do not see "Loading..." text 70ms

Then radio button "openSUSE Tumbleweed (x86_64)" should be checked 166ms

And I wait until I do not see "Loading..." text 509ms

And I should see "Uyuni Client Tools for openSUSE Tumbleweed (x86_64)" as unchecked 18ms

When I refresh the metadata for "sle_minion" 0s

Then channel "SLE-Product-SLES15-SP7-Pool for x86_64" should be enabled on "sle_minion" 0s

And channel "SLE15-SP7-Installer-Updates for x86_64" should be disabled on "sle_minion" 0s

When I refresh the metadata for "sle_minion" 1s 230ms

Then channel "openSUSE Tumbleweed (x86_64)" should be enabled on "sle_minion" 712ms

And channel "Uyuni Client Tools for openSUSE Tumbleweed (x86_64)" should be disabled on "sle_minion" 725ms

Given I am on the Systems overview page of this "sle_minion" 946ms

When I wait until event "Subscribe channels scheduled" is completed 1m 12s 647ms

Then I should see a "The client completed this action on" text 62ms

Given I am on the Systems overview page of this "sle_minion" 941ms

When I follow "Software" in the content area 75ms

And I follow "Software Channels" in the content area 63ms

And I wait until I do not see "Loading..." text 67ms

Then radio button "Fake-Base-Channel-SUSE-like" should be checked 115ms

And I wait until I do not see "Loading..." text 416ms

And I should see "Fake-Child-Channel-SUSE-like" as checked 17ms

When I refresh the metadata for "sle_minion" 0s

Then "2" channels should be enabled on "sle_minion" 0s

And channel "Fake-Base-Channel-SUSE-like" should be enabled on "sle_minion" 0s

And channel "Fake-Child-Channel-SUSE-like" should be enabled on "sle_minion" 0s

When I refresh the metadata for "sle_minion" 1s 512ms

Then "2" channels should be enabled on "sle_minion" 684ms

And channel "Fake-Base-Channel-SUSE-like" should be enabled on "sle_minion" 674ms

And channel "Fake-Child-Channel-SUSE-like" should be enabled on "sle_minion" 676ms

When I follow the left menu "Systems > System List > All" 131ms

And I click on the clear SSM button 52ms

And I check the "rhlike_minion" client 418ms

Then I should see "1" systems selected for SSM 95ms

When I follow the left menu "Systems > System Set Manager > Overview" 429ms

And I follow "channel memberships" in the content area 67ms

And I select "System Default Base Channel" from drop-down in table line with "Fake-Base-Channel-RH-like" 354ms

And I click on "Next" 83ms

Then I should see a "Child Channels" text 183ms

And I should see a "Couldn't determine new base channel" text 63ms

And I should see a "1 system(s) incompatible" text 61ms

When I click on "Next" 57ms

Then I should see a "Channel Changes Overview" text 64ms

And I should see a "Couldn't determine new base channel" text 64ms

And I should see a "1 system(s) incompatible" text 74ms

When I click on "Confirm" 57ms

Then I should see a "Channel Changes Actions" text 293ms

And I should see a "Items 1 - 1 of 1" text 67ms

And a table line should contain system "rhlike_minion", "Could not determine system default channel" 20ms

And I click on the clear SSM button 47ms

Given I am on the Systems overview page of this "rhlike_minion" 1s 109ms

When I follow "Software" in the content area 60ms

And I follow "Software Channels" in the content area 57ms

Then radio button "Fake-Base-Channel-RH-like" should be checked 308ms

When I follow the left menu "Systems > System List > All" 108ms

And I click on the clear SSM button 46ms

And I check the "deblike_minion" client 435ms

Then I should see "1" systems selected for SSM 114ms

When I follow the left menu "Systems > System Set Manager > Overview" 419ms

And I follow "channel memberships" in the content area 59ms

And I select "System Default Base Channel" from drop-down in table line with "Fake-Base-Channel-Debian-like" 191ms

And I click on "Next" 52ms

Then I should see a "Child Channels" text 184ms

And I should see a "Couldn't determine new base channel" text 67ms

And I should see a "1 system(s) incompatible" text 62ms

When I click on "Next" 57ms

Then I should see a "Channel Changes Overview" text 61ms

And I should see a "Couldn't determine new base channel" text 80ms

And I should see a "1 system(s) incompatible" text 68ms

When I click on "Confirm" 49ms

Then I should see a "Channel Changes Actions" text 280ms

And I should see a "Items 1 - 1 of 1" text 63ms

And a table line should contain system "deblike_minion", "Could not determine system default channel" 17ms

And I click on the clear SSM button 46ms

Given I am on the Systems overview page of this "deblike_minion" 900ms

When I follow "Software" in the content area 61ms

And I follow "Software Channels" in the content area 57ms

Then radio button "Fake-Base-Channel-Debian-like" should be checked 264ms

Given I am on the Systems overview page of this "sle_minion" 0s

When I follow "Software" in the content area 0s

And I follow "Software Channels" in the content area 0s

And I wait until I do not see "Loading..." text 0s

And I check radio button "SLE-Product-SLES15-SP7-Pool for x86_64" 0s

And I wait until I do not see "Loading..." text 0s

And I include the recommended child channels 0s

And I check "SLE-Module-DevTools15-SP7-Pool for x86_64" 0s

And I check "SLE-Module-Containers15-SP7-Pool for x86_64" 0s

And I check "Fake-RPM-SUSE-Channel" 0s

And I wait until I do not see "Loading..." text 0s

And I wait until I see "SLE15-SP7-Installer-Updates for x86_64" text 0s

And I wait until I do not see "Loading..." text 0s

And I include the recommended child channels 0s

And I check "SLE-Module-DevTools15-SP7-Pool for x86_64" 0s

And I check "Fake-RPM-SUSE-Channel" 0s

And I click on "Next" 0s

Then I should see a "Confirm Software Channel Change" text 0s

When I click on "Confirm" 0s

Then I should see a "Changing the channels has been scheduled." text 0s

When I follow "scheduled" in the content area 0s

And I wait until I see "1 system successfully completed this action." text, refreshing the page 0s

Then channel "SLE15-SP7-Installer-Updates for x86_64" should be disabled on "sle_minion" 0s

Given I am on the Systems overview page of this "sle_minion" 871ms

When I follow "Software" in the content area 65ms

And I follow "Software Channels" in the content area 57ms

And I wait until I do not see "Loading..." text 70ms

And I check radio button "openSUSE Tumbleweed (x86_64)" 10s 81ms

And I wait until I do not see "Loading..." text 509ms

And I check "Uyuni Client Tools for openSUSE Tumbleweed (x86_64) (Development)" 75ms

And I check "Fake-RPM-SUSE-Channel" 73ms

And I click on "Next" 54ms

Then I should see a "Confirm Software Channel Change" text 67ms

When I click on "Confirm" 66ms

Then I should see a "Changing the channels has been scheduled." text 301ms

When I follow "scheduled" in the content area 72ms

And I wait until I see "1 system successfully completed this action." text, refreshing the page 29s 801ms

Then channel "Uyuni Client Tools for openSUSE Tumbleweed (x86_64)" should be disabled on "sle_minion" 699ms

Given I am on the Systems overview page of this "sle_minion" 0s

When I follow "Software" in the content area 0s

And I follow "Software Channels" in the content area 0s

And I wait until I do not see "Loading..." text 0s

And I check radio button "SLE-Product-SLES15-SP7-Pool for x86_64" 0s

And I wait until I do not see "Loading..." text 0s

Then I should see the child channel "SLE-Product-SLES15-SP7-Updates for x86_64" "selected" and "disabled" 0s

When I exclude the recommended child channels 0s

Then I should see the toggler "disabled" 0s

And I should see a "SLE-Module-Containers15-SP7-Pool for x86_64" text 0s

And I should see the child channel "SLE-Module-Containers15-SP7-Pool for x86_64" "unselected" 0s

When I select the child channel "SLE-Module-Containers15-SP7-Pool for x86_64" 0s

Then I should see the child channel "SLE-Module-Containers15-SP7-Pool for x86_64" "selected" 0s

When I click on the "disabled" toggler 0s

Then I should see the child channel "SLE-Module-Server-Applications15-SP7-Pool for x86_64" "selected" 0s

Given I am on the Systems overview page of this "sle_minion" 2s 464ms

When I follow "Software" in the content area 70ms

And I follow "Software Channels" in the content area 65ms

And I wait for child channels to appear 212ms

And I check radio button "(none, disable service)" 10s 65ms

And I wait for child channels to appear 226ms

And I check radio button "openSUSE Tumbleweed (x86_64)" 10s 61ms

Then I should see the child channel "Uyuni Client Tools for openSUSE Tumbleweed (x86_64)" "unselected" and "disabled" 10s 99ms

When I select the child channel "Uyuni Client Tools for openSUSE Tumbleweed (x86_64)" 10s 151ms

Then I should see the child channel "Uyuni Client Tools for openSUSE Tumbleweed (x86_64)" "selected" 104ms

When I follow the left menu "Systems > System List > All" 0s

And I check the "sle_minion" client 0s

Then I should see "1" systems selected for SSM 0s

When I follow the left menu "Systems > System Set Manager > Overview" 0s

And I follow "channel memberships" in the content area 0s

Then I should see a "Base Channel" text 0s

And I should see a "Next" text 0s

And I should see a table line with "SLE-Product-SLES15-SP7-Pool for x86_64", "1" 0s

When I select "System Default Base Channel" from drop-down in table line with "SLE-Product-SLES15-SP7-Pool for x86_64" 0s

And I click on "Next" 0s

Then I should see the toggler "disabled" 0s

And I should see a "SLE-Module-Basesystem15-SP7-Pool for x86_64" text 0s

And I should see "No change" "selected" for the "SLE-Module-Basesystem15-SP7-Pool for x86_64" channel 0s

When I click on the "disabled" toggler 0s

Then I should see "Subscribe" "selected" for the "SLE-Module-Basesystem15-SP7-Pool for x86_64" channel 0s

And I should see "No change" "unselected" for the "SLE-Module-Basesystem15-SP7-Pool for x86_64" channel 0s

When I follow the left menu "Systems > System List > All" 136ms

And I check the "sle_minion" client 489ms

Then I should see "1" systems selected for SSM 115ms

When I follow the left menu "Systems > System Set Manager > Overview" 506ms

And I follow "channel memberships" in the content area 69ms

Then I should see a "Base Channel" text 71ms

And I should see a "Next" text 71ms

When I select "No Change" from drop-down in table line with "openSUSE Tumbleweed (x86_64)" 44ms

And I click on "Next" 58ms

Then I should see the toggler "disabled" 332ms

When I enable repository "test_repo_rpm_pool" on this "rhlike_minion" 294ms

When I install package "virgo-dummy-1.0" on this "rhlike_minion" 1s 542ms

When I remove package "andromeda-dummy" from this "rhlike_minion" 1s 462ms

When I refresh packages list via spacecmd on "rhlike_minion" 6s 530ms Show Error +
                                            
FAIL: mgrctl exec -i 'spacecmd -u admin -p admin system_schedulepackagerefresh uyuni-master-rhlike-minion' returned status code = 1. Output: ** Generating system cache ** (ScriptError) ./features/support/remote_node.rb:172:in `run_local' ./features/support/remote_node.rb:120:in `run' ./features/step_definitions/command_steps.rb:1253:in `/^I refresh packages list via spacecmd on "([^"]*)"$/' features/secondary/min_rhlike_salt_install_package_and_patch.feature:20:in `I refresh packages list via spacecmd on "rhlike_minion"'

And I wait until refresh package list on "rhlike_minion" is finished 0s

Then spacecmd should show packages "virgo-dummy-1.0" installed on "rhlike_minion" 0s

46s 912ms Show Error +
                                            
User is not logged in (ScriptError) ./features/step_definitions/navigation_steps.rb:655:in `/^I should be logged in$/' ./features/step_definitions/navigation_steps.rb:635:in `/^I am authorized as "([^"]*)" with password "([^"]*)"$/' ./features/support/env.rb:236:in `block in relog_and_visit_previous_url' ./features/support/env.rb:234:in `relog_and_visit_previous_url' ./features/support/env.rb:214:in `handle_screenshot_and_relog' ./features/support/env.rb:174:in `After'
Show Info +
18:39:37:000 - 18:39:44:000 | Current URL: https://uyuni-master-server.sumaci.aws/rhn/channel/ssm/ChannelSubscriptions.do
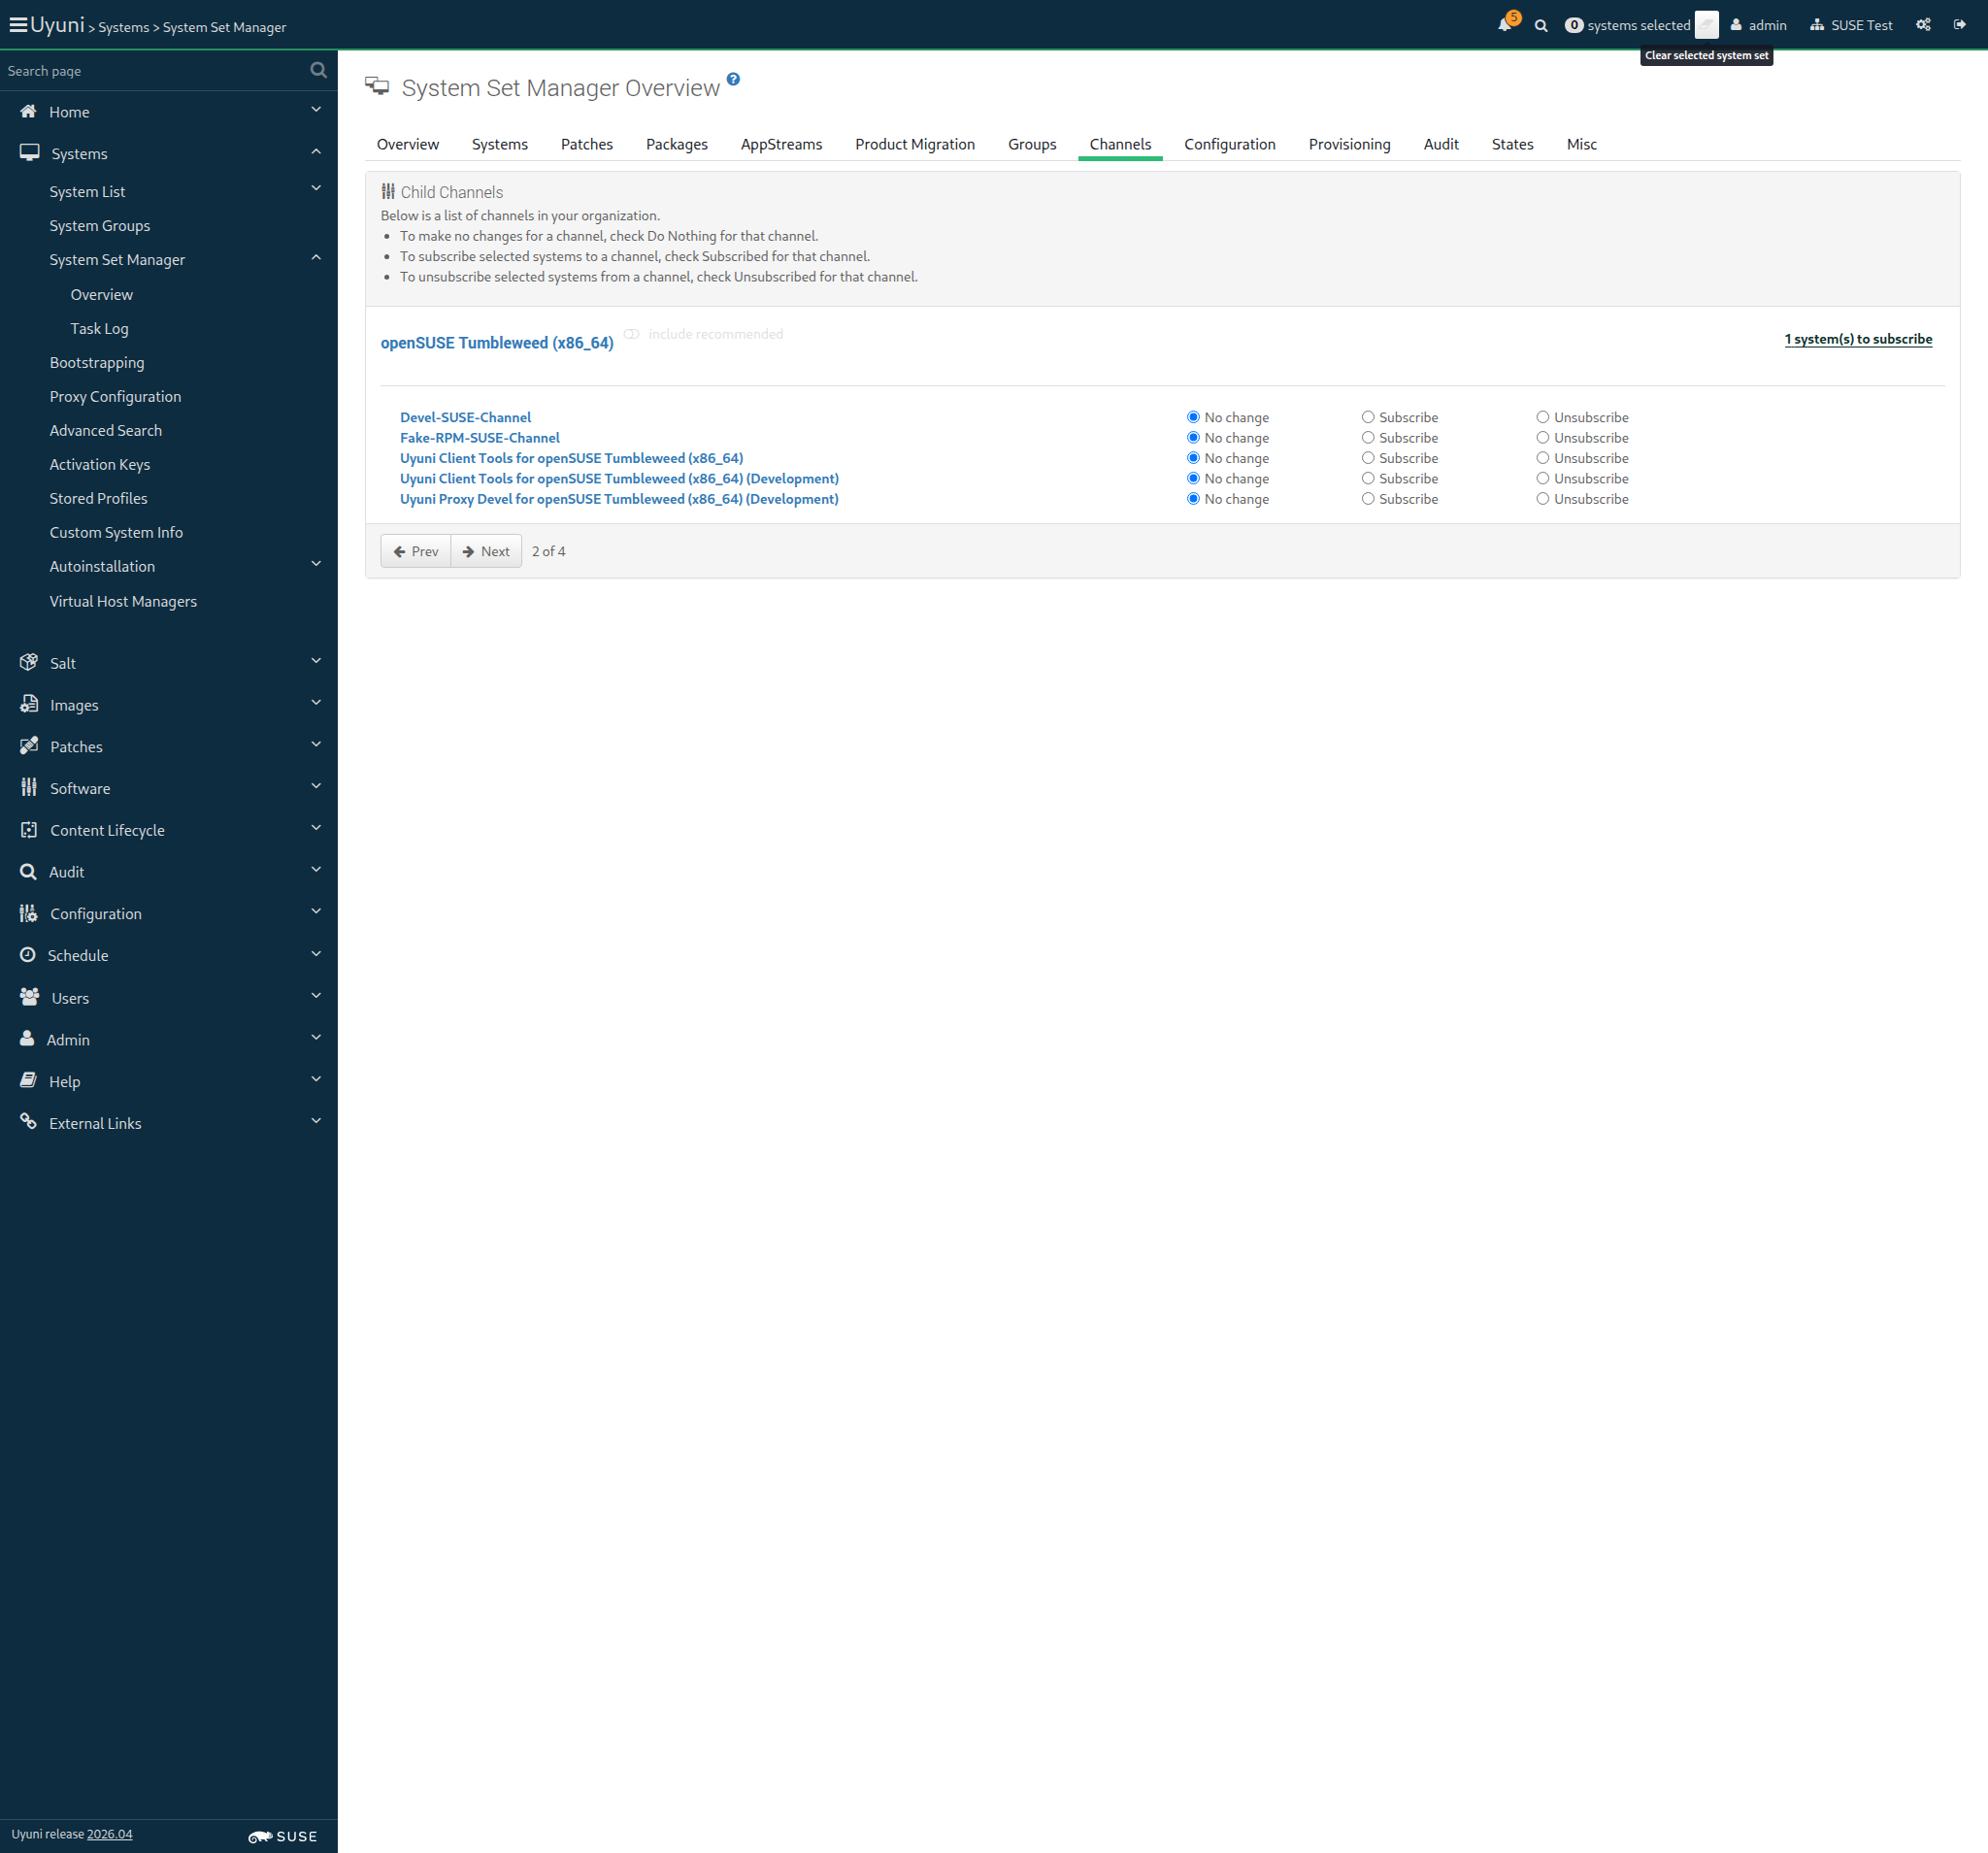
Screenshot +


Given I am authorized for the "Admin" section 10s 689ms

Warning: Radio button 'Fake-Base-Channel-RH-like' is already checked

Given I am on the Systems overview page of this "rhlike_minion" 1s 558ms

When I follow "Software" in the content area 74ms

And I follow "Software Channels" in the content area 77ms

And I wait until I do not see "Loading..." text 74ms

And I check radio button "Fake-Base-Channel-RH-like" 400ms

And I wait until I do not see "Loading..." text 414ms

And I click on "Next" 66ms

Then I should see a "Confirm Software Channel Change" text 63ms

When I click on "Confirm" 70ms

Then I should see a "Changing the channels has been scheduled." text 398ms

And I wait until event "Subscribe channels scheduled" is completed 22s 137ms

When I follow "Software" in the content area 70ms

And I follow "List / Remove" in the content area 64ms

And I enter "virgo-dummy" as the filtered package name 180ms

And I click on the filter button until page does contain "virgo-dummy" text 10s 921ms

When I follow the left menu "Admin > Task Schedules" 121ms

And I follow "errata-cache-default" 1s 212ms

And I follow "errata-cache-bunch" 1s 278ms

And I click on "Single Run Schedule" 1s 572ms

Then I should see a "bunch was scheduled" text 276ms

And I wait until the table contains "FINISHED" or "SKIPPED" followed by "FINISHED" in its first rows 1s 953ms

Given I am on the Systems overview page of this "rhlike_minion" 938ms

When I follow "Software" in the content area 73ms

And I follow "Patches" in the content area 62ms

When I check "virgo-dummy-3456" in the list 67ms

And I click on "Apply Patches" 640ms

And I click on "Confirm" 677ms

Then I should see a "1 patch update has been scheduled for" text 79ms

And I wait for "virgo-dummy-2.0-1.1" to be installed on "rhlike_minion" 9s 543ms

When I follow "Software" in the content area 61ms

And I follow "Install" 421ms

And I check "andromeda-dummy" in the list 65ms

And I click on "Install Packages" 607ms

And I click on "Confirm" 656ms

Then I should see a "1 package install has been scheduled for" text 66ms

And I wait until event "Package Install/Upgrade scheduled" is completed 21s 672ms

When I follow "Software" in the content area 74ms

And I follow "List / Remove" 663ms

And I enter "andromeda" as the filtered package name 131ms

And I click on the filter button 808ms

And I check "andromeda-dummy" in the list 60ms

And I enter "virgo-dummy" as the filtered package name 44ms

And I click on the filter button 124ms

And I check "virgo-dummy" in the list 54ms

And I click on "Remove Packages" 691ms

And I click on "Confirm" 666ms

Then I should see a "2 package removals have been scheduled" text 63ms

And I wait until event "Package Removal scheduled" is completed 21s 697ms

And I disable repository "test_repo_rpm_pool" on this "rhlike_minion" 302ms

In order to monitor Uyuni server
As an authorized user
I want to enable Prometheus exporters

Given I am on the Systems overview page of this "rhlike_minion" 1s 738ms

When I follow "Formulas" in the content area 75ms

Then I should see a "Choose formulas:" text 62ms

And I should see a "Monitoring" text 286ms

When I check the "prometheus-exporters" formula 75ms

And I click on "Save" 61ms

And I wait until I see "Formula saved" text 604ms

When I follow "Formulas" in the content area 56ms

And I follow "Prometheus Exporters" in the content area 260ms

And I click on "Expand All Sections" 207ms

Then I should see a "Enable and configure Prometheus exporters for managed systems." text 118ms

When I check "node" exporter 46ms

And I check "apache" exporter 89ms

And I check "postgres" exporter 88ms

And I click on "Save" 71ms

Then I should see a "Formula saved" text 1s 421ms

When I enable the repositories "tools_update_repo tools_pool_repo" on this "rhlike_minion" without error control 571ms

When I follow "States" in the content area 75ms

And I click on "Apply Highstate" 60ms

Then I should see a "Applying the highstate has been scheduled." text 646ms

And I wait until event "Apply highstate scheduled" is completed 38s 606ms

@skip_if_github_validation
Scenario:
Wait for service
677ms 3

When I wait until "node" exporter service is active on "rhlike_minion" 302ms

And I wait until "apache" exporter service is active on "rhlike_minion" 191ms

And I wait until "postgres" exporter service is active on "rhlike_minion" 183ms

When I visit "Prometheus node exporter" endpoint of this "rhlike_minion" 185ms

And I visit "Prometheus apache exporter" endpoint of this "rhlike_minion" 189ms

And I visit "Prometheus postgres exporter" endpoint of this "rhlike_minion" 196ms

When I follow "Formulas" in the content area 76ms

And I uncheck the "prometheus-exporters" formula 209ms

And I click on "Save" 62ms

Then I wait until I see "Formula saved" text 1s 19ms

When I follow "States" in the content area 70ms

And I click on "Apply Highstate" 65ms

Then I should see a "Applying the highstate has been scheduled." text 1s 59ms

And I wait until event "Apply highstate scheduled" is completed 22s 865ms

When I disable the repositories "tools_update_repo tools_pool_repo" on this "rhlike_minion" without error control 288ms

When I enable repository "test_repo_rpm_pool" on this "ssh_minion" 725ms

When I refresh the metadata for "ssh_minion" 910ms

And I install old package "virgo-dummy-1.0" on this "ssh_minion" without error control 1s 295ms

When I remove package "andromeda-dummy" from this "ssh_minion" without error control 782ms

And I refresh the metadata for "ssh_minion" 814ms

And I refresh packages list via spacecmd on "ssh_minion" 7s 810ms

And I wait until refresh package list on "ssh_minion" is finished 25s 120ms

When I refresh packages list via spacecmd on "ssh_minion" 7s 544ms

And I wait until refresh package list on "ssh_minion" is finished 24s 959ms

Then spacecmd should show packages "virgo-dummy-1.0" installed on "ssh_minion" 7s 401ms

And I wait until package "andromeda-dummy-2.0-1.1" is removed from "ssh_minion" via spacecmd 7s 365ms

Given I am authorized for the "Admin" section 447ms

Given I am on the Systems overview page of this "ssh_minion" 1s 419ms

When I follow "Software" in the content area 78ms

And I follow "List / Remove" in the content area 62ms

And I enter "virgo-dummy" as the filtered package name 189ms

And I click on the filter button until page does contain "virgo-dummy" text 11s 172ms

When I follow the left menu "Admin > Task Schedules" 119ms

And I follow "errata-cache-default" 406ms

And I follow "errata-cache-bunch" 1s 579ms

And I click on "Single Run Schedule" 1s 250ms

Then I should see a "bunch was scheduled" text 265ms

When I wait until the table contains "FINISHED" or "SKIPPED" followed by "FINISHED" in its first rows 12s 10ms

Given I am on the Systems overview page of this "ssh_minion" 936ms

When I follow "Software" in the content area 66ms

And I follow "Patches" in the content area 63ms

And I enter "virgo" as the filtered synopsis 48ms

And I click on the filter button 10s 112ms

And I check "virgo-dummy-3456" in the list 59ms

And I check "allowVendorChange" 74ms

And I click on "Apply Patches" 601ms

And I click on "Confirm" 653ms

Then I should see a "1 patch update has been scheduled for" text 70ms

When I wait for "virgo-dummy-2.0-1.1" to be installed on "ssh_minion" 28s 694ms

Then vendor change should be enabled for package actions on "ssh_minion" 1s 1ms

Given I am on the Systems overview page of this "ssh_minion" 1s 124ms

When I follow "Software" in the content area 74ms

And I follow "Packages" 429ms

And I follow "Install" 624ms

And I enter "andromeda" as the filtered package name 79ms

And I click on the filter button 531ms

And I check "andromeda-dummy-2.0-1.1" in the list 55ms

And I click on "Install Packages" 581ms

And I click on "Confirm" 681ms

Then I should see a "1 package install has been scheduled" text 63ms

When I wait for "andromeda-dummy-2.0-1.1" to be installed on "ssh_minion" 45s 751ms

Then vendor change should be enabled for package actions on "ssh_minion" 1s 34ms

When I disable repository "test_repo_rpm_pool" on this "ssh_minion" 586ms

When I remove package "virgo-dummy" from this "ssh_minion" without error control 1s 453ms

And I refresh the metadata for "ssh_minion" 832ms

And I refresh packages list via spacecmd on "ssh_minion" 6s 499ms

And I wait until refresh package list on "ssh_minion" is finished 35s 831ms

When I remove package "andromeda-dummy" from this "ssh_minion" without error control 1s 233ms

And I refresh the metadata for "ssh_minion" 864ms

And I refresh packages list via spacecmd on "ssh_minion" 7s 133ms

And I wait until refresh package list on "ssh_minion" is finished 26s 257ms

Given I am authorized for the "Admin" section 448ms

When I deploy testing playbooks and inventory files to "ssh_minion" 3s 698ms

Given I am on the Systems overview page of this "ssh_minion" 0s

When I follow "Software" in the content area 0s

And I follow "Software Channels" in the content area 0s

And I check "SLE-Module-Python3-15-SP7-Pool for x86_64" by label 0s

And I click on "Next" 0s

And I click on "Confirm" 0s

And I wait until I see "Changing the channels has been scheduled." text 0s

And I follow "scheduled" 0s

And I wait until I see "1 system successfully completed this action" text, refreshing the page 0s

Given I am on the Systems overview page of this "ssh_minion" 985ms

When I follow "Properties" in the content area 72ms

And I check "ansible_control_node" 79ms

And I click on "Update Properties" 1s 477ms

Then I wait until I see "Ansible Control Node type has been applied." text 93ms

Event Details: Failed to apply state(s): highstate ---------- ID: sync_states Function: saltutil.sync_states Name: sync_states Result: true Comment: No updates to sync Started: 18:49:49.829411 Duration: 1165.542 SLS: util.syncstates Changed: {} ---------- ID: mgr_absent_ca_package Function: pkg.removed Name: rhn-org-trusted-ssl-cert Result: true Comment: All specified packages are already absent Started: 18:49:52.091392 Duration: 894.644 SLS: certs Changed: {} ---------- ID: mgr_ca_cert Function: file.managed Name: /etc/pki/trust/anchors/RHN-ORG-TRUSTED-SSL-CERT Result: true Comment: File /etc/pki/trust/anchors/RHN-ORG-TRUSTED-SSL-CERT is in the correct state Started: 18:49:52.988558 Duration: 80.764 SLS: certs Changed: {} ---------- ID: update-ca-certificates Function: cmd.run Name: /usr/sbin/update-ca-certificates Result: true Comment: State was not run because none of the onchanges reqs changed Started: 18:49:53.070335 Duration: 0.004 SLS: certs Changed: {} ---------- ID: mgr_proxy_ca_cert_symlink Function: file.symlink Name: /usr/share/rhn/RHN-ORG-TRUSTED-SSL-CERT Result: true Comment: onlyif condition is false Started: 18:49:53.070416 Duration: 628.335 SLS: certs Changed: {} ---------- ID: mgr_deploy_tools_uyuni_key Function: file.managed Name: /etc/pki/rpm-gpg/uyuni-tools-gpg-pubkey-0d20833e.key Result: true Comment: File /etc/pki/rpm-gpg/uyuni-tools-gpg-pubkey-0d20833e.key is in the correct state Started: 18:49:53.698860 Duration: 76.472 SLS: channels.gpg-keys Changed: {} ---------- ID: mgr_deploy_suse_addon_key Function: file.managed Name: /etc/pki/rpm-gpg/suse-addon-97a636db0bad8ecc.key Result: true Comment: File /etc/pki/rpm-gpg/suse-addon-97a636db0bad8ecc.key is in the correct state Started: 18:49:53.775430 Duration: 58.386 SLS: channels.gpg-keys Changed: {} ---------- ID: mgr_deploy_suse16_gpg_key Function: file.managed Name: /etc/pki/rpm-gpg/suse16-gpg-pubkey-09d9ea69.key Result: true Comment: File /etc/pki/rpm-gpg/suse16-gpg-pubkey-09d9ea69.key is in the correct state Started: 18:49:53.833928 Duration: 57.959 SLS: channels.gpg-keys Changed: {} ---------- ID: file_///etc/pki/rpm-gpg/uyuni-tools-gpg-pubkey-0d20833e.key Function: module.run Name: pkg.add_repo_key Result: true Comment: Module function pkg.add_repo_key executed Started: 18:49:53.892005 Duration: 42.284 SLS: channels.gpg-keys Changed: ret: true ---------- ID: file_///usr/lib/rpm/gnupg/keys/gpg-pubkey-29b700a4-62b07e22.asc Function: module.run Name: pkg.add_repo_key Result: true Comment: Module function pkg.add_repo_key executed Started: 18:49:53.934403 Duration: 42.663 SLS: channels.gpg-keys Changed: ret: true ---------- ID: mgrchannels_repo Function: file.managed Name: /etc/zypp/repos.d/susemanager:channels.repo Result: true Comment: File /etc/zypp/repos.d/susemanager:channels.repo is in the correct state Started: 18:49:53.977298 Duration: 182.615 SLS: channels Changed: {} ---------- ID: pkg_installed Function: pkg.installed Name: pkg_installed Result: true Comment: No packages to install provided Started: 18:49:54.160559 Duration: 0.723 SLS: packages.packages_1a9de2b5e7ab54723680280269f07476 Changed: {} ---------- ID: pkg_removed Function: pkg.removed Name: pkg_removed Result: true Comment: All specified packages are already absent Started: 18:49:54.161427 Duration: 10.419 SLS: packages.packages_1a9de2b5e7ab54723680280269f07476 Changed: {} ---------- ID: pkg_latest Function: pkg.latest Name: pkg_latest Result: true Comment: No packages to install provided Started: 18:49:54.172031 Duration: 0.559 SLS: packages.packages_1a9de2b5e7ab54723680280269f07476 Changed: {} ---------- ID: disable_spacewalksd Function: service.dead Name: rhnsd Result: true Comment: The named service rhnsd is not available Started: 18:49:54.172651 Duration: 15.495 SLS: services.salt-minion Changed: {} ---------- ID: disable_spacewalk-update-status Function: service.dead Name: spacewalk-update-status Result: true Comment: The named service spacewalk-update-status is not available Started: 18:49:54.188255 Duration: 10.532 SLS: services.salt-minion Changed: {} ---------- ID: disable_osad Function: service.dead Name: osad Result: true Comment: The named service osad is not available Started: 18:49:54.198908 Duration: 11.808 SLS: services.salt-minion Changed: {} ---------- ID: remove_traditional_stack_all Function: pkg.removed Name: remove_traditional_stack_all Result: true Comment: All specified packages are already absent Started: 18:49:54.210817 Duration: 10.093 SLS: services.salt-minion Changed: {} ---------- ID: remove_traditional_stack Function: pkg.removed Name: remove_traditional_stack Result: true Comment: All specified packages are already absent Started: 18:49:54.220984 Duration: 43.172 SLS: services.salt-minion Changed: {} ---------- ID: logrotate_configuration Function: file.managed Name: /etc/logrotate.d/salt-ssh Result: true Comment: File /etc/logrotate.d/salt-ssh is in the correct state Started: 18:49:54.264245 Duration: 73.434 SLS: services.salt-minion Changed: {} ---------- ID: /etc/sysconfig/rhn/systemid Function: file.managed Name: /etc/sysconfig/rhn/systemid Result: true Comment: File /etc/sysconfig/rhn/systemid exists with proper permissions. No changes made. Started: 18:49:54.337773 Duration: 1.383 SLS: services.salt-minion Changed: {} ---------- ID: mgr_ansible_installed Function: pkg.installed Name: mgr_ansible_installed Result: false Comment: An error was encountered while installing package(s): Zypper command failure: Running as unit: run-p21262-i21263.scope; invocation ID: 0183fab903a7487b99a7f236df3ef22f Package 'ansible' not found.Loading repository data... Reading installed packages... Started: 18:49:54.339222 Duration: 1663.196 SLS: ansible Changed: {}

Given I am on the Systems overview page of this "ssh_minion" 1s 75ms

When I follow "States" in the content area 71ms

And I click on "Apply Highstate" 61ms

And I wait until event "Apply highstate scheduled" is completed 1m 14s 884ms Show Error +
                                            
unknown error - Event failed (SystemCallError) ./features/step_definitions/navigation_steps.rb:107:in `block (2 levels) in (top (required))' ./features/support/commonlib.rb:100:in `block in repeat_until_timeout' ./features/support/commonlib.rb:89:in `repeat_until_timeout' ./features/step_definitions/navigation_steps.rb:99:in `/^I wait at most (\d+) seconds until the event is completed, refreshing the page$/' ./features/step_definitions/common_steps.rb:157:in `/^I wait (\d+) seconds until the event is picked up and (\d+) seconds until the event "([^"]*)" is completed$/' ./features/step_definitions/common_steps.rb:174:in `/^I wait at most (\d+) seconds until event "([^"]*)" is completed$/' ./features/step_definitions/common_steps.rb:151:in `/^I wait until event "([^"]*)" is completed$/' features/secondary/minssh_ansible_control_node.feature:38:in `I wait until event "Apply highstate scheduled" is completed'

Then "ansible" should be installed on "ssh_minion" 0s

19s 173ms Show Info +
18:49:14:000 - 18:50:31:000 | Current URL: https://uyuni-master-server.sumaci.aws/rhn/systems/details/history/Event.do?sid=1000010024&aid=372
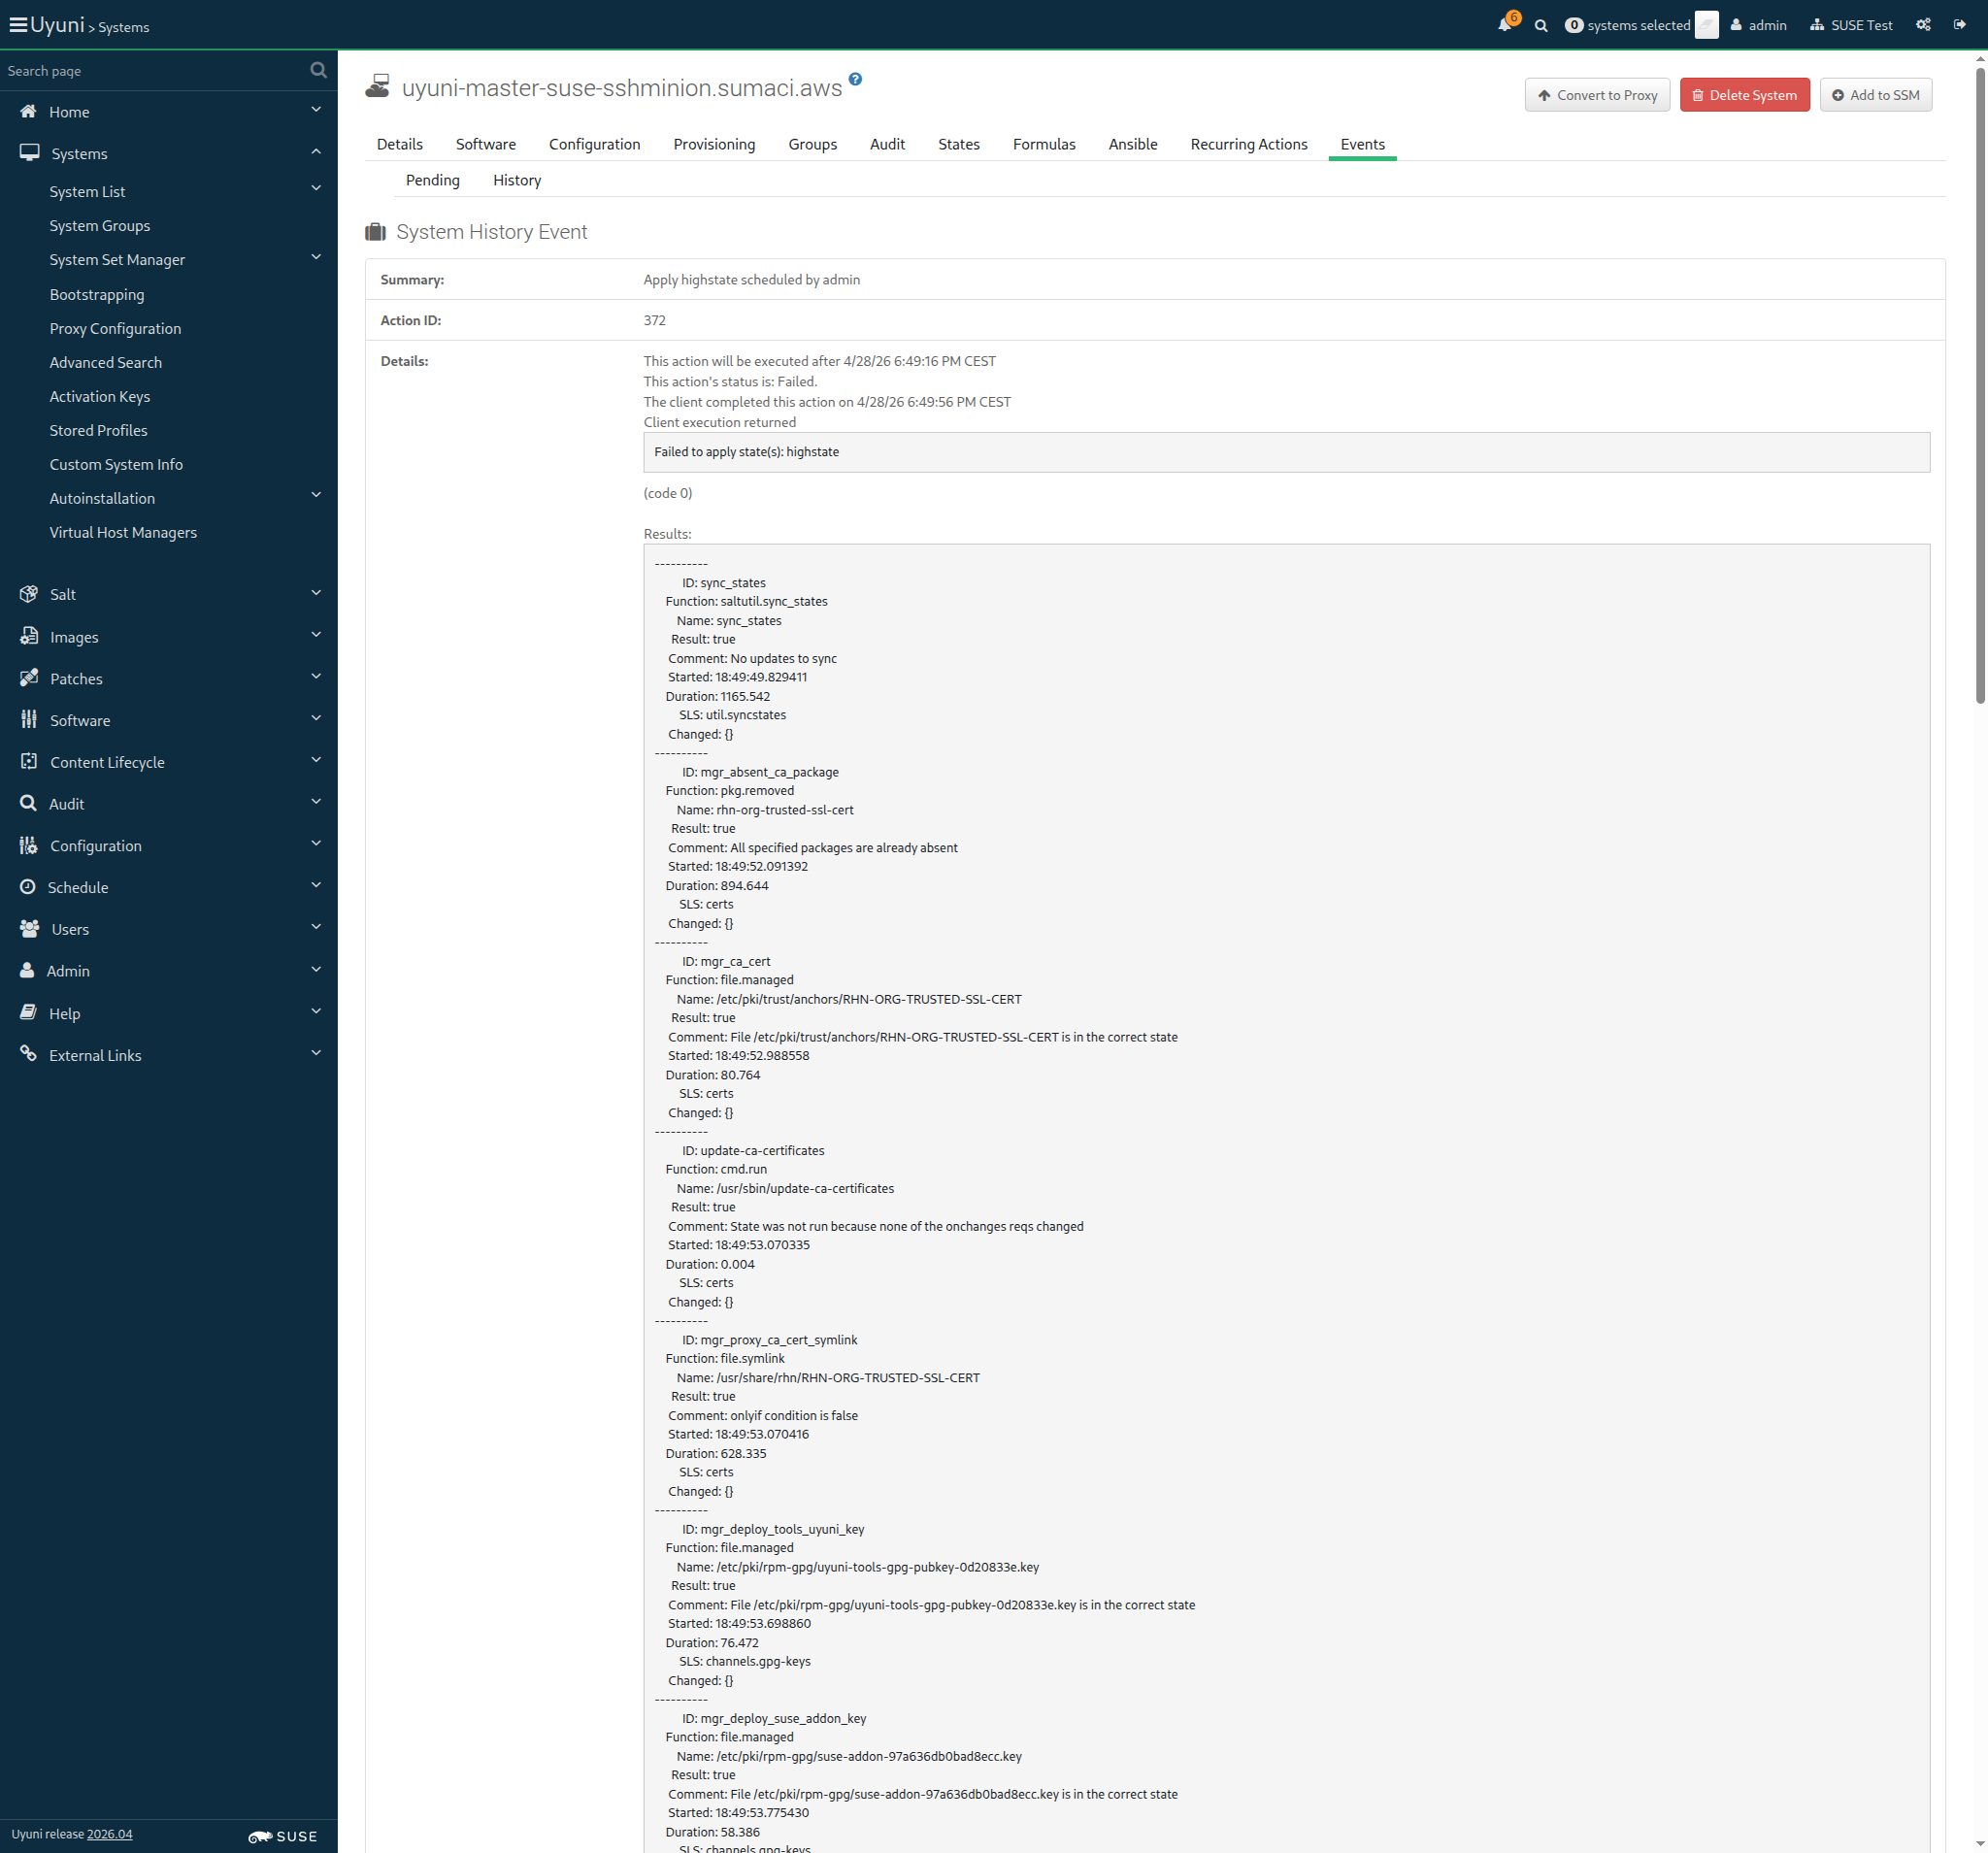
Screenshot +


Given I am on the Systems overview page of this "ssh_minion" 960ms

When I follow "Ansible" in the content area 89ms

Then I should see a "Ansible Control Node Configuration" text 66ms

Given I am on the Systems overview page of this "ssh_minion" 981ms

When I follow "Ansible" in the content area 78ms

Then I should see a "Ansible Control Node Configuration" text 63ms

And I enter "/srv/playbooks/" as "new_playbook_path_input" 148ms

And I click on "new_playbook_path_save" 69ms

And I enter "/srv/playbooks/orion_dummy/hosts" as "new_inventory_path_input" 128ms

And I click on "new_inventory_path_save" 79ms

Given I am on the Systems overview page of this "ssh_minion" 982ms

When I follow "Ansible" in the content area 76ms

And I follow "Inventories" in the content area 83ms

And I wait until I see "/srv/playbooks/orion_dummy/hosts" text 382ms

And I click on the inventory accordion for "/srv/playbooks/orion_dummy/hosts" 59ms

Then I wait until I see "myself" text 4m 10s 63ms Show Error +
                                            
Text 'myself' not found (ScriptError) ./features/step_definitions/navigation_steps.rb:40:in `/^I wait until I see "([^"]*)" text$/' features/secondary/minssh_ansible_control_node.feature:61:in `I wait until I see "myself" text'

20s 527ms Show Info +
18:50:54:000 - 18:55:07:000 | Current URL: https://uyuni-master-server.sumaci.aws/rhn/manager/systems/details/ansible/inventories?sid=1000010024&
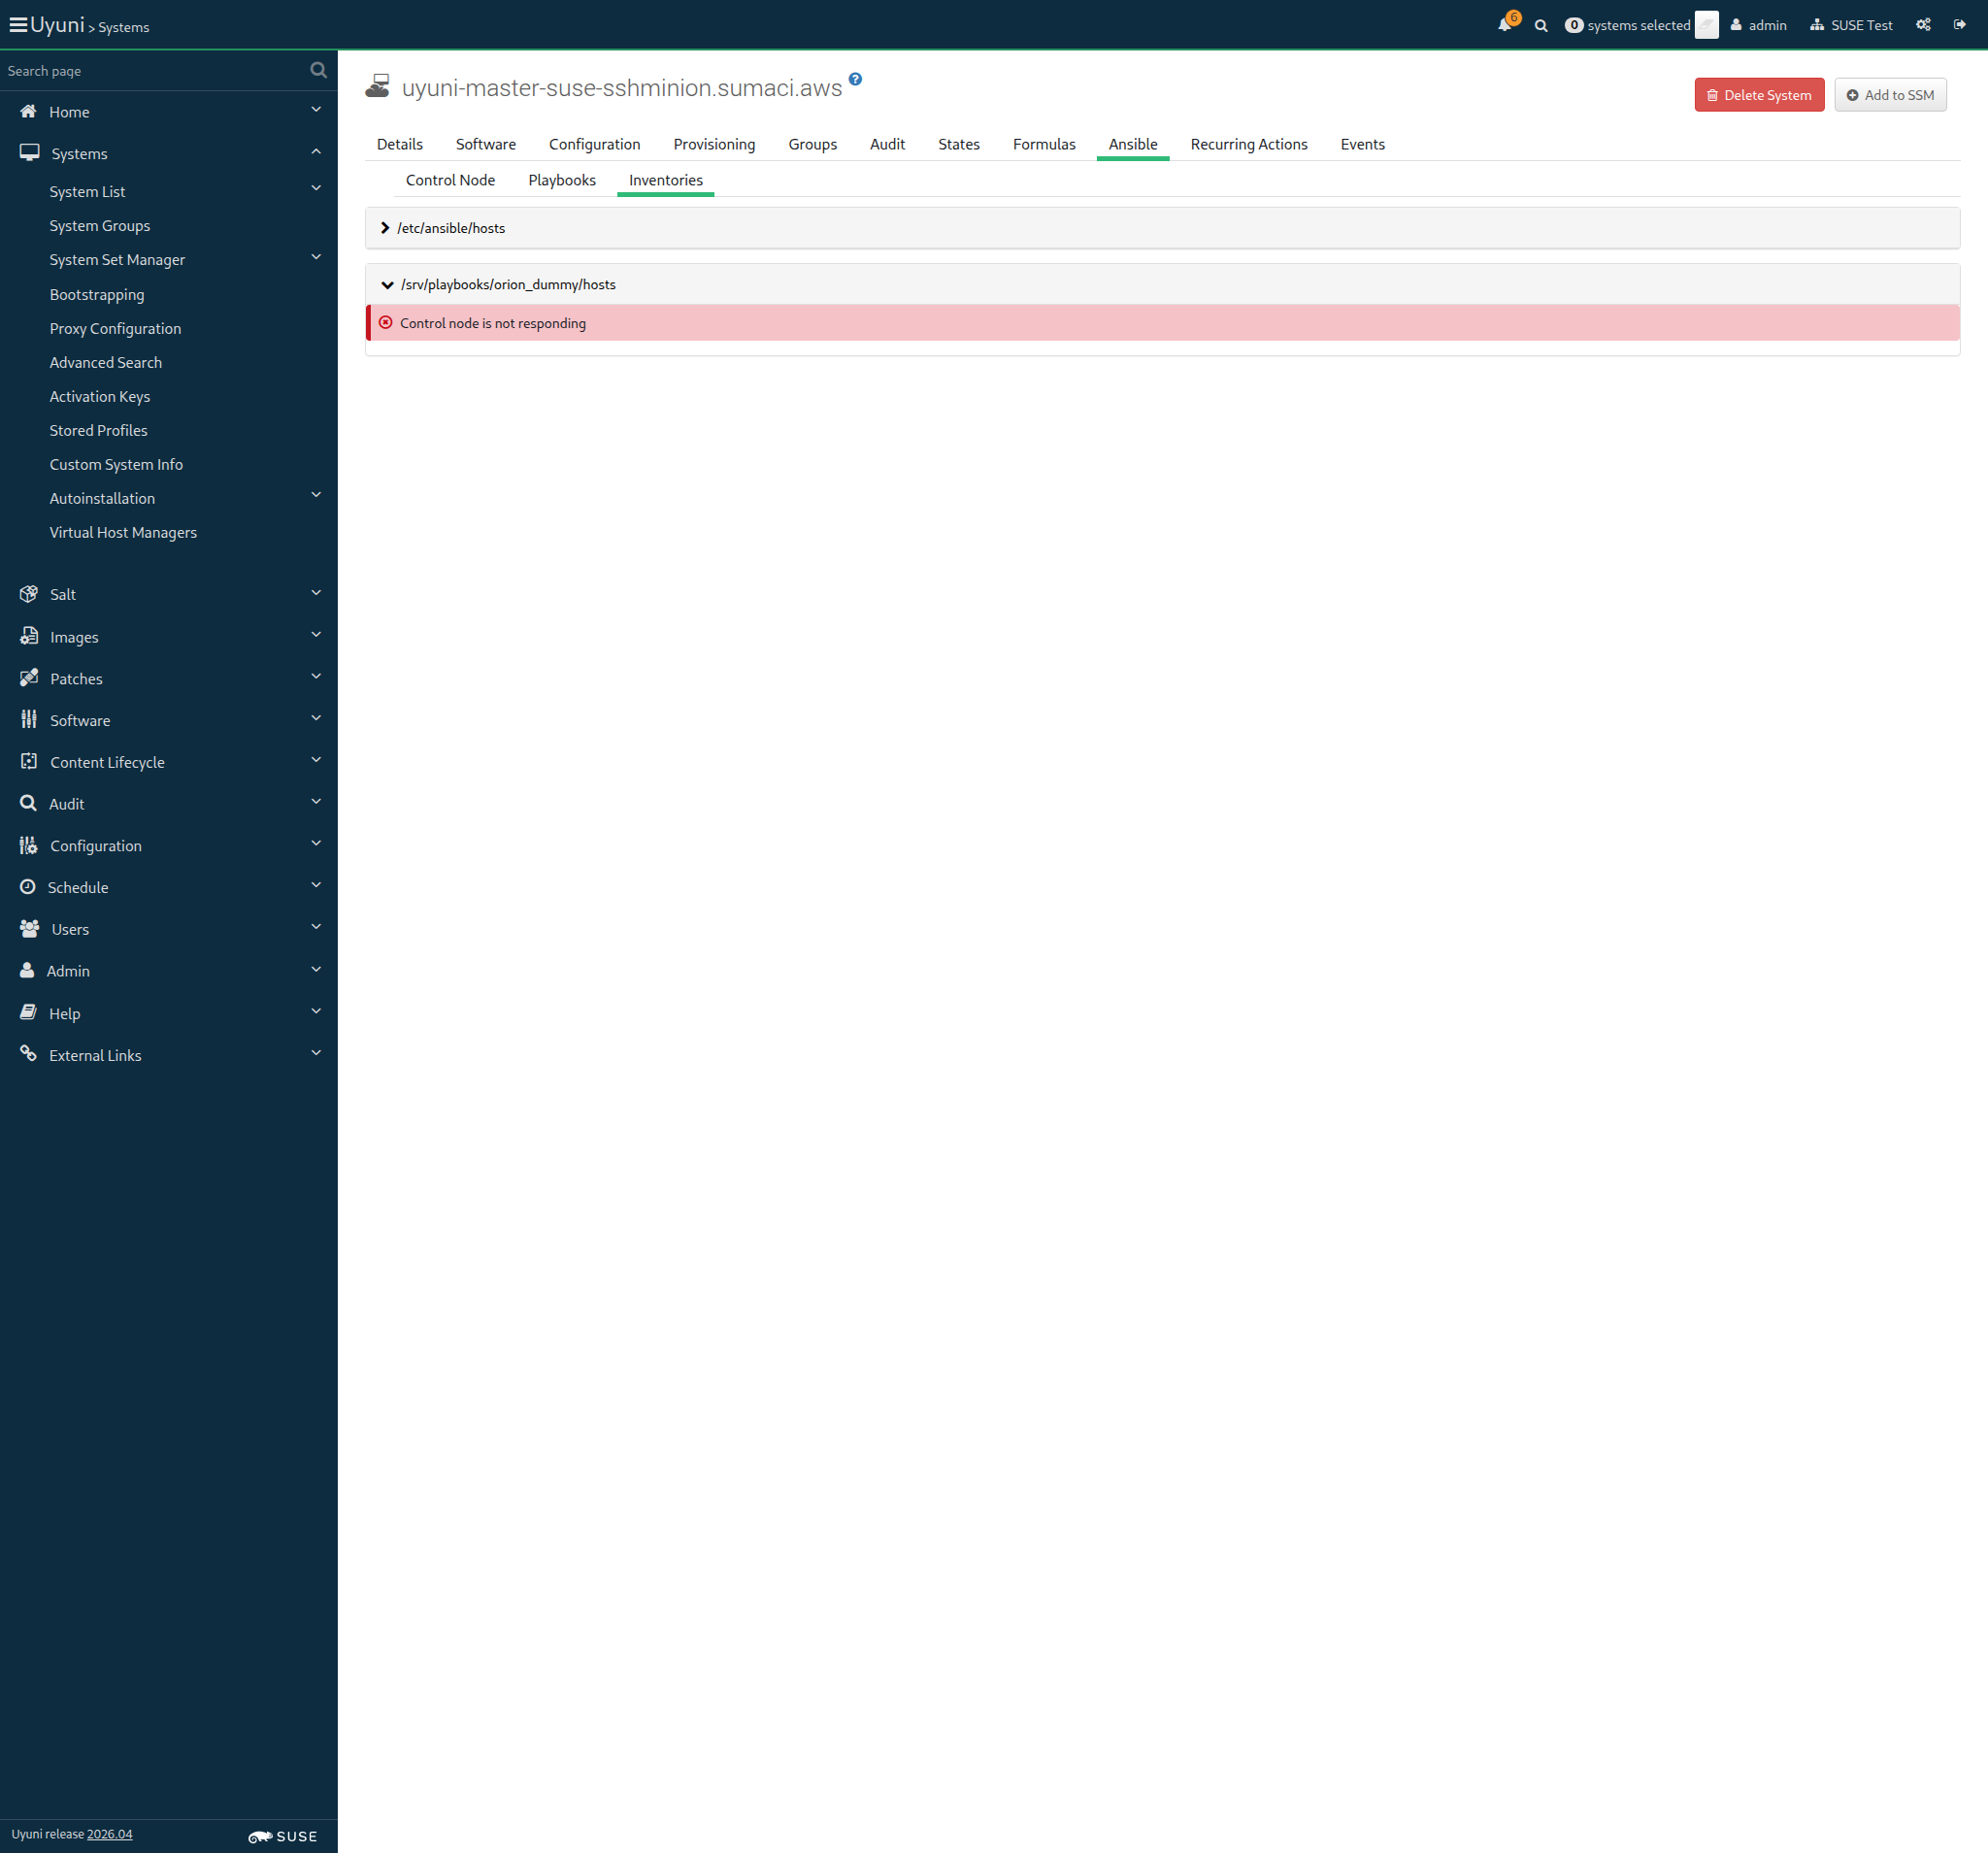
Screenshot +


Given I am on the Systems overview page of this "ssh_minion" 1s 33ms

When I follow "Ansible" in the content area 77ms

And I follow "Playbooks" in the content area 69ms

And I wait until I see "/srv/playbooks" text 258ms

And I click on "/srv/playbooks" 59ms

Then I wait until I see "/srv/playbooks/orion_dummy/playbook_orion_dummy.yml" text 4m 10s 7ms Show Error +
                                            
Text '/srv/playbooks/orion_dummy/playbook_orion_dummy.yml' not found (ScriptError) ./features/step_definitions/navigation_steps.rb:40:in `/^I wait until I see "([^"]*)" text$/' features/secondary/minssh_ansible_control_node.feature:69:in `I wait until I see "/srv/playbooks/orion_dummy/playbook_orion_dummy.yml" text'

19s 970ms Show Info +
18:55:27:000 - 18:59:40:000 | Current URL: https://uyuni-master-server.sumaci.aws/rhn/manager/systems/details/ansible/playbooks?sid=1000010024&
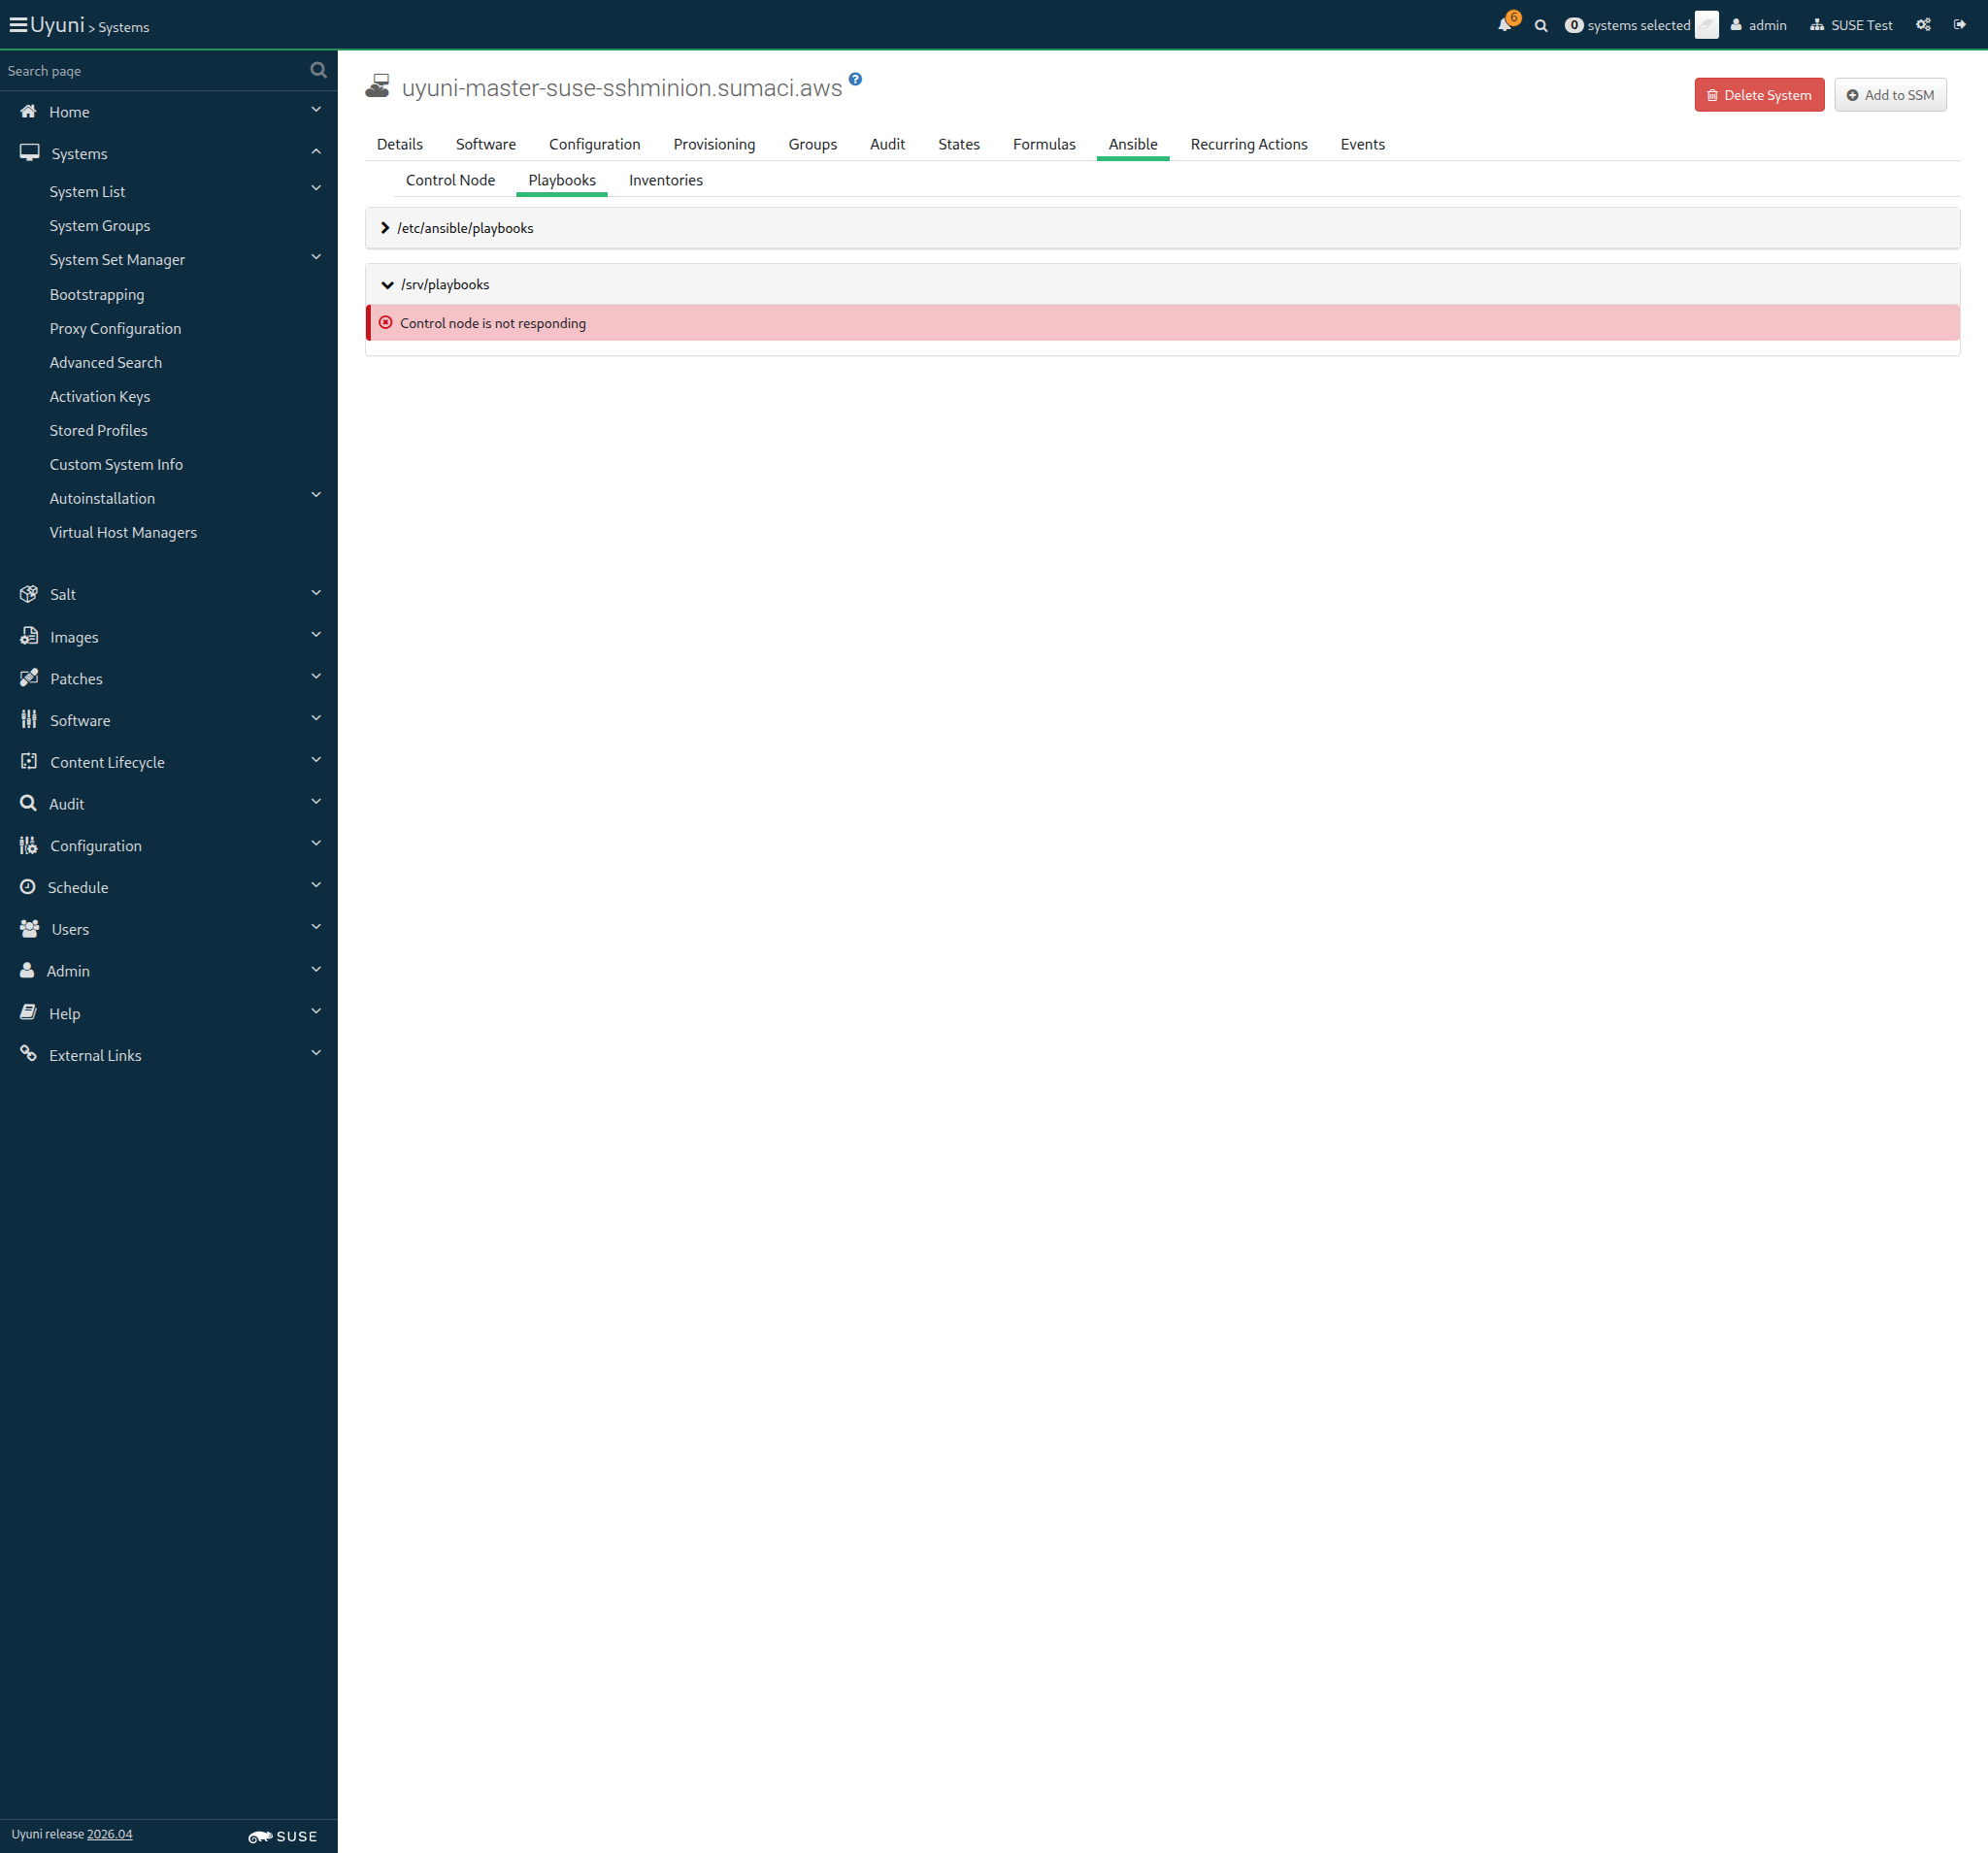
Screenshot +


Given I am on the Systems overview page of this "ssh_minion" 1s 73ms

When I follow "Ansible" in the content area 78ms

And I follow "Playbooks" in the content area 68ms

And I wait until I see "/srv/playbooks" text 243ms

And I click on "/srv/playbooks" 73ms

And I wait until I see "/srv/playbooks/orion_dummy/playbook_orion_dummy.yml" text 4m 9s 996ms Show Error +
                                            
Text '/srv/playbooks/orion_dummy/playbook_orion_dummy.yml' not found (ScriptError) ./features/step_definitions/navigation_steps.rb:40:in `/^I wait until I see "([^"]*)" text$/' features/secondary/minssh_ansible_control_node.feature:77:in `I wait until I see "/srv/playbooks/orion_dummy/playbook_orion_dummy.yml" text'

And I click on "orion_dummy/playbook_orion_dummy.yml" 0s

And I wait until I see "Playbook Content" text 0s

And I select "/srv/playbooks/orion_dummy/hosts" from "inventory-path-select" 0s

And I click on "Schedule" 0s

Then I should see a "Playbook execution has been scheduled" text 0s

And I wait until event "Execute playbook 'playbook_orion_dummy.yml' scheduled" is completed 0s

And file "/tmp/file.txt" should exist on "ssh_minion" 0s

19s 674ms Show Info +
19:00:00:000 - 19:04:12:000 | Current URL: https://uyuni-master-server.sumaci.aws/rhn/manager/systems/details/ansible/playbooks?sid=1000010024&
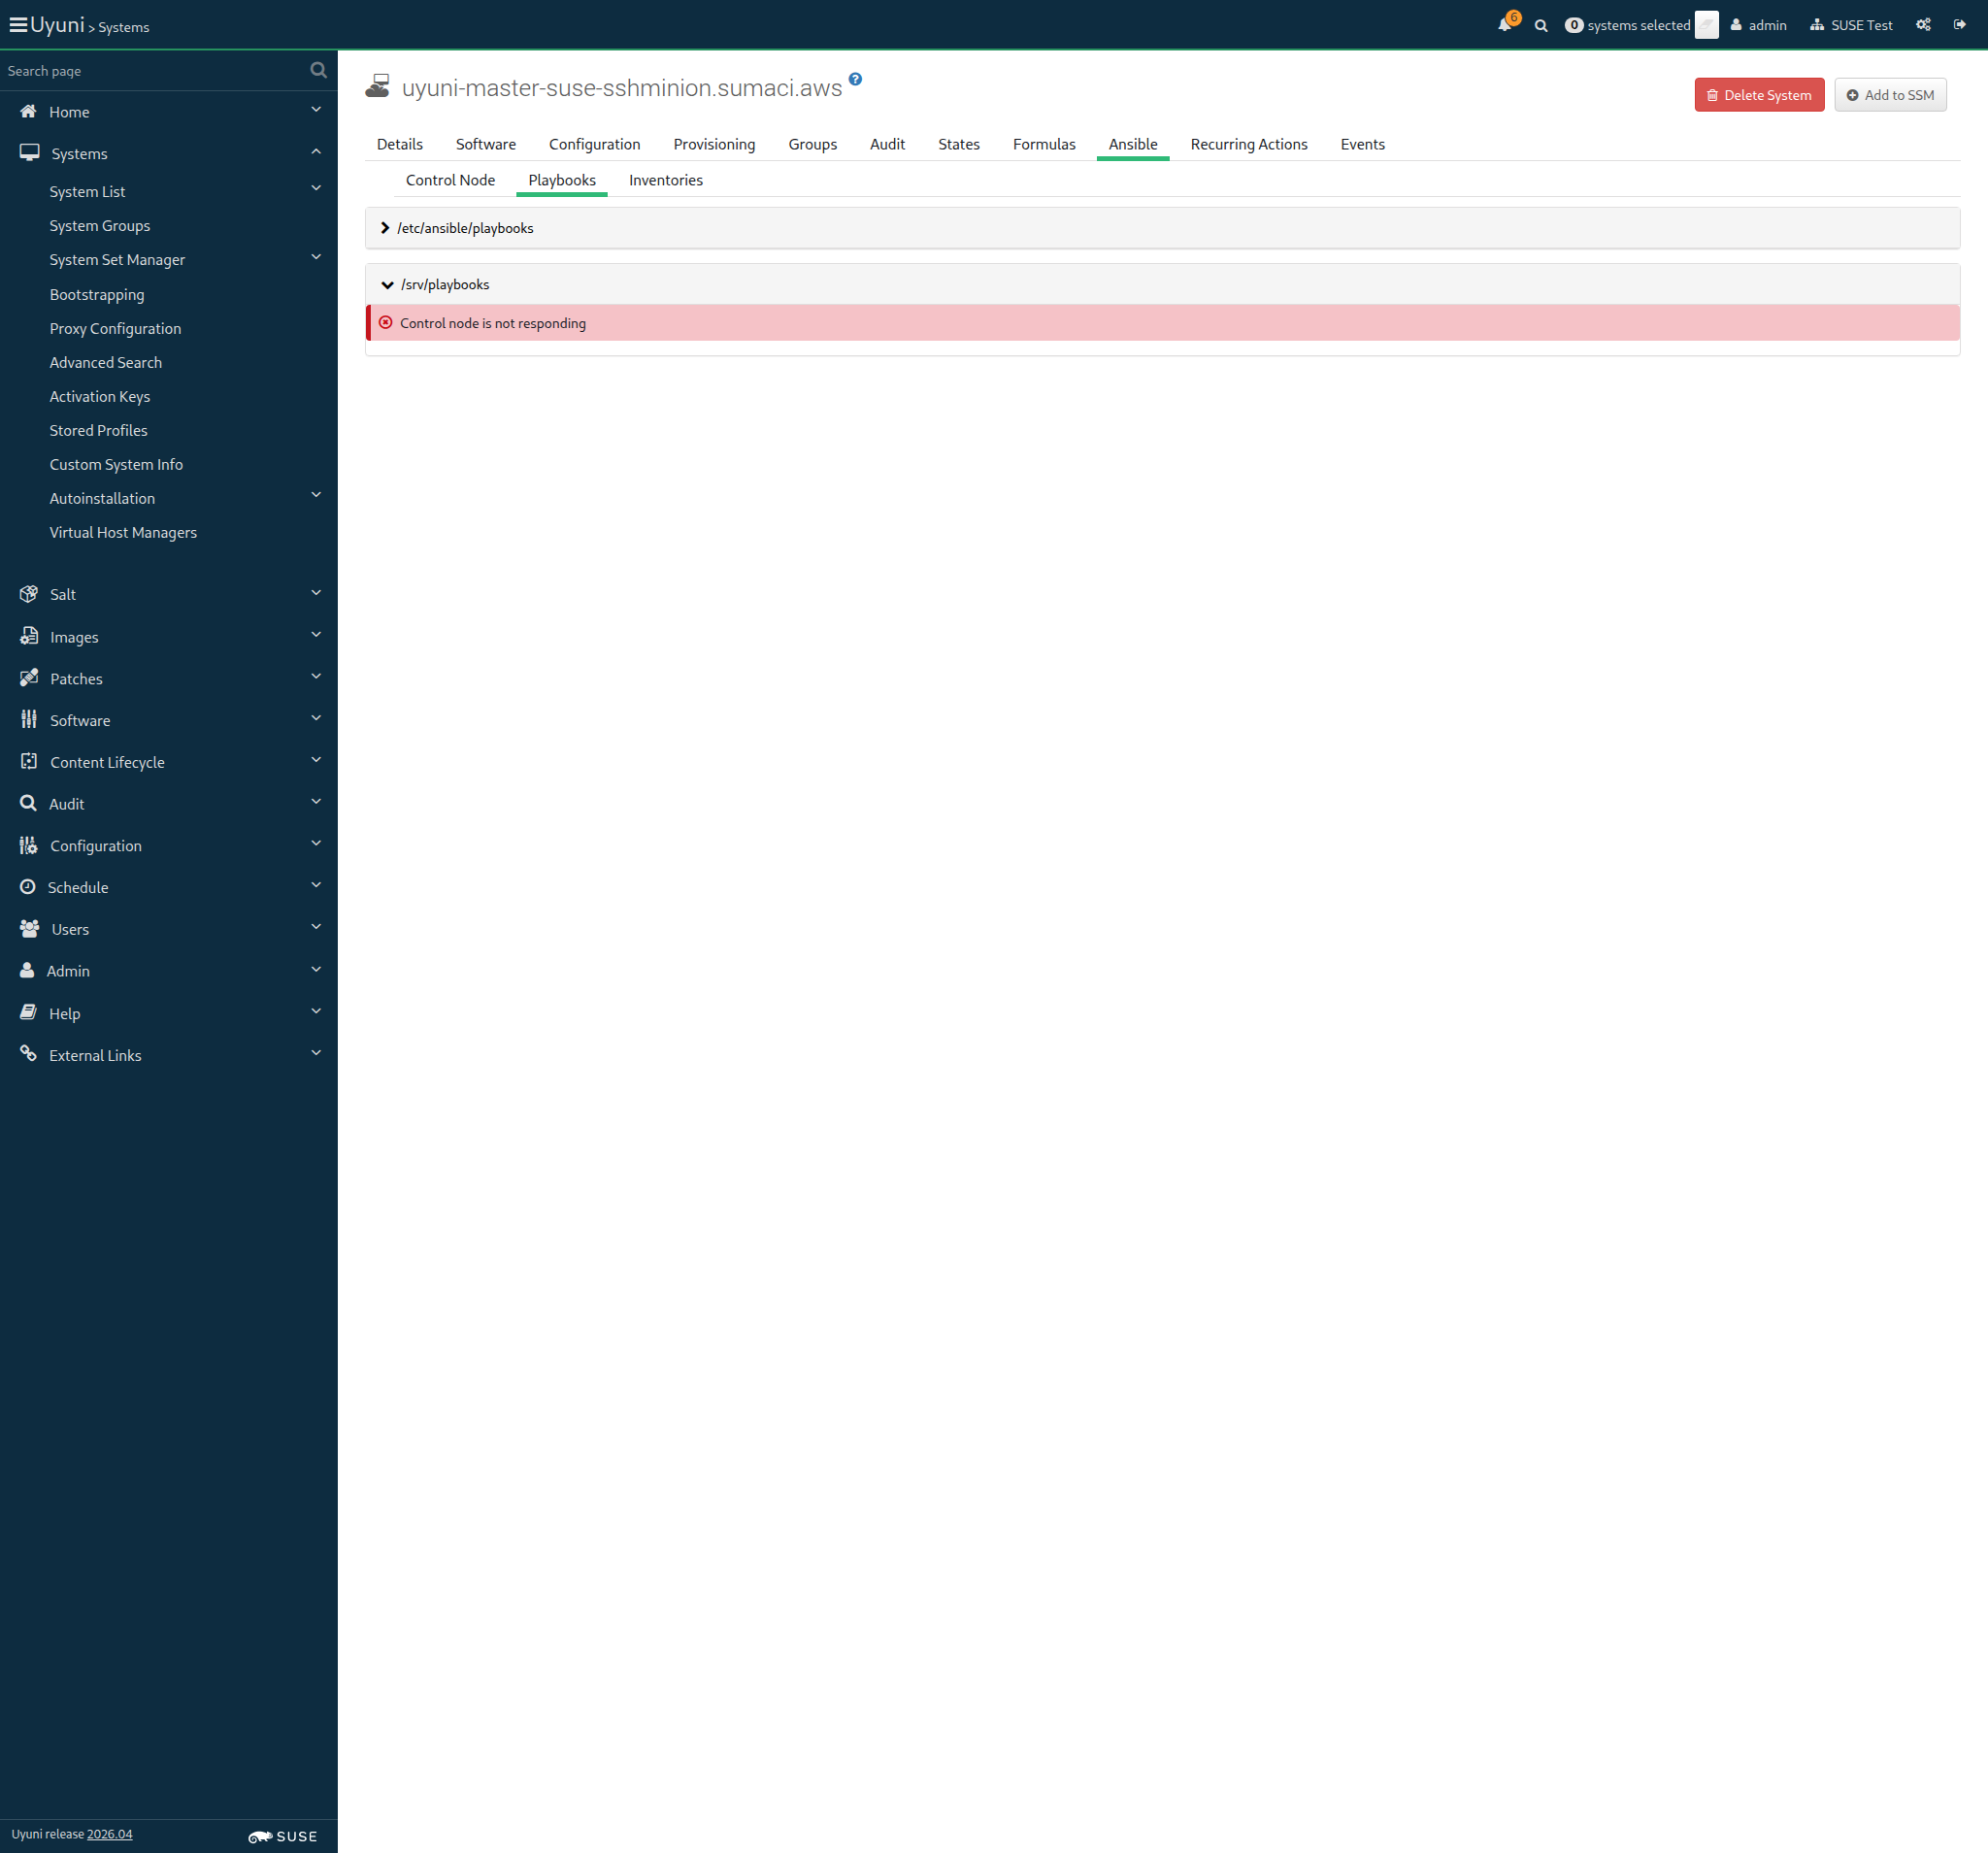
Screenshot +


Given I am on the Systems overview page of this "ssh_minion" 1s 155ms

When I follow "Properties" in the content area 75ms

And I uncheck "ansible_control_node" 10s 71ms

And I click on "Update Properties" 1s 212ms

Then I should see a "System properties changed" text 93ms

And I remove package "orion-dummy" from this "ssh_minion" without error control 1s 62ms

And I remove "/tmp/file.txt" from "ssh_minion" 384ms

Given I am on the Systems overview page of this "ssh_minion" 0s

When I follow "Software" in the content area 0s

And I follow "Software Channels" in the content area 0s

And I uncheck "SLE-Module-Python3-15-SP7-Pool for x86_64" by label 0s

And I click on "Next" 0s

And I click on "Confirm" 0s

And I wait until I see "Changing the channels has been scheduled." text 0s

And I follow "scheduled" 0s

And I wait until I see "1 system successfully completed this action" text, refreshing the page 0s

Given I am on the Systems overview page of this "ssh_minion" 1s 50ms

When I follow "Properties" in the content area 74ms

And I uncheck "ansible_control_node" 10s 29ms

And I click on "Update Properties" 1s 258ms

Given I am on the Systems overview page of this "ssh_minion" 1s 196ms

When I follow "States" in the content area 74ms

And I click on "Apply Highstate" 61ms

And I wait until event "Apply highstate scheduled" is completed 38s 528ms

In order to monitor Uyuni server
As an authorized user
I want to enable Prometheus exporters

Given I am on the Systems overview page of this "deblike_minion" 1s 669ms

When I follow "Formulas" in the content area 78ms

Then I should see a "Choose formulas:" text 62ms

And I should see a "Monitoring" text 194ms

When I check the "prometheus-exporters" formula 74ms

And I click on "Save" 64ms

And I wait until I see "Formula saved" text 635ms

When I follow "Formulas" in the content area 63ms

And I follow "Prometheus Exporters" in the content area 275ms

And I click on "Expand All Sections" 194ms

Then I should see a "Enable and configure Prometheus exporters for managed systems." text 111ms

When I check "node" exporter 46ms

And I check "apache" exporter 87ms

And I check "postgres" exporter 89ms

And I click on "Save" 69ms

Then I should see a "Formula saved" text 1s 342ms

When I enable the repositories "tools_update_repo tools_pool_repo" on this "deblike_minion" without error control 1s 275ms

When I follow "States" in the content area 74ms

And I click on "Apply Highstate" 70ms

Then I should see a "Applying the highstate has been scheduled." text 567ms

And I wait until event "Apply highstate scheduled" is completed 55s 203ms

@skip_if_github_validation
Scenario:
Wait for services
814ms 3

When I wait until "node" exporter service is active on "deblike_minion" 410ms

And I wait until "apache" exporter service is active on "deblike_minion" 202ms

And I wait until "postgres" exporter service is active on "deblike_minion" 201ms

And I visit "Prometheus node exporter" endpoint of this "deblike_minion" 206ms

And I visit "Prometheus apache exporter" endpoint of this "deblike_minion" 201ms

And I visit "Prometheus postgres exporter" endpoint of this "deblike_minion" 206ms

When I follow "Formulas" in the content area 80ms

And I uncheck the "prometheus-exporters" formula 263ms

And I click on "Save" 65ms

Then I wait until I see "Formula saved" text 1s 127ms

When I follow "States" in the content area 68ms

And I click on "Apply Highstate" 60ms

Then I should see a "Applying the highstate has been scheduled." text 454ms

And I wait until event "Apply highstate scheduled" is completed 21s 874ms

When I disable the repositories "tools_update_repo tools_pool_repo" on this "deblike_minion" without error control 871ms

When I enable repository "test_repo_deb_pool" on this "deblike_minion" 200ms

And I run "apt update" on "deblike_minion" 796ms

And I remove package "orion-dummy" from this "deblike_minion" 254ms

And I install old package "virgo-dummy=1.0" on this "deblike_minion" 245ms

When I refresh packages list via spacecmd on "deblike_minion" 6s 518ms

And I wait until refresh package list on "deblike_minion" is finished 12s 229ms

Then spacecmd should show packages "virgo-dummy-1.0" installed on "deblike_minion" 7s 719ms

Given I am authorized for the "Admin" section 473ms

When I follow the left menu "Admin > Task Schedules" 155ms

And I follow "errata-cache-default" 1s 213ms

And I follow "errata-cache-bunch" 1s 317ms

Then I click on "Single Run Schedule" 1s 259ms

And I should see a "bunch was scheduled" text 270ms

Then I wait until the table contains "FINISHED" or "SKIPPED" followed by "FINISHED" in its first rows 2s 232ms

When I follow the left menu "Admin > Organizations" 77ms

And I follow first "SUSE Test" 223ms

And I follow first "Configuration" 221ms

And I check "staging_content_enabled" 42ms

And I click on "Update Organization" 383ms

Then I should see a "was successfully updated." text 64ms

Given I am on the Systems overview page of this "deblike_minion" 956ms

And I follow "Software" in the content area 73ms

And I follow "Packages" in the content area 65ms

And I follow "Install" in the content area 67ms

And I enter "orion-dummy-1.1-X" as the filtered package name 62ms

And I click on the filter button 509ms

When I check "orion-dummy-1.1-X" in the list 59ms

And I click on "Install Packages" 692ms

And I pick 3 minutes from now as schedule time 88ms

And I click on "Confirm" 673ms

Then I should see a "1 package install has been scheduled for" text 63ms

And I wait until the package "orion-dummy_1.1" has been cached on this "deblike_minion" 31s 438ms

And I wait for "orion-dummy-1.1" to be installed on "deblike_minion" 2m 20s 798ms

When I follow "Software" in the content area 65ms

And I follow "Patches" in the content area 65ms

And I enter "virgo" as the filtered synopsis 10s 6ms Show Error +
                                            
Unable to find css "input[placeholder='Filter by Synopsis: ']" (Capybara::ElementNotFound) ./features/step_definitions/navigation_steps.rb:966:in `/^I enter "([^"]*)" as the filtered synopsis$/' features/secondary/min_deblike_salt_install_with_staging.feature:66:in `I enter "virgo" as the filtered synopsis'

And I click on the filter button 0s

And I check "3456-1" in the list 0s

And I click on "Apply Patches" 0s

And I pick 3 minutes from now as schedule time 0s

And I click on "Confirm" 0s

Then I should see a "1 patch update has been scheduled for" text 0s

And I wait until the package "virgo-dummy_2.0" has been cached on this "deblike_minion" 0s

And I wait for "virgo-dummy-2.0" to be installed on "deblike_minion" 0s

18s 808ms Show Info +
19:11:06:000 - 19:11:17:000 | Current URL: https://uyuni-master-server.sumaci.aws/rhn/systems/details/ErrataList.do?sid=1000010009&
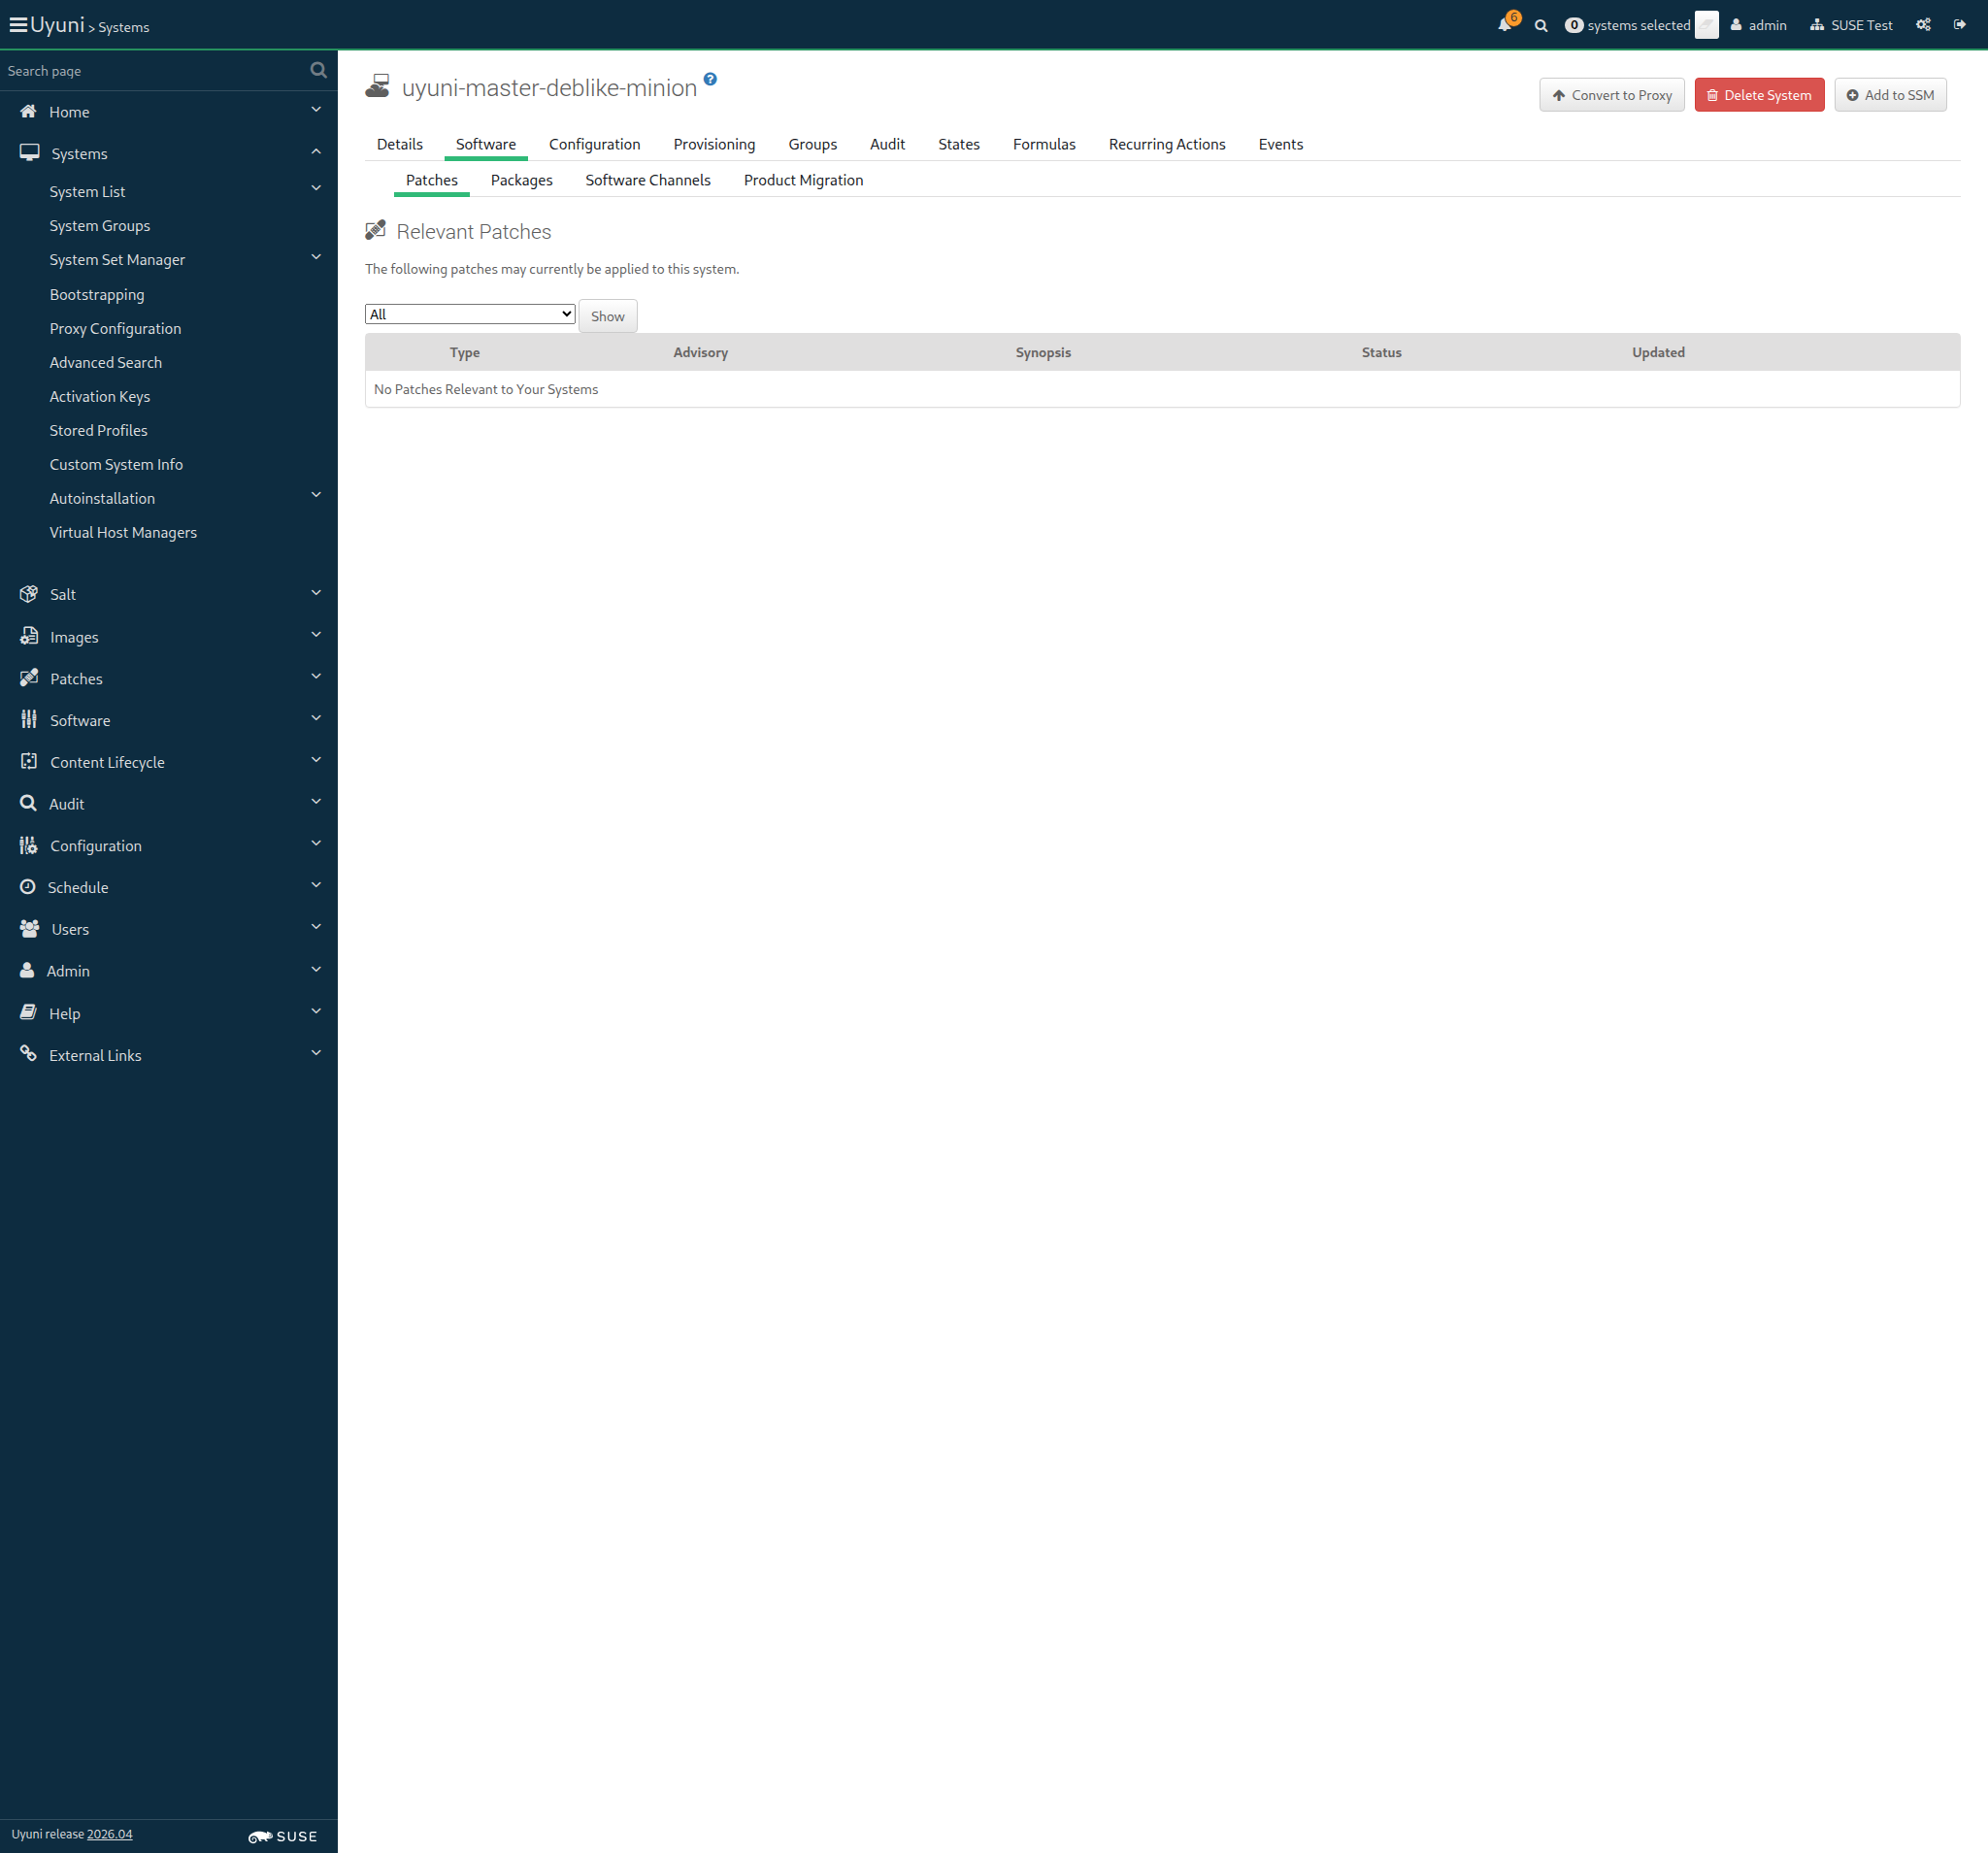
Screenshot +


And I remove package "orion-dummy" from this "deblike_minion" 1s 11ms

And I remove package "virgo-dummy" from this "deblike_minion" 333ms

And I disable repository "test_repo_deb_pool" on this "deblike_minion" 196ms

And I run "apt update" on "deblike_minion" 1s 17ms

When I enable repository "test_repo_deb_pool" on this "deblike_minion" 202ms

OUT: Ign:1 http://mirror.sumaci.aws/repositories/systemsmanagement:/Uyuni:/Test-Packages:/Pool/deb InRelease Get:2 http://mirror.sumaci.aws/repositories/systemsmanagement:/Uyuni:/Test-Packages:/Pool/deb Release [1,026 B] Get:3 http://mirror.sumaci.aws/repositories/systemsmanagement:/Uyuni:/Test-Packages:/Pool/deb Release.gpg [522 B] Ign:4 https://uyuni-master-proxy.sumaci.aws:443/rhn/manager/download fake-base-channel-debian-like/ InRelease Hit:5 https://uyuni-master-proxy.sumaci.aws:443/rhn/manager/download fake-base-channel-debian-like/ Release Ign:6 https://uyuni-master-proxy.sumaci.aws:443/rhn/manager/download fake-base-channel-debian-like/ Release.gpg Get:7 http://mirror.sumaci.aws/repositories/systemsmanagement:/Uyuni:/Test-Packages:/Pool/deb Packages [785 B] Fetched 2,333 B in 0s (6,584 B/s) Reading package lists... Building dependency tree... Reading state information... 2 packages can be upgraded. Run 'apt list --upgradable' to see them. WARNING: apt does not have a stable CLI interface. Use with caution in scripts.

When I run "apt update" on "deblike_minion" with logging 822ms

And I install old package "virgo-dummy=1.0" on this "deblike_minion" 1s 875ms

When I remove package "andromeda-dummy" from this "deblike_minion" 331ms

Given I am on the Systems overview page of this "deblike_minion" 1s 410ms

When I follow "Software" in the content area 75ms

And I click on "Update Package List" 992ms

And I follow "Events" in the content area 67ms

And I wait until I do not see "Package List Refresh scheduled" text, refreshing the page 24s 166ms

And I wait until package "virgo-dummy" is installed on "deblike_minion" via spacecmd 6s 379ms

And I wait until package "andromeda-dummy" is removed from "deblike_minion" via spacecmd 8s 791ms

When I follow "Software" in the content area 63ms

And I follow "Patches" in the content area 66ms

When I check "3456-1" in the list 10s 1ms Show Error +
                                            
Unable to find xpath "//table/tbody/tr[.//td[contains(.,'3456-1')]]//input[@type='checkbox']" (Capybara::ElementNotFound) ./features/support/navigation_step_helper.rb:32:in `toggle_checkbox_in_list' ./features/support/navigation_step_helper.rb:10:in `toggle_checkbox_in_package_list' ./features/step_definitions/navigation_steps.rb:1038:in `/^I (check|uncheck) "([^"]*)"(| last version) in the list$/' features/secondary/min_deblike_salt_install_package_and_patch.feature:34:in `I check "3456-1" in the list'

And I click on "Apply Patches" 0s

And I click on "Confirm" 0s

Then I should see a "1 patch update has been scheduled for" text 0s

And I wait for "virgo-dummy-2.0" to be installed on "deblike_minion" 0s

19s 757ms Show Info +
19:12:35:000 - 19:12:46:000 | Current URL: https://uyuni-master-server.sumaci.aws/rhn/systems/details/ErrataList.do?sid=1000010009&
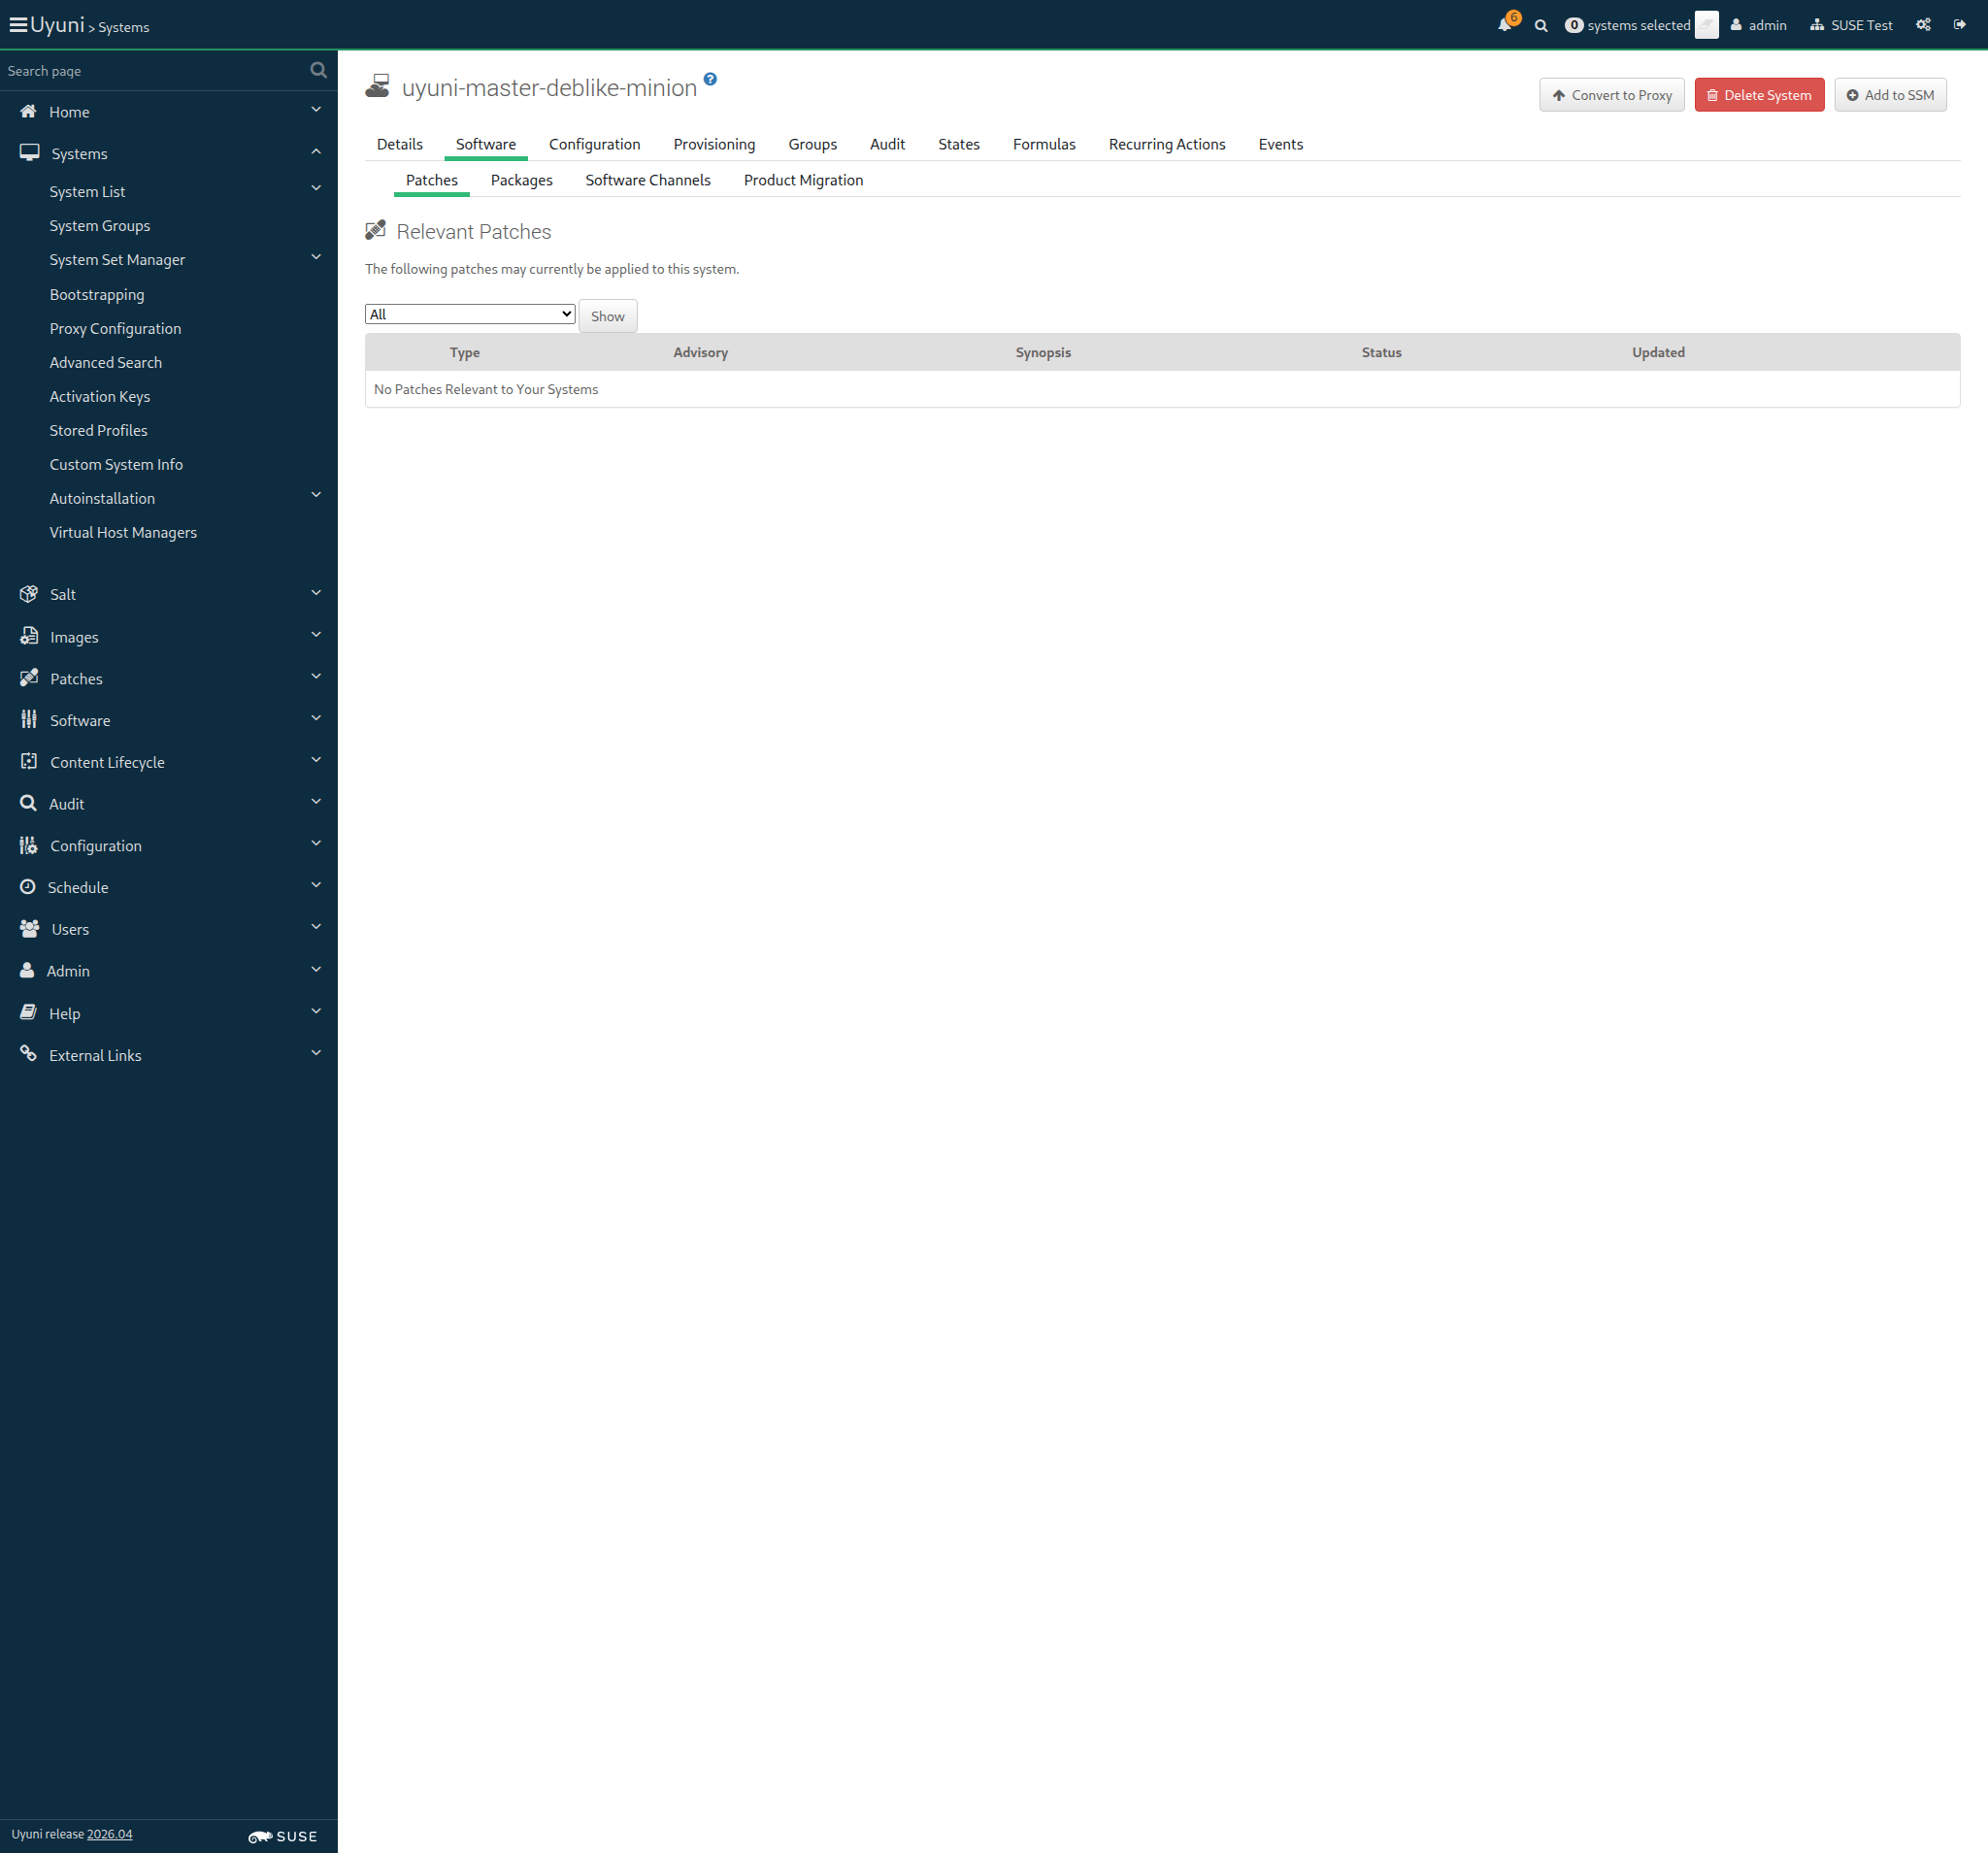
Screenshot +


When I follow "Software" in the content area 0s

And I follow "Install" 0s

And I check "andromeda-dummy-2.0" in the list 0s

And I click on "Install Packages" 0s

And I click on "Confirm" 0s

And I should see a "1 package install has been scheduled for" text 0s

When I wait until event "Package Install/Upgrade scheduled" is completed 0s

Then Deb package "andromeda-dummy" with version "2.0" should be installed on "deblike_minion" 0s

When I follow "Software" in the content area 78ms

And I follow "Install" 507ms

And I check "andromeda-dummy-2.0" in the list 60ms

And I click on "Install Packages" 685ms

And I click on "Confirm" 685ms

And I should see a "1 package install has been scheduled for" text 66ms

When I wait until event "Package Install/Upgrade scheduled" is completed 21s 864ms

Then Deb package "andromeda-dummy" with version "2.0" should be installed on "deblike_minion" 884ms

When I disable repository "test_repo_deb_pool" on this "deblike_minion" 197ms

When I remove package "virgo-dummy" from this "deblike_minion" 333ms

OUT: Ign:1 https://uyuni-master-proxy.sumaci.aws:443/rhn/manager/download fake-base-channel-debian-like/ InRelease Hit:2 https://uyuni-master-proxy.sumaci.aws:443/rhn/manager/download fake-base-channel-debian-like/ Release Ign:3 https://uyuni-master-proxy.sumaci.aws:443/rhn/manager/download fake-base-channel-debian-like/ Release.gpg Reading package lists... Building dependency tree... Reading state information... 1 package can be upgraded. Run 'apt list --upgradable' to see it. WARNING: apt does not have a stable CLI interface. Use with caution in scripts.

When I remove package "andromeda-dummy" from this "deblike_minion" 340ms

And I run "apt update" on "deblike_minion" with logging 994ms

@skip_if_github_validation @sle_minion @scope_onboarding
Feature:Negative tests for bootstrapping normal minions 16s 499ms 5

In order to register only valid minions
As an authorized user
I want to avoid registration with invalid input parameters
The hostname of sle_minion is uyuni-master-suse-minion.sumaci.aws

When I follow the left menu "Systems > Bootstrapping" 127ms

Then I should see a "Bootstrap Minions" text 69ms

When I enter the hostname of "sle_minion" as "hostname" 144ms

And I enter "22" as "port" 52ms

And I enter "root" as "user" 59ms

And I enter "linux" as "password" 61ms

And I click on "Bootstrap" 65ms

And I wait until I see "A salt key for this host" text 264ms

Then I should not see a "GenericSaltError" text 63ms

And I should see a "seems to already exist, please check!" text 62ms

When I follow the left menu "Systems > Bootstrapping" 63ms

Then I should see a "Bootstrap Minions" text 68ms

When I enter "not-existing-name" as "hostname" 83ms

And I enter "22" as "port" 48ms

And I enter "root" as "user" 52ms

And I enter "linux" as "password" 55ms

And I click on "Bootstrap" 57ms

And I wait until I see "An error has occurred during salt execution: unable to establish ssh connection." text 2s 466ms

Then I should see a "Details" button 18ms

When I click on "Details" 77ms

And I wait at most 10 seconds until I see modal containing "Error Details" text 11ms

Then I should see a "Standard Error" text 67ms

And I should see "Could not resolve hostname not-existing-name: Name or service not known" in the stderr textarea 16ms

When I close the modal dialog 53ms

The hostname of localhost is uyuni-master-controller.sumaci.aws

When I follow the left menu "Systems > Bootstrapping" 63ms

Then I should see a "Bootstrap Minions" text 68ms

When I enter the hostname of "localhost" as "hostname" 122ms

And I enter "22" as "port" 46ms

And I enter "FRANZ" as "user" 55ms

And I enter "KAFKA" as "password" 56ms

And I click on "Bootstrap" 55ms

And I wait until I see "An error has occurred during salt execution: unable to establish ssh connection." text 8s 345ms

Then I should see a "Details" button 13ms

When I click on "Details" 65ms

And I wait at most 10 seconds until I see modal containing "Error Details" text 7ms

Then I should see a "Standard Error" text 72ms

And I should see "Permission denied (publickey" or "Password authentication failed" in the stderr textarea 13ms

When I close the modal dialog 45ms

The hostname of localhost is uyuni-master-controller.sumaci.aws

When I follow the left menu "Systems > Bootstrapping" 63ms

Then I should see a "Bootstrap Minions" text 80ms

When I enter the hostname of "localhost" as "hostname" 127ms

And I enter "11" as "port" 47ms

And I enter "root" as "user" 50ms

And I enter "linux" as "password" 53ms

And I click on "Bootstrap" 53ms

And I wait until I see "An error has occurred during salt execution: unable to establish ssh connection." text 2s 255ms

Then I should see a "Details" button 14ms

When I click on "Details" 58ms

And I wait at most 10 seconds until I see modal containing "Error Details" text 7ms

Then I should see a "Standard Error" text 77ms

And I should see "port 11: Connection refused" or "port 11: Network is unreachable" in the stderr textarea 14ms

When I close the modal dialog 45ms

@skip_if_github_validation @scope_formulas
Feature:Use salt formulas 4m 34s 230ms 20 2

In order to use simple forms to apply changes to minions
As an authorized user
I want to be able to install and use salt formulas

When I manually install the "locale" formula on the server 0s

When I synchronize all Salt dynamic modules on "sle_minion" 5s 266ms

When I follow the left menu "Salt > Formula Catalog" 136ms

Then I should see a "locale" text in the content area 231ms

Given I am on the Systems overview page of this "sle_minion" 967ms

When I follow "Formulas" in the content area 76ms

Then I should see a "Choose formulas:" text 62ms

And I should see a "General System Configuration" text 197ms

And I should see a "Locale" text 85ms

When I check the "locale" formula 79ms

And I click on "Save" 63ms

And I wait until I see "Formula saved." text 614ms

Then the "locale" formula should be checked 10s 25ms

When I follow "Formulas" in the content area 61ms

And I follow first "Locale" in the content area 423ms

And I click on "Expand All Sections" 254ms

And I select "Etc/GMT-5" in timezone name field 58ms

And I select "French" in language field 44ms

And I select "French (Canada)" in keyboard layout field 44ms

And I click on "Save Formula" 61ms

Then I should see a "Formula saved" text 726ms

When I refresh the pillar data 4s 461ms

Then the pillar data for "formulas" should be "- locale" on "sle_minion" 3s 430ms

And the pillar data for "timezone:name" should be "Etc/GMT-5" on "sle_minion" 3s 411ms

And the pillar data for "keyboard_and_language:keyboard_layout" should be "French (Canada)" on "sle_minion" 4s 498ms

And the pillar data for "keyboard_and_language:language" should be "French" on "sle_minion" 4s 134ms

Then the pillar data for "formulas" should be empty on "ssh_minion" 11s 732ms

And the pillar data for "timezone" should be empty on "ssh_minion" 9s 259ms

And the pillar data for "keyboard_and_language" should be empty on "ssh_minion" 9s 465ms

Given I am on the Systems overview page of this "sle_minion" 912ms

And I follow "States" in the content area 70ms

Then I should see the toggler "disabled" 11ms

When I click on the "disabled" toggler 46ms

And I click on "Apply Highstate" 85ms

Then I should see a "Applying the highstate has been scheduled." text 342ms

And I wait at most 300 seconds until event "Apply highstate in test-mode scheduled" is completed 21s 956ms

When I enable repository "sle_update_repo" on this "sle_minion" without error control 737ms

And I follow "States" in the content area 59ms

And I click on "Apply Highstate" 56ms

Then I should see a "Applying the highstate has been scheduled." text 514ms

When I wait until event "Apply highstate scheduled" is completed 22s 156ms

Then the timezone on "sle_minion" should be "+05" 701ms

And the keymap on "sle_minion" should be "ca" 411ms

And the language on "sle_minion" should be "fr_FR.UTF-8" 819ms

And I disable repository "sle_update_repo" on this "sle_minion" without error control 450ms

When I follow "Formulas" in the content area 78ms

And I follow first "Locale" in the content area 196ms

And I click on "Clear values" and confirm alert box 286ms

And I click on "Save Formula" 92ms

Then I should see a "Formula saved" text 586ms

When I refresh the pillar data 4s 900ms

Then the pillar data for "formulas" should be "- locale" on "sle_minion" 3s 445ms

And the pillar data for "timezone:name" should be "CET" on "sle_minion" 3s 462ms

And the pillar data for "keyboard_and_language:keyboard_layout" should be "English (US)" on "sle_minion" 3s 488ms

And the pillar data for "keyboard_and_language:language" should be "English (US)" on "sle_minion" 4s 989ms

And I follow "States" in the content area 69ms

And I click on "Apply Highstate" 61ms

Then I should see a "Applying the highstate has been scheduled." text 452ms

When I wait until event "Apply highstate scheduled" is completed 22s 128ms

Then the timezone on "sle_minion" should be "CET" 719ms

And the keymap on "sle_minion" should be "us" 405ms

And the language on "sle_minion" should be "en_US.UTF-8" 817ms

When I follow "Formulas" in the content area 78ms

Then I should see a "Choose formulas:" text 80ms

And I should see a "General System Configuration" text 218ms

And I should see a "Locale" text 90ms

When I uncheck the "locale" formula 76ms

And I click on "Save" 63ms

And I wait until I see "Formula saved." text 645ms

Then the "locale" formula should be unchecked 10s 32ms

When I refresh the pillar data 4s 181ms

Then the pillar data for "formulas" should be empty on "sle_minion" 4s 446ms

And the pillar data for "timezone" should be empty on "sle_minion" 4s 432ms

And the pillar data for "keyboard_and_language" should be empty on "sle_minion" 3s 398ms

When I follow the left menu "Systems > System Groups" 76ms

When I follow "Create Group" 222ms

And I enter "locale-formula-group" as "name" 77ms

And I enter "Test group with locale formula added" as "description" 83ms

And I click on "Create Group" 438ms

Then I should see a "System group locale-formula-group created." text 70ms

When I follow "Formulas" in the content area 77ms

Then I should see a "Choose formulas:" text 66ms

And I should see a "General System Configuration" text 193ms

And I should see a "Locale" text 91ms

When I check the "locale" formula 75ms

And I click on "Save" 62ms

And I wait until I see "Formula saved." text 482ms

And I follow "Target" 438ms

And I check the "sle_minion" client 63ms

And I click on "Add Systems" 1s 66ms

Then I should see a "1 systems were added to locale-formula-group server group." text 94ms

When I refresh the pillar data 4s 770ms

Then the pillar data for "formulas" should be "- locale" on "sle_minion" 3s 436ms

And the pillar data for "timezone:name" should be "CET" on "sle_minion" 3s 402ms

And the pillar data for "keyboard_and_language:keyboard_layout" should be "English (US)" on "sle_minion" 3s 435ms

And the pillar data for "keyboard_and_language:language" should be "English (US)" on "sle_minion" 4s 621ms

Then the pillar data for "formulas" should be empty on "ssh_minion" 9s 689ms

And the pillar data for "timezone" should be empty on "ssh_minion" 9s 312ms

And the pillar data for "keyboard_and_language" should be empty on "ssh_minion" 10s 673ms

When I follow the left menu "Systems > System Groups" 74ms

And I follow "locale-formula-group" in the content area 80ms

And I follow "Delete Group" in the content area 80ms

When I click on "Confirm Deletion" 1s 73ms

Then I should see a "System group" text 58ms

And I should see a "locale-formula-group" text 60ms

And I should see a "deleted" text 54ms

Given I am on the Systems overview page of this "sle_minion" 1s 408ms

And I follow "States" in the content area 67ms

And I click on "Apply Highstate" 64ms

Then I should see a "Applying the highstate has been scheduled." text 428ms

When I wait until event "Apply highstate scheduled" is completed 22s 65ms

Then the timezone on "sle_minion" should be "CET" 699ms

And the keymap on "sle_minion" should be "us" 400ms

And the language on "sle_minion" should be "en_US.UTF-8" 811ms

When I manually uninstall the "locale" formula from the server 0s

In order to use forms to apply changes to minions
As an authorized user
I want to be able to install and use Salt formulas

When I install "form.yml" to custom formula metadata directory "testform" 9s 24ms

And I install "metadata.yml" to custom formula metadata directory "testform" 6s 288ms

When I follow the left menu "Salt > Formula Catalog" 127ms

And I enter "testform" as the filtered formula name 80ms

Then I should see a "testform" text 65ms

When I follow the left menu "Systems > System Groups" 115ms

When I follow "Create Group" 211ms

And I enter "test-formula-group" as "name" 66ms

And I enter "Test group with testform formula added" as "description" 80ms

And I click on "Create Group" 63ms

Then I should see a "System group test-formula-group created." text 71ms

When I follow "Formulas" in the content area 73ms

Then I should see a "Choose formulas:" text 69ms

And I should see a "General System Configuration" text 194ms

And I should see a "Testform" text 88ms

When I check the "testform" formula 79ms

And I click on "Save" 66ms

And I wait until I see "Formula saved." text 497ms

And I follow "Target Systems" 419ms

And I check the "sle_minion" client 59ms

And I click on "Add Systems" 1s 299ms

Then I should see a "1 systems were added to test-formula-group server group." text 93ms

When I refresh the pillar data 4s 751ms

Then the pillar data for "testing:str" should be "" on "sle_minion" 3s 522ms

And the pillar data for "testing:str_def" should be "defvalue" on "sle_minion" 3s 401ms

And the pillar data for "testing:str_or_null" should be "None" on "sle_minion" 4s 582ms

And the pillar data for "testing" should not contain "str_opt" on "sle_minion" 3s 596ms

And the pillar data for "testing:num" should be "" on "sle_minion" 3s 477ms

And the pillar data for "testing:num_def" should be "0" on "sle_minion" 3s 510ms

And the pillar data for "testing:num_or_null" should be "None" on "sle_minion" 3s 453ms

And the pillar data for "testing" should not contain "num_opt" on "sle_minion" 5s 119ms

And the pillar data for "testing:pw" should be "" on "sle_minion" 3s 397ms

And the pillar data for "testing:pw_or_null" should be "None" on "sle_minion" 3s 407ms

And the pillar data for "testing" should not contain "pw_opt" on "sle_minion" 4s 833ms

And the pillar data for "testing:list_of_strings" should contain "def_item1" on "sle_minion" 3s 454ms

And the pillar data for "testing:list_of_strings" should contain "def_item2" on "sle_minion" 3s 428ms

And the pillar data for "testing:dict_of_strings:name1" should be "def_value1" on "sle_minion" 3s 443ms

And the pillar data for "testing:dict_of_strings:name2" should be "def_value2" on "sle_minion" 4s 657ms

And the pillar data for "testing:list_of_dicts:0:name" should be "def_user" on "sle_minion" 3s 433ms

And the pillar data for "testing:list_of_dicts:0:password" should be "secret1" on "sle_minion" 3s 507ms

And the pillar data for "testing:list_of_dicts:0" should not contain "full_name" on "sle_minion" 3s 409ms

And the pillar data for "testing:dict_of_dicts:def_user:name" should be "root" on "sle_minion" 4s 554ms

And the pillar data for "testing:dict_of_dicts:def_user:password" should be "secret2" on "sle_minion" 3s 473ms

And the pillar data for "testing:dict_of_dicts:def_user:full_name" should be "None" on "sle_minion" 3s 565ms

And the pillar data for "testing:recursive_dict_of_dicts:def_gr1:group_name" should be "default group 1" on "sle_minion" 3s 443ms

And the pillar data for "testing:recursive_dict_of_dicts:def_gr1:entries:def_entry1:entry_name" should be "default entry 1" on "sle_minion" 4s 529ms

And the pillar data for "testing:recursive_dict_of_dicts:def_gr1:entries:def_entry1:entry_desc" should be "some text" on "sle_minion" 3s 985ms

When I follow the left menu "Systems > System Groups" 64ms

When I follow "test-formula-group" in the content area 72ms

And I follow "Formulas" in the content area 89ms

And I follow first "Testform" in the content area 239ms

And I click on "Expand All Sections" 193ms

And I enter "text1" as "testing#str" 130ms

And I enter "text2" as "testing#str_def" 142ms

And I enter "text3" as "testing#str_or_null" 94ms

And I enter "text4" as "testing#str_opt" 102ms

And I enter "1" as "testing#num" 66ms

And I enter "2" as "testing#num_def" 83ms

And I enter "3" as "testing#num_or_null" 65ms

And I enter "4" as "testing#num_opt" 70ms

And I enter "pw1" as "testing#pw" 97ms

And I enter "pw2" as "testing#pw_or_null" 87ms

And I enter "pw3" as "testing#pw_opt" 97ms

And I click on "Save Formula" 106ms

Then I should see a "Formula saved" text 760ms

When I wait for "1" seconds 1s

Then the pillar data for "testing:str" should be "text1" on "sle_minion" 3s 407ms

And the pillar data for "testing:str_def" should be "text2" on "sle_minion" 4s 534ms

And the pillar data for "testing:str_or_null" should be "text3" on "sle_minion" 3s 419ms

And the pillar data for "testing:str_opt" should be "text4" on "sle_minion" 3s 417ms

And the pillar data for "testing:num" should be "1" on "sle_minion" 3s 446ms

And the pillar data for "testing:num_def" should be "2" on "sle_minion" 4s 874ms

And the pillar data for "testing:num_or_null" should be "3" on "sle_minion" 3s 430ms

And the pillar data for "testing:num_opt" should be "4" on "sle_minion" 3s 333ms

And the pillar data for "testing:pw" should be "pw1" on "sle_minion" 3s 568ms

And the pillar data for "testing:pw_or_null" should be "pw2" on "sle_minion" 4s 683ms

And the pillar data for "testing:pw_opt" should be "pw3" on "sle_minion" 3s 470ms

When I follow the left menu "Systems > System Groups" 88ms

When I follow "test-formula-group" in the content area 73ms

And I follow "Formulas" in the content area 79ms

And I follow first "Testform" in the content area 348ms

And I click on "Clear values" and confirm alert box 383ms

And I click on "Save Formula" 69ms

Then I should see a "Formula saved" text 603ms

When I wait for "1" seconds 1s

Then the pillar data for "testing:str" should be "" on "sle_minion" 3s 409ms

And the pillar data for "testing:str_def" should be "defvalue" on "sle_minion" 4s 530ms

And the pillar data for "testing:str_or_null" should be "None" on "sle_minion" 3s 881ms

And the pillar data for "testing" should not contain "str_opt" on "sle_minion" 3s 452ms

And the pillar data for "testing:num" should be "" on "sle_minion" 3s 482ms

And the pillar data for "testing:num_def" should be "0" on "sle_minion" 3s 466ms

And the pillar data for "testing:num_or_null" should be "None" on "sle_minion" 5s 192ms

And the pillar data for "testing" should not contain "num_opt" on "sle_minion" 3s 448ms

And the pillar data for "testing:pw" should be "" on "sle_minion" 3s 456ms

And the pillar data for "testing:pw_or_null" should be "None" on "sle_minion" 5s 230ms

And the pillar data for "testing" should not contain "pw_opt" on "sle_minion" 3s 433ms

And the pillar data for "testing:list_of_strings" should contain "def_item1" on "sle_minion" 3s 420ms

And the pillar data for "testing:list_of_strings" should contain "def_item2" on "sle_minion" 3s 519ms

And the pillar data for "testing:dict_of_strings:name1" should be "def_value1" on "sle_minion" 4s 645ms

And the pillar data for "testing:dict_of_strings:name2" should be "def_value2" on "sle_minion" 3s 466ms

And the pillar data for "testing:list_of_dicts:0:name" should be "def_user" on "sle_minion" 3s 463ms

And the pillar data for "testing:list_of_dicts:0:password" should be "secret1" on "sle_minion" 3s 472ms

And the pillar data for "testing:list_of_dicts:0" should not contain "full_name" on "sle_minion" 4s 583ms

And the pillar data for "testing:dict_of_dicts:def_user:name" should be "root" on "sle_minion" 3s 488ms

And the pillar data for "testing:dict_of_dicts:def_user:password" should be "secret2" on "sle_minion" 3s 560ms

And the pillar data for "testing:dict_of_dicts:def_user:full_name" should be "None" on "sle_minion" 3s 411ms

And the pillar data for "testing:recursive_dict_of_dicts:def_gr1:group_name" should be "default group 1" on "sle_minion" 4s 511ms

And the pillar data for "testing:recursive_dict_of_dicts:def_gr1:entries:def_entry1:entry_name" should be "default entry 1" on "sle_minion" 3s 894ms

And the pillar data for "testing:recursive_dict_of_dicts:def_gr1:entries:def_entry1:entry_desc" should be "some text" on "sle_minion" 3s 393ms

When I follow the left menu "Systems > System Groups" 71ms

When I follow "test-formula-group" in the content area 86ms

And I follow "Formulas" in the content area 59ms

And I follow first "Testform" in the content area 199ms

And I click on "Expand All Sections" 199ms

And I enter "text1" as "testing#str" 104ms

And I enter "1" as "testing#num" 60ms

And I enter "2" as "testing#num_def" 73ms

And I enter "pw1" as "testing#pw" 101ms

And I click on "Save Formula" 82ms

Then I should see a "Formula saved" text 737ms

When I wait for "1" seconds 1s

Then the pillar data for "testing:str" should be "text1" on "sle_minion" 5s 58ms

And the pillar data for "testing:str_def" should be "defvalue" on "sle_minion" 3s 499ms

And the pillar data for "testing:str_or_null" should be "None" on "sle_minion" 3s 409ms

And the pillar data for "testing" should not contain "str_opt" on "sle_minion" 3s 437ms

And the pillar data for "testing:num" should be "1" on "sle_minion" 4s 700ms

And the pillar data for "testing:num_def" should be "2" on "sle_minion" 3s 515ms

And the pillar data for "testing:num_or_null" should be "None" on "sle_minion" 3s 429ms

And the pillar data for "testing" should not contain "num_opt" on "sle_minion" 3s 484ms

And the pillar data for "testing:pw" should be "pw1" on "sle_minion" 4s 517ms

And the pillar data for "testing:pw_or_null" should be "None" on "sle_minion" 3s 394ms

And the pillar data for "testing" should not contain "pw_opt" on "sle_minion" 3s 442ms

Given I am on the Systems overview page of this "sle_minion" 941ms

When I follow "Formulas" in the content area 79ms

And I follow first "Testform" in the content area 209ms

And I click on "Save Formula" 230ms

Then I should see a "Formula saved" text 558ms

And the pillar data for "testing:str" should be "text1" on "sle_minion" 5s 105ms

And the pillar data for "testing:str_def" should be "defvalue" on "sle_minion" 3s 426ms

And the pillar data for "testing:str_or_null" should be "None" on "sle_minion" 3s 508ms

And the pillar data for "testing" should not contain "str_opt" on "sle_minion" 3s 419ms

And the pillar data for "testing:num" should be "1" on "sle_minion" 4s 535ms

And the pillar data for "testing:num_def" should be "2" on "sle_minion" 4s 289ms

And the pillar data for "testing:num_or_null" should be "None" on "sle_minion" 3s 408ms

And the pillar data for "testing" should not contain "num_opt" on "sle_minion" 3s 457ms

And the pillar data for "testing:pw" should be "pw1" on "sle_minion" 4s 954ms

And the pillar data for "testing:pw_or_null" should be "None" on "sle_minion" 3s 448ms

And the pillar data for "testing" should not contain "pw_opt" on "sle_minion" 3s 410ms

When I follow "Formulas" in the content area 66ms

And I follow first "Testform" in the content area 180ms

And I click on "Expand All Sections" 219ms

And I enter "min_text1" as "testing#str" 168ms

And I enter "min_text2" as "testing#str_def" 173ms

And I enter "min_text3" as "testing#str_or_null" 105ms

And I enter "min_text4" as "testing#str_opt" 110ms

And I enter "101" as "testing#num" 90ms

And I enter "102" as "testing#num_def" 78ms

And I enter "103" as "testing#num_or_null" 80ms

And I enter "104" as "testing#num_opt" 71ms

And I enter "min_pw1" as "testing#pw" 131ms

And I enter "min_pw2" as "testing#pw_or_null" 105ms

And I enter "min_pw3" as "testing#pw_opt" 97ms

And I click on "Save Formula" 87ms

Then I should see a "Formula saved" text 721ms

When I wait for "1" seconds 1s

Then the pillar data for "testing:str" should be "min_text1" on "sle_minion" 4s 623ms

And the pillar data for "testing:str_def" should be "min_text2" on "sle_minion" 3s 453ms

And the pillar data for "testing:str_or_null" should be "min_text3" on "sle_minion" 3s 407ms

And the pillar data for "testing:str_opt" should be "min_text4" on "sle_minion" 3s 488ms

And the pillar data for "testing:num" should be "101" on "sle_minion" 4s 597ms

And the pillar data for "testing:num_def" should be "102" on "sle_minion" 3s 431ms

And the pillar data for "testing:num_or_null" should be "103" on "sle_minion" 3s 476ms

And the pillar data for "testing:num_opt" should be "104" on "sle_minion" 3s 442ms

And the pillar data for "testing:pw" should be "min_pw1" on "sle_minion" 4s 685ms

And the pillar data for "testing:pw_or_null" should be "min_pw2" on "sle_minion" 3s 558ms

And the pillar data for "testing:pw_opt" should be "min_pw3" on "sle_minion" 3s 465ms

When I follow "Formulas" in the content area 91ms

And I follow first "Testform" in the content area 236ms

And I click on "Clear values" and confirm alert box 303ms

And I click on "Save Formula" 63ms

Then I should see a "Formula saved" text 581ms

When I wait for "1" seconds 1s

Then the pillar data for "testing:str" should be "text1" on "sle_minion" 4s 863ms

And the pillar data for "testing:str_def" should be "defvalue" on "sle_minion" 4s 26ms

And the pillar data for "testing:str_or_null" should be "None" on "sle_minion" 3s 393ms

And the pillar data for "testing" should not contain "str_opt" on "sle_minion" 3s 431ms

And the pillar data for "testing:num" should be "1" on "sle_minion" 5s 295ms

And the pillar data for "testing:num_def" should be "2" on "sle_minion" 3s 528ms

And the pillar data for "testing:num_or_null" should be "None" on "sle_minion" 3s 425ms

And the pillar data for "testing" should not contain "num_opt" on "sle_minion" 3s 473ms

And the pillar data for "testing:pw" should be "pw1" on "sle_minion" 4s 632ms

And the pillar data for "testing:pw_or_null" should be "None" on "sle_minion" 3s 431ms

And the pillar data for "testing" should not contain "pw_opt" on "sle_minion" 3s 590ms

When I follow "Formulas" in the content area 61ms

And I uncheck the "testform" formula 431ms

And I click on "Save" 62ms

And I wait until I see "Formula saved." text 768ms

Then the "testform" formula should be unchecked 10s 23ms

When I follow the left menu "Systems > System Groups" 83ms

And I follow "test-formula-group" in the content area 93ms

And I follow "Delete Group" in the content area 67ms

When I click on "Confirm Deletion" 1s 941ms

Then I should see a "System group" text 61ms

Then I should see a "test-formula-group" text 57ms

And I should see a "deleted" text 57ms

And I wait until there is no pillar refresh salt job active 5s 148ms

Then the pillar data for "testing" should be empty on "sle_minion" 5s 234ms

@skip_if_github_validation @scope_openscap
Feature:OpenSCAP audit of Salt minion 2m 9s 802ms 5 7 5

In order to audit a Salt minion
As an authorized user
I want to run an OpenSCAP scan on it

Given I am authorized for the "Admin" section 543ms

And I am on the Systems overview page of this "sle_minion" 2s 552ms

When I enable repository "repo-oss" on this "sle_minion" without error control 743ms

When I enable repository "os_pool_repo" on this "sle_minion" without error control 0s

When I refresh the metadata for "sle_minion" 869ms

And I install OpenSCAP dependencies on "sle_minion" 663ms Show Error +
                                            
FAIL: zypper --non-interactive install -y openscap-utils openscap-content scap-security-guide returned status code = 104. Output: Loading repository data... Reading installed packages... 'openscap-content' not found in package names. Trying capabilities. 'openscap-utils' not found in package names. Trying capabilities. 'scap-security-guide' not found in package names. Trying capabilities. (ScriptError) ./features/support/remote_node.rb:172:in `run_local' ./features/support/remote_node.rb:120:in `run' ./features/step_definitions/command_steps.rb:981:in `/^I install packages? "([^"]*)" on this "([^"]*)"((?: without error control)?)$/' ./features/step_definitions/command_steps.rb:959:in `/^I (install|remove) OpenSCAP dependencies (on|from) "([^"]*)"$/' features/secondary/min_salt_openscap_audit.feature:25:in `I install OpenSCAP dependencies on "sle_minion"'

And I follow "Software" in the content area 0s

And I click on "Update Package List" 0s

And I wait until event "Package List Refresh" is completed 0s

19s 276ms Show Info +
19:27:06:000 - 19:27:08:000 | Current URL: https://uyuni-master-server.sumaci.aws/rhn/systems/details/Overview.do?sid=1000010023
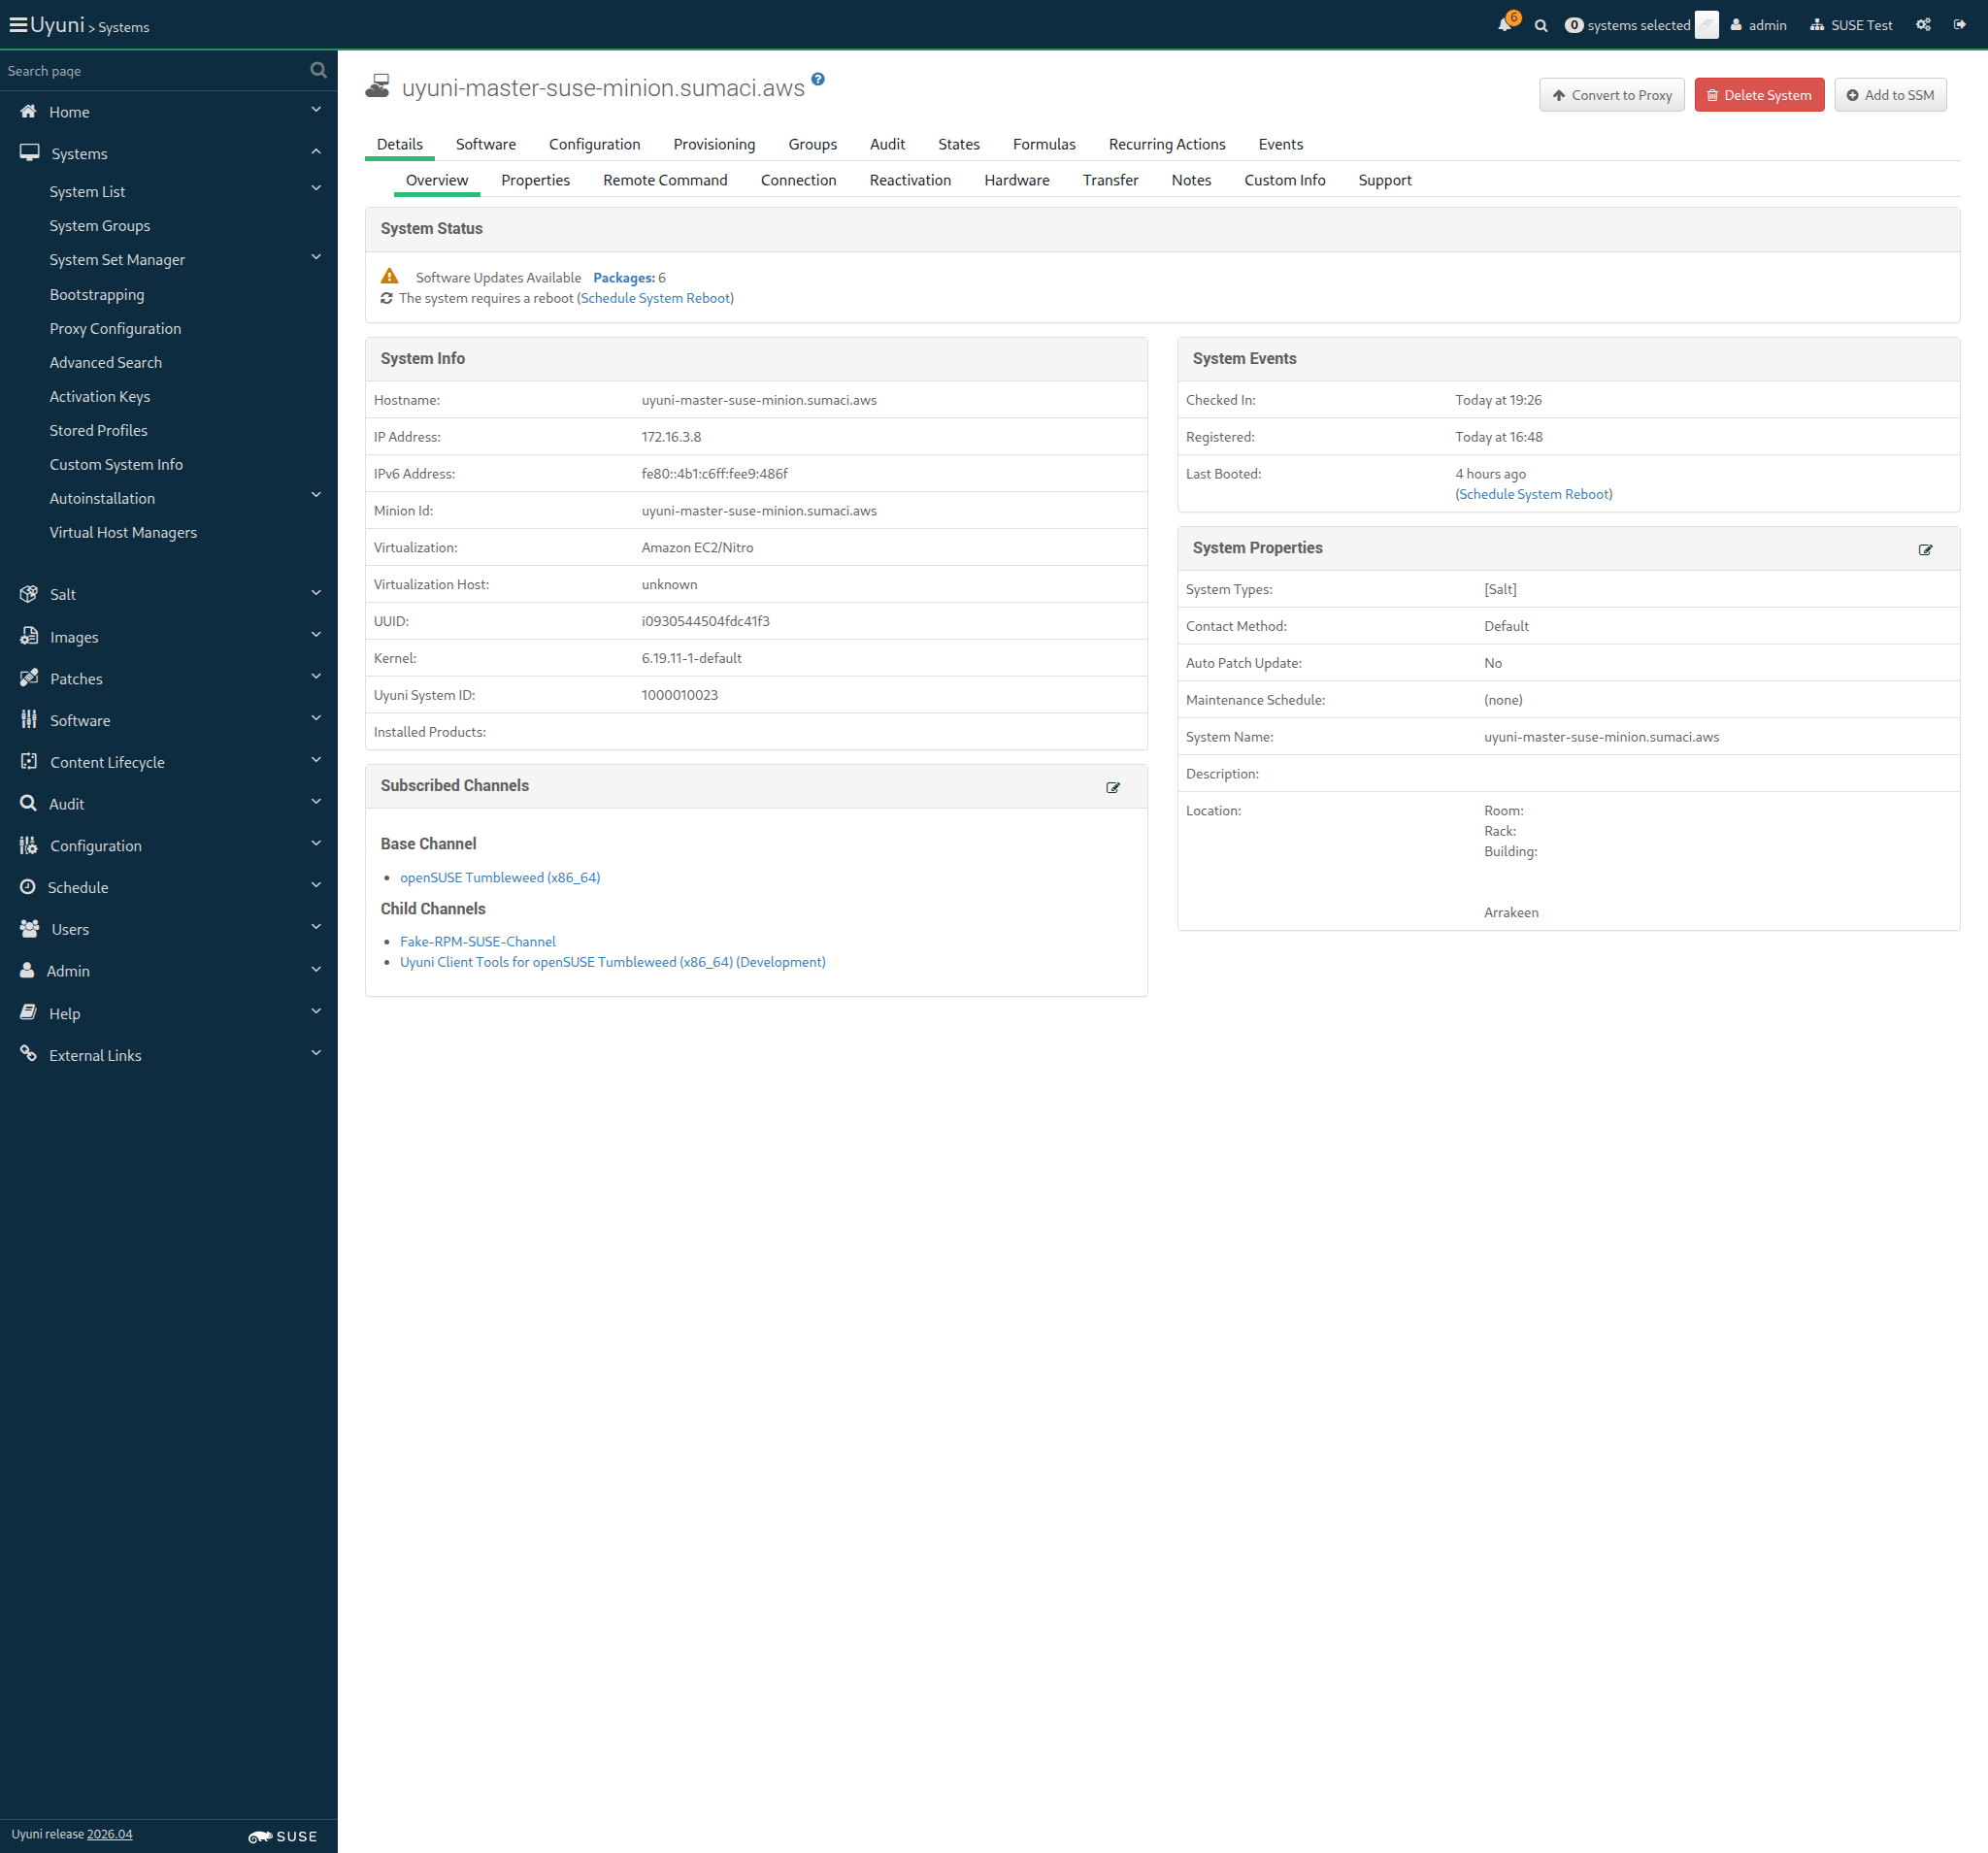
Screenshot +


When I follow "Audit" in the content area 0s

And I follow "OpenSCAP" in the content area 0s

And I follow "Schedule" in the content area 0s

And I wait at most 30 seconds until I do not see "This system does not yet have OpenSCAP scan capability." text, refreshing the page 0s

And I enter "--profile standard" as "params" 0s

And I enter "/usr/share/xml/scap/ssg/content/ssg-sle15-ds.xml" as "path" 0s

And I click on "Schedule" 0s

Then I should see a "XCCDF scan has been scheduled" text 0s

And I wait at most 500 seconds until event "OpenSCAP xccdf scanning" is completed 0s

When I follow "Audit" in the content area 75ms

And I follow "OpenSCAP" in the content area 70ms

And I follow "Schedule" in the content area 64ms

And I wait at most 30 seconds until I do not see "This system does not yet have OpenSCAP scan capability." text, refreshing the page 33s 41ms Show Error +
                                            
execution expired (Timeout::Error) ./features/support/commonlib.rb:89:in `repeat_until_timeout' ./features/step_definitions/navigation_steps.rb:80:in `/^I wait at most (\d+) seconds until I do not see "([^"]*)" text, refreshing the page$/' features/secondary/min_salt_openscap_audit.feature:47:in `I wait at most 30 seconds until I do not see "This system does not yet have OpenSCAP scan capability." text, refreshing the page'

And I enter "--profile standard" as "params" 0s

And I enter "/usr/share/xml/scap/ssg/content/ssg-opensuse-ds.xml" as "path" 0s

And I click on "Schedule" 0s

Then I should see a "XCCDF scan has been scheduled" text 0s

And I wait at most 500 seconds until event "OpenSCAP xccdf scanning" is completed 0s

When I follow "Audit" in the content area 0s

And I follow "OpenSCAP" in the content area 0s

And I follow "xccdf_org.open-scap_testresult" 0s

Then I should see a "Details of XCCDF Scan" text 0s

And I should see a "profile standard" text 0s

And I should see a "XCCDF Rule Results" text 0s

When I enter "pass" as the filtered XCCDF result type 0s

And I click on the filter button 0s

Then I should see a "xccdf_org.ssgproject.content_rule_service_httpd_disabled" link 0s

When I follow "Audit" in the content area 10s 10ms Show Error +
                                            
Unable to find xpath "//section" (Capybara::ElementNotFound) ./features/step_definitions/navigation_steps.rb:387:in `/^I follow "([^"]*)" in the (.+)$/' features/secondary/min_salt_openscap_audit.feature:68:in `I follow "Audit" in the content area'

And I follow "OpenSCAP" in the content area 0s

And I follow "xccdf_org.open-scap_testresult" 0s

Then I should see a "Details of XCCDF Scan" text 0s

And I should see a "profile standard" text 0s

And I should see a "XCCDF Rule Results" text 0s

When I enter "pass" as the filtered XCCDF result type 0s

And I click on the filter button 0s

Then I should see a "xccdf_org.ssgproject.content_rule_file_permissions_etc_passwd" link 0s

When I follow "Audit" in the content area 0s

And I follow "OpenSCAP" in the content area 0s

And I follow "Schedule" in the content area 0s

And I wait at most 30 seconds until I do not see "This system does not yet have OpenSCAP scan capability." text, refreshing the page 0s

And I enter "--profile standard" as "params" 0s

And I enter "/usr/share/xml/scap/ssg/content/ssg-sle15-ds.xml" as "path" 0s

And I click on "Schedule" 0s

Then I should see a "XCCDF scan has been scheduled" text 0s

When I wait for the OpenSCAP audit to finish 0s

When I follow "Audit" in the content area 10s 10ms Show Error +
                                            
Unable to find xpath "//section" (Capybara::ElementNotFound) ./features/step_definitions/navigation_steps.rb:387:in `/^I follow "([^"]*)" in the (.+)$/' features/secondary/min_salt_openscap_audit.feature:92:in `I follow "Audit" in the content area'

And I follow "OpenSCAP" in the content area 0s

And I follow "Schedule" in the content area 0s

And I wait at most 30 seconds until I do not see "This system does not yet have OpenSCAP scan capability." text, refreshing the page 0s

And I enter "--profile standard" as "params" 0s

And I enter "/usr/share/xml/scap/ssg/content/ssg-opensuse-ds.xml" as "path" 0s

And I click on "Schedule" 0s

Then I should see a "XCCDF scan has been scheduled" text 0s

When I wait for the OpenSCAP audit to finish 0s

When I follow "Audit" in the content area 10s 8ms Show Error +
                                            
Unable to find xpath "//section" (Capybara::ElementNotFound) ./features/step_definitions/navigation_steps.rb:387:in `/^I follow "([^"]*)" in the (.+)$/' features/secondary/min_salt_openscap_audit.feature:103:in `I follow "Audit" in the content area'

And I follow "OpenSCAP" in the content area 0s

And I follow "List Scans" in the content area 0s

And I click on "Select All" 0s

And I click on "Compare" 0s

Then I should see a "XCCDF Rule Results" text 0s

And I should see a "None" text 0s

When I follow the left menu "Admin > Organizations" 10s 4ms Show Error +
                                            
Unable to find xpath "//aside/div[@id='nav']/nav/ul/li/div/a[contains(.,'Admin')]/parent::div/parent::li" (Capybara::ElementNotFound) ./features/step_definitions/navigation_steps.rb:441:in `block (2 levels) in (top (required))' ./features/step_definitions/navigation_steps.rb:433:in `each' ./features/step_definitions/navigation_steps.rb:433:in `each_with_index' ./features/step_definitions/navigation_steps.rb:433:in `/^I follow the left menu "([^"]*)"$/' features/secondary/min_salt_openscap_audit.feature:112:in `I follow the left menu "Admin ) Organizations"'

When I follow "SUSE Test" in the content area 0s

And I follow "Configuration" in the content area 0s

And I enter "0" as "scap_retention_period" 0s

And I click on "Update Organization" 0s

Then I should see a "Organization SUSE Test was successfully updated." text 0s

Requested /rhn/systems/details/Overview.do?sid=1000010023, got https://uyuni-master-server.sumaci.aws/rhn/manager/login?url_bounce=%2Frhn%2Fsystems%2Fdetails%2FOverview.do%3Fsid%3D1000010023&request_method=GET
Given I am on the Systems overview page of this "sle_minion" 658ms

When I follow "Audit" in the content area 10s 40ms Show Error +
                                            
Unable to find link "Audit" within #(Capybara::Node::Element tag="section" path="/HTML/BODY[1]/DIV[1]/DIV[1]/SECTION[1]") (Capybara::ElementNotFound) ./features/support/commonlib.rb:192:in `click_link_and_wait' ./features/step_definitions/navigation_steps.rb:366:in `/^I follow "([^"]*)"$/' ./features/step_definitions/navigation_steps.rb:388:in `block (2 levels) in (top (required))' ./features/step_definitions/navigation_steps.rb:387:in `/^I follow "([^"]*)" in the (.+)$/' features/secondary/min_salt_openscap_audit.feature:121:in `I follow "Audit" in the content area'

And I follow "OpenSCAP" in the content area 0s

And I follow "List Scans" in the content area 0s

And I click on "Select All" 0s

And I click on "Remove" 0s

And I click on "Confirm" 0s

Then I should see a "2 SCAP Scan(s) deleted. 0 SCAP Scan(s) retained" text 0s

18s 837ms Show Info +
19:30:32:000 - 19:30:43:000 | Current URL: https://uyuni-master-server.sumaci.aws/rhn/manager/login?url_bounce=%2Frhn%2Fsystems%2Fdetails%2FOverview.do%3Fsid%3D1000010023&request_method=GET
Screenshot +


When I follow the left menu "Admin > Organizations" 126ms

When I follow "SUSE Test" in the content area 66ms

And I follow "Configuration" in the content area 64ms

And I enter "90" as "scap_retention_period" 51ms

And I click on "Update Organization" 58ms

Then I should see a "Organization SUSE Test was successfully updated." text 421ms

When I remove OpenSCAP dependencies from "sle_minion" 1s 101ms

When I disable repository "repo-oss" on this "sle_minion" without error control 440ms

When I disable repository "os_pool_repo" on this "sle_minion" without error control 0s

Given I am on the Systems overview page of this "sle_minion" 1s 448ms

When I follow "States" in the content area 64ms

And I install a user-defined state for "sle_minion" on the server 9s 360ms

And I follow "Highstate" in the content area 64ms

And I click on "Show full highstate output" 280ms

And I wait for "6" seconds 6s

Then I should see a "user_defined_state" or "running as PID" text in element "highstate" 42ms

When I schedule a highstate for "sle_minion" via API 959ms

And I wait until event "Apply highstate scheduled" is completed 22s 212ms

Then file "/tmp/test_user_defined_state" should exist on "sle_minion" 688ms

When I follow "States" in the content area 74ms

And I uninstall the user-defined state from the server 3s 320ms

And I uninstall the managed file from "sle_minion" 398ms

And I follow "Highstate" in the content area 64ms

And I click on "Show full highstate output" 240ms

And I wait for "6" seconds 6s

Then I should not see a "user_defined_state" text in element "highstate" 10s 64ms

In order to validate the completeness of minion registration
I want to see minion details and installed packages

Given I am on the Systems overview page of this "sle_minion" 1s 433ms

Then I should see a "[Salt]" text 90ms

When I follow "Software" in the content area 92ms

And I follow "List / Remove" 803ms

Then I should see a "aaa_base" text 288ms

When I follow "Details" in the content area 67ms

And I follow "Hardware" in the content area 64ms

And I click on "Schedule Hardware Refresh" 777ms

Then I should see a "You have successfully scheduled a hardware profile refresh" text 117ms

When I wait until event "Hardware List Refresh scheduled" is completed 19s 239ms

And I wait until there is no Salt job calling the module "hardware.profileupdate" on "sle_minion" 2s 35ms

When I follow "Details" in the content area 58ms

And I follow "Hardware" in the content area 58ms

And I click on "Update Properties" 605ms

Then I should see a "Networking properties updated." text 115ms

@sle_minion @scope_configuration_channels
Feature:Configuration state channels 1m 49s 917ms 17

In order to configure systems through Salt
I want to be able to use the state channels

When I follow the left menu "Configuration > Channels" 122ms

And I follow "Create State Channel" 281ms

Then I should see a "New Config State Channel" text 60ms

When I enter "My State Channel" as "cofName" 71ms

And I enter "statechannel" as "cofLabel" 57ms

And I enter "This is a state channel" as "cofDescription" 68ms

And I enter "touch /root/foobar:\n cmd.run:\n - creates: /root/foobar" in the editor 4ms

And I click on "Create Config State Channel" 667ms

Then I should see a "State Channel" text 70ms

And I should see a "Channel Properties" text 63ms

And I should see a "Channel Information" text 63ms

And I should see a "Configuration Actions" text 68ms

When I am on the Systems overview page of this "sle_minion" 891ms

And I follow "Configuration" in the content area 68ms

And I follow "Manage Configuration Channels" in the content area 64ms

And I follow first "Subscribe to Channels" in the content area 61ms

And I check "My State Channel" in the list 60ms

And I click on "Continue" 612ms

And I click on "Update Channel Rankings" 58ms

Then I should see a "Channel Subscriptions successfully changed for" text 741ms

When I follow the left menu "Configuration > Channels" 108ms

And I follow "My State Channel" 429ms

Then I should see a "1 system subscribed" text 65ms

When I follow "View/Edit 'init.sls' File" 338ms

Then I should see a "Revision 1 of /init.sls from channel My State Channel" text 81ms

And I should see a "File Contents" text 74ms

And I should see a "touch /root/foobar:" text 78ms

When I am on the Systems overview page of this "sle_minion" 1s 48ms

And I follow "States" in the content area 66ms

And I follow "Configuration Channels" in the content area 65ms

Then I should see a "Execute States" button 213ms

When I click on "Execute States" 52ms

Then I should see a "Applying the config channels has been scheduled" text 266ms

When I wait until event "Apply states [custom] scheduled" is completed 22s 199ms

And I wait until file "/root/foobar" exists on "sle_minion" 682ms

When I follow the left menu "Configuration > Channels" 120ms

And I follow "My State Channel" 507ms

And I follow "View/Edit 'init.sls' File" 406ms

When I follow "Delete" 341ms

And I click on "Delete Configuration Revision" 583ms

Then I should see a "Cannot delete the only revision for the init.sls file" text 85ms

And I should see a "Revision 1 of /init.sls from channel My State Channel" text 75ms

When I follow the left menu "Configuration > Channels" 78ms

And I follow "My State Channel" 415ms

And I follow "Delete Channel" 295ms

Then I should see a "Are you sure you want to delete this config channel?" text 55ms

When I click on "Delete Config Channel" 59ms

Then I should see a "Channel 'My State Channel' has been deleted." text 60ms

And I remove "/root/foobar" from "sle_minion" 396ms

When I follow the left menu "Configuration > Channels" 60ms

And I follow "Create State Channel" 294ms

Then I should see a "New Config State Channel" text 54ms

When I enter "My State Channel" as "cofName" 70ms

And I enter "statechannel" as "cofLabel" 59ms

And I enter "This is a state channel" as "cofDescription" 72ms

And I enter "touch /root/statechannel:\n cmd.run:\n - creates: /root/statechannel" in the editor 8ms

And I click on "Create Config State Channel" 64ms

Then I should see a "State Channel" text 653ms

And I should see a "Channel Properties" text 63ms

And I should see a "Channel Information" text 61ms

And I should see a "Configuration Actions" text 63ms

When I follow the left menu "Configuration > Channels" 83ms

And I follow "Create State Channel" 288ms

Then I should see a "New Config State Channel" text 60ms

When I enter "My State Channel" as "cofName" 62ms

And I enter "statechannel2" as "cofLabel" 55ms

And I enter "This is a state channel" as "cofDescription" 63ms

And I enter "touch /root/statechannel2:\n cmd.run:\n - creates: /root/statechannel2" in the editor 3ms

And I click on "Create Config State Channel" 628ms

Then I should see a "State Channel" text 68ms

And I should see a "Channel Properties" text 65ms

And I should see a "Channel Information" text 66ms

And I should see a "Configuration Actions" text 68ms

When I create channel "statechannel3" from spacecmd of type "state" 4s 751ms

And I follow the left menu "Configuration > Channels" 59ms

Then I should see a "statechannel3" text 62ms

When I update init.sls from spacecmd with content "touch /tmp/statechannel3:\n cmd.run:\n - creates: /tmp/statechannel3" for channel "statechannel3" 8s 326ms

And I get "/init.sls" file details for channel "statechannel3" via spacecmd 4s 515ms

Then I should see "Revision: 2" in the output < 1ms

When I update init.sls from spacecmd with content "touch /root/statechannel3:\n cmd.run:\n - creates: /root/statechannel3" for channel "statechannel3" and revision "100" 8s 493ms

And I get "/init.sls" file details for channel "statechannel3" via spacecmd 3s 82ms

Then I should see "Revision: 100" in the output < 1ms

When I am on the Systems overview page of this "sle_minion" 1s 33ms

And I follow "States" in the content area 73ms

And I follow "Configuration Channels" in the content area 67ms

And I click on "Search" in element "search-row" 69ms

Then I should see a "My State Channel" text 297ms

And I should see a "statechannel" text 69ms

And I should see a "statechannel2" text 74ms

When I check "statechannel-cbox" 84ms

And I check "statechannel2-cbox" 77ms

And I click on "Save Changes" 64ms

And I wait until I see "Edit Channel Ranks" text 62ms

Then I should see a "My State Channel (statechannel)" text 58ms

And I should see a "My State Channel (statechannel2)" text 60ms

When I click on "Confirm" 57ms

Then I should see a "State assignments have been saved." text 257ms

When I follow "States" in the content area 63ms

And I follow "Configuration Channels" in the content area 57ms

And I click on "Search" in element "search-row" 59ms

And I wait until I see "Execute States" text 66ms

And I click on "Execute States" 62ms

Then I should see a "Applying the config channels has been scheduled" text 315ms

And I wait until event "Apply states [custom] scheduled" is completed 22s 179ms

And I wait until file "/root/statechannel" exists on "sle_minion" 697ms

And I wait until file "/root/statechannel2" exists on "sle_minion" 398ms

When I follow "States" in the content area 61ms

And I follow "Configuration Channels" in the content area 66ms

Then I should see a "My State Channel" text 275ms

And I should see a "statechannel3" text 68ms

When I check "statechannel3-cbox" 100ms

And I click on "Save Changes" 65ms

And I wait until I see "Edit Channel Ranks" text 60ms

And I should see a "My State Channel (statechannel)" text 63ms

And I should see a "My State Channel (statechannel2)" text 65ms

And I should see a "statechannel3 (statechannel3)" text 63ms

When I click on "Confirm" 71ms

Then I should see a "State assignments have been saved." text 171ms

When I schedule apply configchannels for "sle_minion" 7s 940ms

And I wait until file "/root/statechannel3" exists on "sle_minion" 3s 745ms

When I follow the left menu "Configuration > Channels" 117ms

And I follow first "My State Channel" 460ms

And I follow "Delete Channel" 299ms

Then I should see a "Are you sure you want to delete this config channel?" text 55ms

When I click on "Delete Config Channel" 355ms

Then I should see a "Channel 'My State Channel' has been deleted." text 70ms

When I remove "/root/statechannel" from "sle_minion" 406ms

When I follow the left menu "Configuration > Channels" 61ms

And I follow first "My State Channel" 424ms

And I follow "Delete Channel" 290ms

Then I should see a "Are you sure you want to delete this config channel?" text 54ms

When I click on "Delete Config Channel" 52ms

Then I should see a "Channel 'My State Channel' has been deleted." text 67ms

When I remove "/root/statechannel2" from "sle_minion" 402ms

When I follow the left menu "Configuration > Channels" 62ms

And I follow first "statechannel3" 523ms

And I follow "Delete Channel" 358ms

Then I should see a "Are you sure you want to delete this config channel?" text 57ms

When I click on "Delete Config Channel" 51ms

Then I should see a "Channel 'statechannel3' has been deleted." text 59ms

When I remove "/root/statechannel3" from "sle_minion" 400ms

When I create state channel "statechannel1" via API 2s 31ms Show Error +
                                            
Unexpected HTTP status code 401 (ScriptError) ./features/support/http_client.rb:91:in `call' ./features/support/api_test.rb:80:in `ensure in block (2 levels) in call' ./features/support/api_test.rb:81:in `block (2 levels) in call' ./features/support/api_test.rb:75:in `synchronize' ./features/support/api_test.rb:75:in `block in call' features/secondary/min_config_state_channel_api.feature:7:in `I create state channel "statechannel1" via API'

And I call configchannel.get_file_revision() with file "/init.sls", revision "1" and channel "statechannel1" via API 0s

Then I should get file contents "" 0s

48s 840ms Show Error +
                                            
User is not logged in (ScriptError) ./features/step_definitions/navigation_steps.rb:655:in `/^I should be logged in$/' ./features/step_definitions/navigation_steps.rb:635:in `/^I am authorized as "([^"]*)" with password "([^"]*)"$/' ./features/support/env.rb:236:in `block in relog_and_visit_previous_url' ./features/support/env.rb:234:in `relog_and_visit_previous_url' ./features/support/env.rb:214:in `handle_screenshot_and_relog' ./features/support/env.rb:174:in `After'
Show Info +
19:35:09:000 - 19:35:21:000 | Current URL: https://uyuni-master-server.sumaci.aws/rhn/configuration/GlobalConfigChannelList.do
Screenshot +


When I create state channel "statechannel2" containing "touch /root/foobar:\n cmd.run:\n - creates: /root/foobar" via API 2s 32ms Show Error +
                                            
Unexpected HTTP status code 401 (ScriptError) ./features/support/http_client.rb:91:in `call' ./features/support/api_test.rb:80:in `ensure in block (2 levels) in call' ./features/support/api_test.rb:81:in `block (2 levels) in call' ./features/support/api_test.rb:75:in `synchronize' ./features/support/api_test.rb:75:in `block in call' features/secondary/min_config_state_channel_api.feature:12:in `I create state channel "statechannel2" containing "touch /root/foobar:\n cmd.run:\n - creates: /root/foobar" via API'

And I call configchannel.get_file_revision() with file "/init.sls", revision "1" and channel "statechannel2" via API 0s

Then I should get file contents "touch /root/foobar:\n cmd.run:\n - creates: /root/foobar" 0s

Then I delete channel "statechannel1" via API without error control 2s 38ms Show Error +
                                            
Unexpected HTTP status code 401 (ScriptError) ./features/support/http_client.rb:91:in `call' ./features/support/api_test.rb:80:in `ensure in block (2 levels) in call' ./features/support/api_test.rb:81:in `block (2 levels) in call' ./features/support/api_test.rb:75:in `synchronize' ./features/support/api_test.rb:75:in `block in call' features/secondary/min_config_state_channel_api.feature:17:in `I delete channel "statechannel1" via API without error control'

And I delete channel "statechannel2" via API without error control 0s

When I enable repository "test_repo_rpm_pool" on this "sle_minion" 735ms

And I refresh the metadata for "sle_minion" 799ms

And I install old package "milkyway-dummy-1.0" on this "sle_minion" without error control 1s 577ms

When I refresh packages list via spacecmd on "sle_minion" 8s 539ms

And I wait until refresh package list on "sle_minion" is finished 12s 491ms

Then spacecmd should show packages "milkyway-dummy-1.0" installed on "sle_minion" 6s 260ms

Given I am authorized for the "Admin" section 10s 720ms

Given I am on the Systems overview page of this "sle_minion" 2s 236ms

When I follow "Software" in the content area 76ms

And I follow "List / Remove" in the content area 81ms

And I enter "milkyway-dummy" as the filtered package name 229ms

And I click on the filter button until page does contain "milkyway-dummy-1.0" text 11s 210ms

And I follow the left menu "Admin > Task Schedules" 120ms

And I follow "errata-cache-default" 1s 352ms

And I follow "errata-cache-bunch" 1s 258ms

And I click on "Single Run Schedule" 1s 504ms

Then I should see a "bunch was scheduled" text 267ms

When I wait until the table contains "FINISHED" or "SKIPPED" followed by "FINISHED" in its first rows 2s 57ms

Given I am on the Systems overview page of this "sle_minion" 908ms

When I follow "Software" in the content area 69ms

And I follow "List / Remove" 724ms

And I enter "milkyway-dummy" as the filtered package name 148ms

And I click on the filter button 820ms

Then I should see a "milkyway-dummy" text 71ms

When I remove package "milkyway-dummy" from this "sle_minion" 1s 770ms

And I click on the filter button until page does not contain "milkyway-dummy" text 16s 157ms

When I follow "Software" in the content area 73ms

And I follow "List / Remove" 750ms

And I enter "milkyway-dummy" as the filtered package name 146ms

And I click on the filter button 814ms

Then I should not see a "milkyway-dummy" text 67ms

When I install package "milkyway-dummy" on this "sle_minion" 1s 933ms

And I click on the filter button until page does not contain "milkyway-dummy" text 10s 21ms

When I disable repository "test_repo_rpm_pool" on this "sle_minion" 757ms

And I remove package "milkyway-dummy" from this "sle_minion" without error control 1s 488ms

And I refresh the metadata for "sle_minion" 814ms

@susemanager @sle_minion @scope_monitoring @skip_if_github_validation
Feature:Monitor MLM environment with Prometheus on a SLE Salt minion < 1ms 9

In order to monitor Uyuni server
As an authorized user
I want to enable Prometheus exporters

Given I am on the Systems overview page of this "sle_minion" 0s

When I follow "Formulas" in the content area 0s

And I should see a "Choose formulas:" text 0s

And I should see a "Monitoring" text 0s

And I check the "prometheus" formula 0s

And I check the "prometheus-exporters" formula 0s

And I click on "Save" 0s

Then I wait until I see "Formula saved" text 0s

When I follow "Formulas" in the content area 0s

And I follow "Prometheus" in the content area 0s

And I click on "Expand All Sections" 0s

And I enter "admin" as "Username" 0s

And I enter "admin" as "Password" 0s

And I click on "Save Formula" 0s

Then I should see a "Formula saved" text 0s

When I follow "Formulas" in the content area 0s

And I follow "Prometheus Exporters" in the content area 0s

And I click on "Expand All Sections" 0s

And I should see a "Enable and configure Prometheus exporters for managed systems." text 0s

And I check "node" exporter 0s

And I check "apache" exporter 0s

And I check "postgres" exporter 0s

And I click on "Save" 0s

Then I should see a "Formula saved" text 0s

When I follow "States" in the content area 0s

And I click on "Apply Highstate" 0s

Then I should see a "Applying the highstate has been scheduled." text 0s

And I wait until event "Apply highstate scheduled" is completed 0s

When I wait until "prometheus" service is active on "sle_minion" 0s

And I wait until "node" exporter service is active on "sle_minion" 0s

And I wait until "apache" exporter service is active on "sle_minion" 0s

And I wait until "postgres" exporter service is active on "sle_minion" 0s

When I visit "Prometheus" endpoint of this "sle_minion" 0s

And I visit "Prometheus node exporter" endpoint of this "sle_minion" 0s

And I visit "Prometheus apache exporter" endpoint of this "sle_minion" 0s

And I visit "Prometheus postgres exporter" endpoint of this "sle_minion" 0s

When I follow "Formulas" in the content area 0s

And I uncheck the "prometheus" formula 0s

And I uncheck the "prometheus-exporters" formula 0s

And I click on "Save" 0s

Then I wait until I see "Formula saved" text 0s

And I follow "States" in the content area 0s

And I click on "Apply Highstate" 0s

Then I should see a "Applying the highstate has been scheduled." text 0s

And I wait until event "Apply highstate scheduled" is completed 0s

As a systems administrator
In order to manage organization's access to SUSE Customer Service
I want to create, edit, and delete its credentials

Given I am authorized for the "Admin" section 0s

When I follow the left menu "Admin > Setup Wizard > Organization Credentials" 0s

And I ask to add new credentials 0s

And I enter "SCC user" as "edit-user" 0s

And I enter "SCC password" as "edit-password" 0s

And I click on "Save" 0s

Then I should see a "SCC user" text 0s

And the credentials for "SCC user" should be invalid 0s

When I follow the left menu "Admin > Setup Wizard > Organization Credentials" 0s

And I make the credentials for "SCC user" primary 0s

Then the credentials for "SCC user" should be primary 0s

When I follow the left menu "Admin > Setup Wizard > Organization Credentials" 0s

And I view the subscription list for "SCC user" 0s

And I wait until I see "No subscriptions available" text 0s

And I click on "Close" 0s

Given I am authorized for the "Admin" section 0s

When I follow the left menu "Admin > Setup Wizard > Organization Credentials" 0s

And I ask to add new credentials 0s

And I enter "invalidname" as "edit-user" 0s

And I enter "invalidpw" as "edit-password" 0s

And I click on "Save" 0s

Then the credentials for "invalidname" should be invalid 0s

When I ask to add new credentials 0s

And I enter "invalidname" as "edit-user" 0s

And I enter "invalidpw" as "edit-password" 0s

And I click on "Save" 0s

Then I should see a "Credentials with this username already exist" text 0s

When I click on "Cancel" 0s

Then the credentials for "invalidname" should be invalid 0s

Given I am authorized for the "Admin" section 0s

When I follow the left menu "Admin > Setup Wizard > Organization Credentials" 0s

And I ask to edit the credentials for "invalidname" 0s

And I enter "SCC user" as "edit-user" 0s

And I enter "geekogeeko" as "edit-password" 0s

And I click on "Save" 0s

Then I should see a "Credentials with this username already exist" text 0s

When I enter "invalidgeeko" as "edit-user" 0s

And I click on "Save" 0s

Then I should see a "invalidgeeko" text 0s

And the credentials for "invalidgeeko" should be invalid 0s

When I follow the left menu "Admin > Setup Wizard > Organization Credentials" 0s

And I wait for the trash icon to appear for "SCC user" 0s

And I ask to delete the credentials for "SCC user" 0s

And I click on "Delete" in "Are you sure you want to delete these credentials?" modal 0s

Then I wait until I do not see "SCC user" text 0s

When I wait for the trash icon to appear for "invalidgeeko" 0s

And I ask to delete the credentials for "invalidgeeko" 0s

And I click on "Delete" in "Are you sure you want to delete these credentials?" modal 0s

Then I wait until I do not see "invalidgeeko" text 0s

When I follow the left menu "Patches > Patch List > All" 189ms

And I enter "dummy" as the filtered synopsis 154ms

And I click on the filter button 551ms

And I follow "perseus-dummy-7891" 357ms

Then I should see a "perseus-dummy-7891 - Security Advisory" text 69ms

And I should see a "CVE-1999-12345" link 24ms

And I should see a "CVE-1999-99781" link 10ms

When I refresh the metadata for "sle_minion" 1s 47ms

Then I should have 'reference.*id="CVE-1999-12345' in the patch metadata for "sle_minion" 810ms

And I should have 'reference.*id="CVE-1999-99781' in the patch metadata for "sle_minion" 801ms

And I should have 'reference.*http://cve.mitre.org/cgi-bin/cvename.cgi?name=CVE-1999-12345' in the patch metadata for "sle_minion" 817ms

And I should have 'reference.*http://cve.mitre.org/cgi-bin/cvename.cgi?name=CVE-1999-99781' in the patch metadata for "sle_minion" 810ms

When I follow the left menu "Patches > Advanced Search" 64ms

When I enter "CVE-1999-12345" as "search_string" in the content area 80ms

And I click on "Search" 729ms

Then I should see a "Advanced Search" text 83ms

And I should see a "perseus-dummy-7891" link in the content area 22ms

Given I am authorized for the "Admin" section 397ms

When I enable repository "test_repo_rpm_pool" on this "sle_minion" 740ms

And I refresh the metadata for "sle_minion" 776ms

And I install old package "andromeda-dummy-1.0" on this "sle_minion" 1s 527ms

And I install old package "virgo-dummy-1.0" on this "sle_minion" 1s 504ms

When I follow the left menu "Admin > Task Schedules" 121ms

And I follow "errata-cache-default" 1s 352ms

And I follow "errata-cache-bunch" 1s 265ms

And I click on "Single Run Schedule" 1s 512ms

Then I should see a "bunch was scheduled" text 278ms

And I wait until the table contains "FINISHED" or "SKIPPED" followed by "FINISHED" in its first rows 2s 107ms

When I follow the left menu "Patches > Patch List > Relevant" 200ms

Then I should see an update in the list 91ms

When I wait until I see "andromeda-dummy" text, refreshing the page 1m 11s 293ms

Then I should see a "andromeda-dummy-6789" link 14ms

When I enter "virgo-dummy" as the filtered synopsis 108ms

And I click on the filter button 465ms

And I wait until I see "virgo-dummy" text 72ms

Then I should see a "virgo-dummy-3456" link 11ms

When I follow the left menu "Patches > Patch List > Relevant" 81ms

And I follow "andromeda-dummy-6789" 344ms

Then I should see a "andromeda-dummy-6789 - Bug Fix Advisory" text 66ms

And I should see a "Test update for andromeda-dummy" text 67ms

And I should see a "Fake-RPM-SUSE-Channel" link 11ms

And I should see a "reboot_suggested" text 66ms

When I follow the left menu "Patches > Patch List > Relevant" 67ms

And I follow "andromeda-dummy-6789" 332ms

And I follow "Packages" 604ms

Then I should see a "Fake-RPM-SUSE-Channel" link 9ms

And I should see a "sha512:19940cc4a9f0d38a038a4455b0f1cf1290c4a4296b27f5a62f4aae60585ac6e2677e88c3c3127d487116ed8d9b1787379e23aafac46bc14408864926bedee693" text 59ms

And I should see a "andromeda-dummy-2.0-1.1-noarch" link 30ms

Given I am on the Systems overview page of this "sle_minion" 910ms

When I follow "Software" in the content area 70ms

And I follow "Patches" in the content area 63ms

Then I should see a "Relevant Patches" text 77ms

When I enter "dummy" as the filtered synopsis 35ms

And I click on the filter button 10s 131ms

Then I should see a "Test update for andromeda-dummy" text 72ms

And I should see a "Test update for virgo-dummy" text 76ms

Search by hostname: uyuni-master-suse-minion
[{"last_boot"=>"2026-04-28T13:25:56Z", "name"=>"uyuni-master-suse-minion.sumaci.aws", "id"=>1000010023, "last_checkin"=>"2026-04-28T17:40:04Z"}]

When I clean the search index on the server 13s 375ms

When I disable repository "test_repo_rpm_pool" on this "sle_minion" without error control 742ms

And I refresh the metadata for "sle_minion" 817ms

And I remove package "andromeda-dummy" from this "sle_minion" without error control 1s 467ms

And I remove package "virgo-dummy" from this "sle_minion" without error control 1s 463ms

@sle_minion @susemanager @scope_project_lotus @test_issue
Feature:Project Lotus < 1ms 12

* Related GitHub Card: https://github.com/SUSE/spacewalk/issues/23448
In order to manage Program Temporary Fixes (PTFs)
As an authorized user
I want to be able to install and remove them through the WebUI

When I follow the left menu "Software > Manage > Channels" 0s

And I follow "Create Channel" 0s

And I enter "Custom Channel for SLES15SP7 PTFs" as "Channel Name" 0s

And I enter "sles15sp7-ptfs" as "Channel Label" 0s

And I select the parent channel for the "sle_minion" from "Parent Channel" 0s

And I enter "Custom channel for PTFs" as "Channel Summary" 0s

And I uncheck "gpg_check" 0s

And I click on "Create Channel" 0s

Then I should see a "Custom Channel for SLES15SP7 PTFs" text 0s

When I follow the left menu "Software > Manage > Repositories" 0s

And I follow "Create Repository" 0s

And I enter "sles15sp7_ptf_repo" as "label" 0s

And I enter "http://updates.suse.de/PTF/Release/A127499/SLES/15.7/x86_64/ptf/" as "url" 0s

And I uncheck "metadataSigned" 0s

And I click on "Create Repository" 0s

Then I should see a "Repository created successfully" text 0s

When I follow the left menu "Software > Manage > Channels" 0s

And I follow "Custom Channel for SLES15SP7 PTFs" 0s

And I follow "Repositories" in the content area 0s

And I select the "sles15sp7_ptf_repo" repo 0s

And I click on "Save Repositories" 0s

Then I should see a "repository information was successfully updated" text 0s

When I follow the left menu "Software > Manage > Channels" 0s

And I follow "Custom Channel for SLES15SP7 PTFs" 0s

And I follow "Repositories" in the content area 0s

And I follow "Sync" 0s

Then I should see a "Repository sync is running" text 0s

When I wait until the channel "sles15sp7-ptfs" has been synced 0s

Given I am on the Systems overview page of this "sle_minion" 0s

When I follow "Software" in the content area 0s

And I follow "Software Channels" in the content area 0s

And I wait until I do not see "Loading..." text 0s

And I check radio button "SLE-Product-SLES15-SP7-Pool for x86_64" 0s

And I wait until I do not see "Loading..." text 0s

Then radio button "SLE-Product-SLES15-SP7-Pool for x86_64" should be checked 0s

And I wait until I do not see "Loading..." text 0s

And I check "Custom Channel for SLES15SP7 PTFs" 0s

And I click on "Next" 0s

Then I should see a "Confirm Software Channel Change" text 0s

And I click on "Confirm" 0s

Then I should see a "Changing the channels has been scheduled." text 0s

When I follow "scheduled" in the content area 0s

And I wait until I see "1 system successfully completed this action." text, refreshing the page 0s

Then channel "Custom Channel for SLES15SP7 PTFs" should be enabled on "sle_minion" 0s

Given I am on the Systems overview page of this "sle_minion" 0s

When I follow "Software" in the content area 0s

And I follow "PTFs" in the content area 0s

And I follow "Install" in the content area 0s

And I check "ptf-30961-3-0" in the list 0s

And I click on "Install PTFs" 0s

And I click on "Confirm" 0s

Then I should see a "The action has been scheduled" text 0s

And I wait until event "Package Install/Upgrade scheduled" is completed 0s

Given I am on the Systems overview page of this "sle_minion" 0s

When I follow "Software" in the content area 0s

And I follow "PTFs" in the content area 0s

And I follow "List / Remove" in the content area 0s

And I check "ptf-30961-3-0" in the list 0s

And I click on "Remove PTFs" 0s

And I click on "Confirm" 0s

Then I should see a "The action has been scheduled" text 0s

And I wait until event "Package Removal scheduled" is completed 0s

Given I am on the Systems overview page of this "sle_minion" 0s

When I follow "Software" in the content area 0s

And I follow "Packages" in the content area 0s

And I follow "Install" in the content area 0s

And I enter "ptf-30961-3-0" as the filtered package name 0s

And I click on the filter button 0s

And I check "ptf-30961-3-0" in the list 0s

And I click on "Install Packages" 0s

And I click on "Confirm" 0s

Then I should see a "1 package install has been scheduled for" text 0s

And I wait until event "Package Install/Upgrade scheduled" is completed 0s

Given I am on the Systems overview page of this "sle_minion" 0s

When I follow "Software" in the content area 0s

And I follow "Packages" in the content area 0s

And I follow "List / Remove" in the content area 0s

And I enter "ptf-30961-3-0" as the filtered package name 0s

And I click on the filter button 0s

And I check "ptf-30961-3-0" in the list 0s

And I click on "Remove Packages" 0s

And I click on "Confirm" 0s

Then I should see a "1 package removal has been scheduled for" text 0s

And I wait until event "Package Removal scheduled" is completed 0s

When I follow the left menu "Software > Manage > Channels" 0s

And I follow "Custom Channel for SLES15SP7 PTFs" 0s

And I follow "Delete Channel" 0s

And I check "unsubscribeSystems" 0s

And I click on "Delete Channel" 0s

Then I should see a "Channel Custom Channel for SLES15SP7 PTFs has been deleted" text 0s

When I follow the left menu "Software > Manage > Repositories" 0s

And I follow "sles15sp7_ptf_repo" 0s

And I follow "Delete Repository" 0s

And I click on "Delete Repository" 0s

Then I should see a "Repository deleted successfully" text 0s

@skip_if_github_validation @skip_if_cloud @skip_if_containerized_server
Feature:Reconfigure the server's hostname < 1ms 20

As admin user
In order to change the server's hostname
I want to use the tool spacewalk-hostname-rename.

Given I am authorized for the "Admin" section 0s

When I change the server's short hostname from hosts and hostname files 0s

And I reboot the server through SSH 0s

And I run spacewalk-hostname-rename command on the server 0s

When I copy server's keys to the proxy 0s

And I configure the proxy 0s

Then I should see "proxy" via spacecmd 0s

When I restart the "venv-salt-minion" service on "proxy" 0s

Then service "venv-salt-minion" is active on "proxy" 0s

When I restart the "salt-broker" service on "proxy" 0s

Then service "salt-broker" is active on "proxy" 0s

When I apply highstate on "sle_minion" 0s

When I apply highstate on "rhlike_minion" 0s

When I apply highstate on "deblike_minion" 0s

When I apply highstate on "build_host" 0s

When I check all certificates after renaming the server hostname 0s

Given I am on the Systems overview page of this "sle_minion" 0s

When I follow "Details" in the content area 0s

And I follow "Remote Command" in the content area 0s

And I enter as remote command this script in #!/bin/bash date 0s

And I click on "Schedule" 0s

And I follow "Events" in the content area 0s

And I follow "Pending" in the content area 0s

And I wait at most 180 seconds until I do not see "Remote Command on" text, refreshing the page 0s

And I follow "History" in the content area 0s

And I wait until I see the event "Remote Command on" completed during last minute, refreshing the page 0s

When I change back the server's hostname 0s

And I run spacewalk-hostname-rename command on the server 0s

When I copy server's keys to the proxy 0s

And I configure the proxy 0s

Then I should see "proxy" via spacecmd 0s

When I restart the "venv-salt-minion" service on "proxy" 0s

Then service "venv-salt-minion" is active on "proxy" 0s

When I restart the "salt-broker" service on "proxy" 0s

Then service "salt-broker" is active on "proxy" 0s

When I apply highstate on "sle_minion" 0s

When I apply highstate on "rhlike_minion" 0s

When I apply highstate on "deblike_minion" 0s

When I apply highstate on "build_host" 0s

When I check all certificates after renaming the server hostname 0s

In order for the server to behave correctly after a reboot
I want to be sure that there is no wrong SELinux label

Then files on container volumes should all have the proper SELinux label 0s

* Related GitHub Card: https://github.com/SUSE/spacewalk/issues/25872

When I execute spacewalk-debug on the server 39s 27ms

Then the tomcat logs should not contain errors 4s 837ms

Then the salt event log on server should contain no failures 7s 102ms Show Error +
                                            
Found 21 failures in salt event log: # Failure 2 , _stamp: 2026-04-28T14:02:19.603707 { "__id__": "mgr_ansible_installed", "__run_num__": 20, "__sls__": "ansible", "changes": {}, "comment": "An error was encountered while installing package(s): Zypper command failure: Running as unit: run-p10308-i10309.scope; invocation ID: 486d1d8da3f0409aa12c0fab746738c0\nPackage 'ansible' not found.Loading repository data...\nReading installed packages...", "duration": 1463.101, "name": "mgr_ansible_installed", "result": false, "start_time": "16:02:17.979801" } # Failure 3 , _stamp: 2026-04-28T15:41:24.014444 { "__id__": "pkg_installed", "__run_num__": 11, "__sls__": "packages.pkginstall", "changes": {}, "comment": "An error was encountered while installing package(s): Zypper command failure: Running as unit: run-p14222-i14223.scope; invocation ID: 288cd4087c9d4be8b0f98a9671e8d740Loading repository data...\nReading installed packages...\nResolving package dependencies...\n\nProblem: 1: nothing provides 'python3-rpm' needed by the to be installed python3-mgr-push-5.2.3-2.1.uyuni.noarch\n Solution 1: do not install mgr-push-5.2.3-2.1.uyuni.noarch\n Solution 2: break python3-mgr-push-5.2.3-2.1.uyuni.noarch by ignoring some of its dependencies\n\nChoose from above solutions by number or cancel [1/2/c/d/?] (c): c", "duration": 1859.24, "name": "pkg_installed", "result": false, "start_time": "17:41:22.147502" } # Failure 4 , _stamp: 2026-04-28T15:57:38.283380 { "__id__": "mgr_buildimage", "__run_num__": 1, "__sls__": "images.docker", "changes": {}, "comment": "Module function docker.build threw an exception. Exception: Build failed for https://github.com/uyuni-project/uyuni.git#:testsuite/features/profiles/temporary/docker_profiles/cloud_aws/Docker. Error(s) follow:\n\nmanifest for ip-172-16-1-175.eu-central-1.compute.internal/suse/sle15:15.7 not found: manifest unknown: manifest unknown", "duration": 13552.827, "name": "docker.build", "result": false, "start_time": "17:57:24.702231" } # Failure 5 , _stamp: 2026-04-28T15:57:38.283380 { "__id__": "mgr_pushimage", "__run_num__": 2, "__sls__": "images.docker", "changes": {}, "comment": "One or more requisite failed: images.docker.mgr_buildimage", "duration": 0.005, "name": "docker.push", "result": false, "start_time": "17:57:38.255567" } # Failure 6 , _stamp: 2026-04-28T15:57:38.283380 { "__id__": "mgr_registries_logout", "__run_num__": 3, "__sls__": "images.docker", "changes": {}, "comment": "One or more requisite failed: images.docker.mgr_pushimage", "duration": 0.005, "name": "docker.logout", "result": false, "start_time": "17:57:38.255884" } # Failure 7 , _stamp: 2026-04-28T15:59:02.047294 { "__id__": "mgr_buildimage", "__run_num__": 1, "__sls__": "images.docker", "changes": {}, "comment": "Module function docker.build threw an exception. Exception: Build failed for https://github.com/uyuni-project/uyuni.git#:testsuite/features/profiles/temporary/docker_profiles/cloud_aws/Docker. Error(s) follow:\n\nmanifest for ip-172-16-1-175.eu-central-1.compute.internal/suse/sle15:15.7 not found: manifest unknown: manifest unknown", "duration": 13574.525, "name": "docker.build", "result": false, "start_time": "17:58:48.442068" } # Failure 8 , _stamp: 2026-04-28T15:59:02.047294 { "__id__": "mgr_pushimage", "__run_num__": 2, "__sls__": "images.docker", "changes": {}, "comment": "One or more requisite failed: images.docker.mgr_buildimage", "duration": 0.005, "name": "docker.push", "result": false, "start_time": "17:59:02.017063" } # Failure 9 , _stamp: 2026-04-28T15:59:02.047294 { "__id__": "mgr_registries_logout", "__run_num__": 3, "__sls__": "images.docker", "changes": {}, "comment": "One or more requisite failed: images.docker.mgr_pushimage", "duration": 0.004, "name": "docker.logout", "result": false, "start_time": "17:59:02.017334" } # Failure 10 , _stamp: 2026-04-28T16:05:01.460593 { "__id__": "mgr_buildimage", "__run_num__": 1, "__sls__": "images.docker", "changes": {}, "comment": "Module function docker.build threw an exception. Exception: Build failed for https://github.com/uyuni-project/uyuni.git#:testsuite/features/profiles/temporary/docker_profiles/cloud_aws/Docker. Error(s) follow:\n\nmanifest for ip-172-16-1-175.eu-central-1.compute.internal/suse/sle15:15.7 not found: manifest unknown: manifest unknown", "duration": 14357.055, "name": "docker.build", "result": false, "start_time": "18:04:47.072188" } # Failure 11 , _stamp: 2026-04-28T16:05:01.460593 { "__id__": "mgr_pushimage", "__run_num__": 2, "__sls__": "images.docker", "changes": {}, "comment": "One or more requisite failed: images.docker.mgr_buildimage", "duration": 0.005, "name": "docker.push", "result": false, "start_time": "18:05:01.429705" } # Failure 12 , _stamp: 2026-04-28T16:05:01.460593 { "__id__": "mgr_registries_logout", "__run_num__": 3, "__sls__": "images.docker", "changes": {}, "comment": "One or more requisite failed: images.docker.mgr_pushimage", "duration": 0.004, "name": "docker.logout", "result": false, "start_time": "18:05:01.429971" } # Failure 13 , _stamp: 2026-04-28T16:06:07.068482 { "__id__": "mgr_buildimage", "__run_num__": 1, "__sls__": "images.docker", "changes": {}, "comment": "Module function docker.build threw an exception. Exception: Build failed for https://github.com/uyuni-project/uyuni.git#:testsuite/features/profiles/temporary/docker_profiles/cloud_aws/Docker. Error(s) follow:\n\nmanifest for ip-172-16-1-175.eu-central-1.compute.internal/suse/sle15:15.7 not found: manifest unknown: manifest unknown", "duration": 13755.962, "name": "docker.build", "result": false, "start_time": "18:05:53.282878" } # Failure 14 , _stamp: 2026-04-28T16:06:07.068482 { "__id__": "mgr_pushimage", "__run_num__": 2, "__sls__": "images.docker", "changes": {}, "comment": "One or more requisite failed: images.docker.mgr_buildimage", "duration": 0.005, "name": "docker.push", "result": false, "start_time": "18:06:07.039302" } # Failure 15 , _stamp: 2026-04-28T16:06:07.068482 { "__id__": "mgr_registries_logout", "__run_num__": 3, "__sls__": "images.docker", "changes": {}, "comment": "One or more requisite failed: images.docker.mgr_pushimage", "duration": 0.004, "name": "docker.logout", "result": false, "start_time": "18:06:07.039574" } # Failure 16 , _stamp: 2026-04-28T16:07:16.177789 { "__id__": "mgr_buildimage", "__run_num__": 1, "__sls__": "images.docker", "changes": {}, "comment": "Module function docker.build threw an exception. Exception: Build failed for https://github.com/uyuni-project/uyuni.git#:testsuite/features/profiles/temporary/docker_profiles/cloud_aws/Docker. Error(s) follow:\n\nmanifest for ip-172-16-1-175.eu-central-1.compute.internal/suse/sle15:15.7 not found: manifest unknown: manifest unknown", "duration": 13764.113, "name": "docker.build", "result": false, "start_time": "18:07:02.382597" } # Failure 17 , _stamp: 2026-04-28T16:07:16.177789 { "__id__": "mgr_pushimage", "__run_num__": 2, "__sls__": "images.docker", "changes": {}, "comment": "One or more requisite failed: images.docker.mgr_buildimage", "duration": 0.005, "name": "docker.push", "result": false, "start_time": "18:07:16.147170" } # Failure 18 , _stamp: 2026-04-28T16:07:16.177789 { "__id__": "mgr_registries_logout", "__run_num__": 3, "__sls__": "images.docker", "changes": {}, "comment": "One or more requisite failed: images.docker.mgr_pushimage", "duration": 0.004, "name": "docker.logout", "result": false, "start_time": "18:07:16.147439" } # Failure 19 , _stamp: 2026-04-28T16:08:19.144384 { "__id__": "mgr_buildimage", "__run_num__": 1, "__sls__": "images.docker", "changes": {}, "comment": "Module function docker.build threw an exception. Exception: Build failed for https://github.com/uyuni-project/uyuni.git#:testsuite/features/profiles/temporary/docker_profiles/cloud_aws/Docker. Error(s) follow:\n\nmanifest for ip-172-16-1-175.eu-central-1.compute.internal/suse/sle15:15.7 not found: manifest unknown: manifest unknown", "duration": 13674.461, "name": "docker.build", "result": false, "start_time": "18:08:05.438606" } # Failure 20 , _stamp: 2026-04-28T16:08:19.144384 { "__id__": "mgr_pushimage", "__run_num__": 2, "__sls__": "images.docker", "changes": {}, "comment": "One or more requisite failed: images.docker.mgr_buildimage", "duration": 0.005, "name": "docker.push", "result": false, "start_time": "18:08:19.113539" } # Failure 21 , _stamp: 2026-04-28T16:08:19.144384 { "__id__": "mgr_registries_logout", "__run_num__": 3, "__sls__": "images.docker", "changes": {}, "comment": "One or more requisite failed: images.docker.mgr_pushimage", "duration": 0.004, "name": "docker.logout", "result": false, "start_time": "18:08:19.113814" } # Failure 22 , _stamp: 2026-04-28T16:49:56.589886 { "__id__": "mgr_ansible_installed", "__run_num__": 21, "__sls__": "ansible", "changes": {}, "comment": "An error was encountered while installing package(s): Zypper command failure: Running as unit: run-p21262-i21263.scope; invocation ID: 0183fab903a7487b99a7f236df3ef22f\nPackage 'ansible' not found.Loading repository data...\nReading installed packages...", "duration": 1663.196, "name": "mgr_ansible_installed", "result": false, "start_time": "18:49:54.339222" } (ScriptError) ./features/step_definitions/salt_steps.rb:526:in `/^the salt event log on server should contain no failures$/' features/finishing/srv_debug.feature:16:in `the salt event log on server should contain no failures'

Then the taskomatic logs should not contain errors 4s 607ms

Then the log messages should not contain out of memory errors 2s 677ms

Then the word "scc.suse.com" does not occur more than 100 times in "/var/log/rhn/rhn_web_ui.log" on "server" 0s

Then the word "scc.suse.com" does not occur more than 50 times in "/var/log/rhn/rhn_taskomatic_daemon.log" on "server" 0s